
ABSTRACT
In setting catchment nutrient limits aimed at meeting water quality objectives, some regional councils have adopted or are considering a natural capital approach to set farm-scale nutrient discharge allowances, whereby soils with a higher natural capital are given a higher discharge allowance. Land Use Capability (LUC) classes have been adopted as a proxy for natural capital. We examine the suitability of LUC for this purpose and identify issues that should be considered when using LUC in the context of a natural-capital-based approach to set nutrient limits, particularly in moisture-deficient areas where irrigation is becoming a major management tool, such as in Canterbury. The main issues are that LUC classes 1–4 are assessed on arable suitability not pastoral suitability, the high variability of pastoral productivity within an LUC class, and the limited correlation of LUC class with nitrogen losses. We propose some modifications to the LUC-based approach to address these issues.
Introduction
The recently amended National Policy Statement for Freshwater Management 2014 (NPS) in New Zealand (Ministry for the Environment Citation2014) states the urgency of addressing the issues of non-point-source pollution of the nation's waterways. It requires regional councils to determine water quality objectives for the freshwater bodies in their region, and to set flow, allocation and water quality limits that will achieve these objectives. Councils, as part of their regional land and water plans, are beginning to implement the NPS by setting catchment nutrient loads and allocating nutrient allowances or quota to landowners.
A number of land-based allocation approaches have been considered by regional councils and industry groups, including sector benchmarking, grandparenting, simple averaging and natural capital (Ford Citation2012; Rotorua Te Arawa Lakes Programme Citation2014). Most of these approaches assign a nitrogen loss rate based on land use; a natural capital approach differs by assigning the nitrogen loss rate by soil or soil attribute.
A natural capital approach to allocating nitrogen allowances was developed for the One Plan, the land and water regional plan for the Manawatu-Wanganui Region (Horizons Regional Council Citation2012). Soil natural capital, as used in the One Plan, is defined as the ‘underlying capacity of the soil to retain and supply nutrients and water, along with its capacity to provide an environment to sustain legume and grass growth under the pressure of grazing animals’ (Mackay Citation2013b, para. 13). The rationale for the natural capital approach was two-fold. First, it provides an approach that links the nitrogen allocation required to meet water quality outcomes directly with the characteristics of the land resource, and second, it recognises that not all land is the same, differing in its productive capacity and versatility. These attributes are recognised in the marketplace and reflected in land prices (Mackay Citation2013a).
As no methods were available at the time for calculating natural capital, an alternative proxy was defined as the ability of a soil to sustain a rain-fed legume-based pasture with minimum inputs. This was quantified by adopting the attainable carrying capacity index (under a typical sheep and beef farming system) from the extended legends of the Land Use Capability (LUC) worksheets (Horizons Regional Council Citation2012). The LUC classification system is described by Lynn et al. (Citation2009). Land with higher natural capital, i.e. with higher average attainable stock-carrying capacity (LUC Class 1), is given a higher nutrient loss allowance than land with lower natural capital, or lower average attainable stock-carrying capacity (LUC Class 7). This allocation of nutrient loss allowances thereby encourages intensification on the more productive and resilient land.
More recently, the Tukituki Catchment Proposal Board of Inquiry has included nitrogen loss limits based on LUC Class in its final decision on the Hawke's Bay Plan Change 6 to the Regional Resource Management Plan (Environmental Protection Authority Citation2014).
As described in the evidence submitted in support of the One Plan, the advantage of using LUC as a proxy for natural capital is that the information is available nationwide and that it is already established as the basis for sustainable land evaluation (Mackay Citation2013b). Criticisms by submitters include that LUC Classes do not reflect actual or predicted nitrogen losses, and that proxy values do not reflect technological advances since the 1980s (Horizons Regional Council Citation2012).
This paper examines the LUC Class and its appropriateness for use in setting farm nitrogen leaching limits. We focus on the Canterbury Region in our analysis, and have suggested some potential modifications to the LUC approach when dealing with flat to gently sloping arable land (<15°), especially in dry climates, where irrigation is becoming a major management practice.
What is Land Use Capability?
LUC Classification is defined as ‘a systematic arrangement of different kinds of land according to those properties that determine its capacity for long-term sustained production’ (Lynn et al. Citation2009). Capability is used in the sense of ‘suitability for productive use or uses’ after taking into account the physical limitations of the land.
The Classification of land according to Land Use Capability in New Zealand had its beginnings in the passing of the Soil Conservation and Rivers Control Act in 1941 and was well established by the time soil conservation farm planning was formally adopted by the Soil Conservation and Rivers Control Council (SCRCC) in 1954 (Roche Citation1994). It was initially used for farm-scale, catchment and regional planning studies, and eventually morphed into the nationwide New Zealand Land Resource Inventory (NZLRI) with the passing of the 1967 Water and Soil Conservation Act. The NZLRI (NWASCO Citation1975–Citation79, Citation1979; NWASCA Citation1986a,Citationb) is a spatial database and a series of map worksheets that describe Land Resource Inventory and Land Use Capability for New Zealand at regional scales of 1:50,000.
Categories of the LUC Classification
The LUC classification has three components—LUC Class, LUC Subclass and LUC unit—each of which is represented by a number or symbol. illustrates the relationship between the three components of the LUC classification.
Figure 1. Components of the Land Use Capability classification (source: Lynn et al. Citation2009).
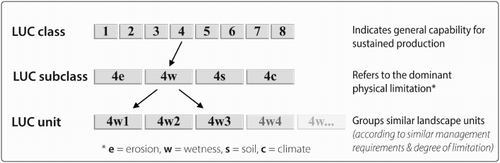
The LUC Class is the broadest grouping of the capability classification. It is an assessment of the land's capability for use, taking into account its physical limitations and its versatility for sustained production. There are eight Classes, denoted by Arabic numerals, with limitations to use increasing, and versatility of use decreasing, from LUC Class 1 to LUC Class 8 (). LUC Classes 1–4 are suitable for arable cropping (including vegetable cropping), horticultural (including vineyards and berry fields), pastoral grazing, tree crop or production forestry use. Classes 5–7 are not suitable for arable cropping but are suitable for pastoral grazing, tree crop or production forestry use, and in some cases vineyards and berry growing. The use limitations reach a maximum with LUC Class 8 land, which is unsuitable for sustainable grazing or production forestry, and is best managed for catchment protection and/or conservation or biodiversity.
Figure 2. Increasing limitations to use and decreasing versatility of use from LUC Class 1 to LUC Class 8 (modified from SCRCC [Citation1974]). † includes vegetable cropping (source: Lynn et al. Citation2009).
![Figure 2. Increasing limitations to use and decreasing versatility of use from LUC Class 1 to LUC Class 8 (modified from SCRCC [Citation1974]). † includes vegetable cropping (source: Lynn et al. Citation2009).](/cms/asset/7732b487-bf71-494c-a3c4-c961bc1d1a53/tnza_a_1092996_f0002_b.gif)
The LUC Subclass is a subcategory of the LUC Class by which the main kind of physical use limitation or hazard is identified. LUC Subclass can be expressed as a question: ‘What is the single most important factor that is currently limiting sustainable production on this land?’ Four limitations are recognised:
e = erodibility, where susceptibility to erosion is the dominant limitation
w = wetness, where a high water table, slow internal drainage and/or flooding constitutes the dominant limitation
s = soil, where the dominant limitation is within the rooting zone. This can be due to shallow soil profiles, subsurface pans, stoniness, rock outcrops, low soil water-holding capacity, low fertility (where this is difficult to correct), salinity or toxicity
c = climate, where the climate is the dominant limitation. This can be summer drought, excessive rainfall, unseasonal or frequent frost and/or snow, and exposure to strong winds or salt spray.
The LUC Unit is the most detailed component of the LUC classification. LUC Subclasses can be subdivided into a number of LUC Units and identified by a number (e.g. 3s1, 3s2, etc.). LUC Units group together areas where similar land inventories have been mapped, which require the same kind of management, the same kind and intensity of conservation treatment, and are suitable for the same kind of crops, pasture or forestry species, with similar potential yields. Regional productivity indices were created for LUC Units as part of the NZLRI mapping project. Indices include three levels of stock-carrying capacity for pastoral use and a Pinus radiata site index for forestry, now largely superseded by the 300 Index (Kimberley et al. Citation2005).
When assessing and allocating LUC Classes and Subclasses the following assumptions are made:
The permanent physical limitations of the land remain.
The rectifiable limitations may be removed.
An above-average level of land management is practised.
Appropriate soil conservation measures will be applied and maintained.
Where it is feasible to either remove or significantly reduce the physical limitation (e.g. installing drainage or permanent irrigation; improving soil fertility; removing surface gravel, stones or boulders; or minimising erosion), then the land is assessed as if the limitation has already been removed or managed (specific details are outlined in section 3.3.5 of Lynn et al. [Citation2009]).
Application of LUC Classes in Horizons Regional Council's One Plan
The Horizons One Plan aims to limit non-point-source nitrogen losses to help meet water quality objectives and to promote continued economic growth in the region. The case was made that the limits should be set according to the natural capital of the soil (Clothier et al. Citation2007), encouraging more intensive use on the higher quality soils. The LUC Class is used in the Horizons Regional Council's One Plan as a proxy for soil natural capital (Mackay et al. Citation2008).
The methodology for determining the leaching limits for each LUC Class in the One Plan is as follows (Horizons Regional Council Citation2012; Mackay Citation2013a,b; A. Mackay, pers. comm.):
Estimate the potential productive capacity of a legume-based pasture fixing nitrogen (N) biologically under a ‘typical sheep and beef farming system’ for each LUC Unit. This information was derived from the ‘attainable potential carrying capacity’ in the extended legends of the LUC worksheets (NWASCO Citation1975–Citation79; NWASCA Citation1986a,Citationb). A legume-pasture dry matter base provides one indicator of the underlying productive capacity of the soil, taking into account the use of phosphate (P), sulphate (S) and potassium (K) fertilisers, lime inputs, trace elements and technologies to control pests and weeds. It reflects the underlying capacity of soil to retain and supply nutrients and water, and the capacity of the soil to provide an environment to sustain legume and grass growth under the pressure of grazing animals. For each catchment of interest, the average attainable potential carrying capacity weighted by area is calculated for each LUC Class.
Transform the average attainable stock-carrying capacity rates to pasture production (kg DM/ha/yr) on the basis that a stock Unit consumes 550 kg of dry matter (DM) and assuming 80% of the grown pasture is utilised by the grazing animal.
Use these pasture production values in the OVERSEER® Nutrient Budget model (OVERSEER Management Services Ltd Citation2013) to calculate N-leaching losses from a legume-based pasture under optimum management of a dairy farm for each LUC Class. These derived N losses provide a basis for rating or ranking the soils in a catchment on the basis of their natural capital stocks or productive capacity for legume-based pasture.
Determine a catchment transmission coefficient for export of nitrogen from the land to the waterbodies in each catchment.
Determine the area of each LUC Class in the catchment.
Calculate the total N output load for all the land in the catchment by multiplying the OVERSEER-derived N leaching losses for each LUC Class by the areal extent of each LUC Class and a transmission coefficient. In the case where the total N load from land needs to be reduced to meet a water quality outcome (river N load), the LUC-based N limits should be reduced proportionally until the water quality outcome is achieved.
Consider if it is appropriate to account for the fact that there are limited mitigation and land use options on land with low levels of natural capital stocks or other socio-economic factors by adjusting the LUC-based N limits for some soils in the catchment.
The outcome of this procedure is a table of leaching limits by LUC Class (table 13.2 in the Decision Version of the One Plan [Horizons Regional Council Citation2014] reproduced here as ). Higher leaching limits are assigned to land containing soils with LUC Classes that are considered to be generally capable of higher production and greater versatility. Table 13.2 in the Decision Version of the One Plan contains limits reducing over a 20-year period rather than a single value per LUC Class.
Table 1. Reproduction of table 13.2 of the Decision Version of the One Plana with reducing Class limits over a 20-year period (Horizons Regional Council Citation2014).
We note that under step 3 above, a single set of soil properties must be selected for use in the OVERSEER model. We observe that it is difficult to fairly represent the average soil properties for an LUC Class. For example, what soil characteristics would be selected for LUC Class 3 in a catchment containing both deep soils with wetness limitations (3w) and shallow soils with soil depth limitations (3s)?
Limitations with the use of LUC Class in setting nitrogen loss limits
While the LUC Class has the advantage of being well established and readily available, there are a number of issues with using LUC Class when setting nitrogen leaching limits according to a natural capital principle, particularly in the context of applying this approach in moisture-deficient areas of New Zealand.
The LUC classification is subjective, heavily biased towards meeting the needs of soil conservation and its capture in the NZLRI dates from the mid-1970s to the mid-1990s. In the context of setting nitrogen leaching limits, the main issues relate to the facts that LUC Classes 1–4 are assessed on arable suitability rather than on pastoral suitability; there is high variability of pastoral productivity within an LUC Class; and there is limited correlation of LUC Class with nitrogen losses, as discussed below.
LUC Classes 1–4 are assessed on arable suitability rather than on pastoral suitability
Land assigned to LUC Classes 1–4 must be suitable for arable use, where arable use is interpreted as being suitable for tillage for cropping, and the land is capable of growing at least one of the common annual field crops (e.g. wheat, barley, maize) with average yields under good management without any permanent adverse soil effects. LUC Classes 1 and 2 have minimal and slight limitations for arable use, respectively. LUC Class 3 has moderate limitations for arable use and requires the application of soil conservation measures for arable production to be sustainable. LUC Class 4 has severe limitations for arable use and requires the application of intensive soil conservation measures for production to be sustainable.
The land's suitability for arable use does not necessarily equate with its potential pastoral productivity, especially for those Classes of land with a wetness, wind erosion or climatic limitation. In other words, the LUC Class focuses on soil versatility, which is not the same as its ‘capacity … to sustain legume and grass growth'. This contributes to the high level of pastoral productivity within an LUC Class as shown below.
Variability of pastoral productivity within an LUC Class
Regional productivity indices were created for LUC Units as part of the NZLRI mapping project (NWASCO Citation1979). The indices include three levels of stock-carrying capacity for pastoral use. Carrying capacities are based on sheep stock Units (su) where one stock Unit is equivalent to a 55 kg ewe rearing one lamb. Three types of carrying capacity were assigned to each LUC Unit:
Present average: The number of stock Units per hectare (su/ha) that the ‘average farmer’ was typically carrying on a particular LUC Unit.
Top farmer: The number of stock Units per hectare that the farmer with the highest level of stocking rate, with at least average stock performance, was carrying on a particular LUC Unit.
Attainable potential (rain-fed): The number of stock Units per hectare capable of being carried on a particular LUC Unit, assessed within the limits of present technology and given favourable socio-economic conditions.
For some LUC Units the attainable potential under irrigation was also estimated.
The NZLRI stock-carrying capacities only apply to ‘typical sheep and beef farming systems’ and do not apply to dairying or cropping systems (Land Resources Group Citation1981). For national consistency the following criteria were adhered to:
The land was assumed to be managed exclusively for livestock grazing.
Only on-farm cropping for supplementary feed supply was considered (off-farm feed supply excluded).
It was assumed that the stock were carried all year (i.e. limited by winter-carrying capacity in most instances) except for high-country areas where stock were carried for part of the year only. In this case, seasonal figures were converted to an annual stocking rate equivalent.
It was assumed that each LUC Unit was managed as a discrete entity.
The range of stock-carrying capacities incorporated within an LUC Class is considerable, reflecting the focus on soil versatility, variability associated with the LUC Subclass limitations, and the variability in landform and slopes, soil parent materials, degree of soil development, soil depth, stoniness, drainage, texture and climate. Estimates of attainable stock-carrying capacities for LUC Classes from the NZLRI mapped in the Canterbury Region under rain-fed agricultural conditions are shown in . They show a consistent trend of decreasing mean potential carrying capacity with increasing LUC Class, but there is wide overlap in the range of potential carrying capacity for Classes 1–4 and Classes 5–7. Differences between Classes are mainly reflected in differences in the minimum potential carrying capacity. Note that these estimates pre-date post-1980s advances in agricultural technology such as improved pasture species, increasing use of N fertiliser, and the use of off-paddock facilities to overcome wet soil limitations.
Table 2. Estimates of NZLRI attainable stock-carrying capacities for LUC Classes mapped in the Canterbury Region under rain-fed agricultural conditions (from Hunter et al. [Citation1980] and Van Berkel [Citation1983]).
The variability in potential carrying capacity within each Subclass limitation (see Prickett [Citation1978] and Van Berkel [Citation1983]) is shown in . These data help to explain the origin of the wide range in potential carrying capacity within LUC Classes. For example, the highest potential carrying capacity occurs on LUC Class 3c2 land with a climatic limitation. LUC Class 3c2 incorporates lowland downs, terraces and floodplains in moderately high-rainfall districts with predominantly fine-textured Lowland Yellow Brown Earth soils (Brown Soils; Hewitt Citation2010). High summer rainfalls limit the types of crops that can be grown without artificial drying on this Unit, but higher rainfall is a benefit to rain-fed pasture production, raising the potential pasture production on this land above that for LUC Class 1 and 2 land Units.
Table 3. Estimates of NZLRI attainable stock carrying capacities for LUC Class and LUC Subclasses mapped in the Canterbury Region under rain-fed agricultural conditions (derived from Prickett [Citation1978] and Van Berkel [Citation1983]).
LUC Class 4s Units show the greatest range (14 su/ha) in stock-carrying capacities. LUC Unit 4s3, with a potential carrying capacity of 19 su/ha, occurs on lowland to lower montane flat to undulating terraces and fans with shallow stony soils and a mainly cool, moist climate with predominantly Yellow Grey to Yellow Brown Earth intergrade soils (Acid Orthic Brown Soils; Hewitt Citation2010). In contrast, LUC Unit 4s14, with a potential carrying capacity of 5 su/ha, occurs on lower montane flat to rolling high country terraces and moraines with shallow stony, very low-fertility soils. The soils are predominantly upland and high country Yellow Brown Earth soils (Typic and Acidic Allophanic Brown Soils; Hewitt Citation2010). Pasture productivity on LUC Unit 4s14 land is largely limited by severe droughtiness and cool winters.
The greatest range in stock-carrying capacities for non-arable Classes is shown by LUC Units contained in LUC Class 6e. LUC Units 6e8 and 6e16 have potential carrying capacities of 14 su/ha. LUC Unit 6e8 incorporates lowland to lower montane, strongly rolling to moderately steep, loess-covered downlands and hill country in summer moisture-deficient eastern areas with predominantly Yellow Grey Earth soils (Mottled Fragic Pallic soils; Hewitt Citation2010). LUC Unit 6e16 is described as lower montane strongly rolling to steep, low-fertility hill country developed mainly on gravels and colluvium with a moderate rainfall with predominantly lowland Yellow Grey Earth soils (Fragic Perch-Gley Pallic and/or Mottled Firm Brown soils; Hewitt Citation2010). In contrast, LUC Class 6e29, which experiences cooler temperatures and a reduced number of growing degree days >5 °C, has an attainable potential carrying capacity of only 2 su/ha, and incorporates montane strongly rolling to steep short slopes with low-fertility soils in eastern high-country districts with predominantly upland and high-country Yellow Brown Earth soils (Typic and Acidic Allophanic Brown Soils, and Allophanic Firm Brown Soils; Hewitt Citation2010).
These examples illustrate how the variability contained in an LUC Class, and even at the LUC Subclass level, makes attainable stock-carrying capacity ‘aggregated by LUC Class' a poor proxy for soil ‘natural capital’. Some LUC Class 3 land actually has higher productivity under rain-fed pastoral farming systems than LUC Class 1 land. Similarly, the best of the LUC Class 6 land is comparable to some LUC Class 3 land based on its mean carrying capacity potential under rain-fed pastoral farming systems.
LUC Class does not correspond well with nitrogen loss rates
While LUC Class is identified in the One Plan as a proxy for soil natural capital and not leaching, the underlying assumption in using LUC Class (given the objective of maintaining water quality) is that higher-class soils can attain higher production with lower inputs and have less potential for leaching than soils with poorer LUC Class ranking. The greater inputs required or the lower capacity for nutrient retention on the poorer LUC Class soils leads to greater leaching losses. As argued by Mackay (in Barton Citation2012), this is generally true, but just as there is considerable variability of productivity within the LUC Classes, there is also considerable variability in the proneness of soils to leach within each LUC Class, as illustrated in the following examples.
In the Canterbury Region, under rain-fed agricultural conditions, LUC Class 3w3 has the same attainable stock-carrying capacity as LUC Class 1c1: 18 su/ha. The Gley and Recent Gley soils mapped in LUC Class 3w3 have a significant denitrification capacity, which reduces the actual nitrogen leaching from this landscape due to the relatively high water tables and poor soil drainage. In the Horizons One Plan, a 30% lower cumulative nitrogen leaching maximum is set for LUC Class 3 compared with LUC Class 1, yet in this case the ability to mitigate nitrogen leaching is greater for LUC Class 3w3 than for LUC Class 1c2 land.
Another example of LUC Class 3 land in Canterbury that has high productivity and low leaching is land prone to wind erosion near the major gorges. This land is classified as LUC Class 3e5 because of the risk of wind erosion under cultivation. Land classified as 3e5 to the north-east of Methven encompasses three soil series: deep Kowai soils, moderately deep Highbank soils and shallow Lyndhurst soils. These soils have a wide range of productive potential under rain-fed agriculture and have a wide range of leaching potentials. The land is correctly classified as LUC Class 3e5 because it retains its vulnerability to wind erosion under arable use—but this classification does not reflect either potential productivity or leaching potential.
Hewitt et al. (Citation2015) illustrates the variability in nitrate storage and reduction, and hence relative nitrate leaching, for a sequence of soils within LUC Class 3 with e, w, s and c Subclass limitations (). This common sequence of soils, present in the eastern alluvial basins and plains of both the North and South Islands, ranges from well-drained deep loamy soils to shallow stony soils, and an associated soil with poor drainage status. The wide range in nitrate storage and reduction, and hence relative nitrate leaching within an LUC Class, suggests that LUC Class may not be appropriate for use in setting limits for farm nitrogen losses.
Table 4. Variability in nitrate storage and reduction, and hence relative nitrate leaching, for a sequence of soils within LUC Class 3, on the eastern plains (adapted from Hewitt et al. [Citation2015]).
Rain-fed productivity vs irrigated productivity
Much of the Canterbury Plains has undergone intensification through irrigation, with about 500,000 ha of irrigated land by 2009 (Environment Canterbury Citation2014). This has occurred because the dry summer climate, with an annual rainfall ranging from 600–850 mm, limits productivity from most soils including the highest-capability soils. As already noted, some poorly drained soils (LUC Classes 2–4) have higher productivity than LUC Class 1 soils under rain-fed conditions as these soils are not as susceptible to droughts in the summer.
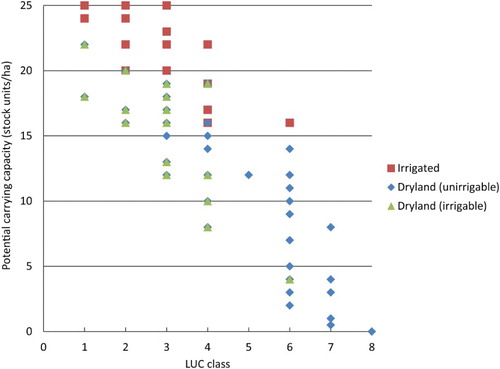
The LUC extended legend gives a measure of attainable carrying capacity under irrigation for some but not all of the LUC Units. For example, the potential carrying capacity on LUC Unit 2c1 increases by 7 su/ha to 24; 3s5 increases by 9 su/ha to 22; 6s7 increases by 6 su/ha to 10; 6s8 increases by 9 su/ha to 16. shows the range of rain-fed values (blue diamond and green triangle symbols) in the Selwyn-Waihora water management zone and their irrigated equivalents (red square symbols) where this information is available. The difference between the green triangle and red square symbols highlights the effect of irrigation by LUC Class.
Figure 3. Potential carrying capacity values found in the Selwyn-Waihora Zone. Diamond (blue) and triangle (green) symbols are the rain-fed values; triangles (green) indicate the dryland values for irrigable LUC (land use capability) units and square symbols (red) show their corresponding irrigated carrying capacity. Diamond (blue) symbols indicate LUC units that are not irrigable.
Setting nitrate leaching limits according to rain-fed productivity in Canterbury and other east coast areas of New Zealand may not be the best approach given that much of Canterbury and other east coast land is (or will be) irrigated.
Large areas of LUC Class 3 and 4 land
More than 29% of the Canterbury Region is classified as being suitable for arable production but only 0.7% is considered as having minimal limitations to arable use (LUC Class 1; ). LUC Classes 3 and 4 with moderate and severe limitations to arable use comprise 11.5% and 11.1% of the region, respectively. Because of its prevalence and capacity for development, the LUC Class 3 and 4 land is of very high regional importance to the economy of Canterbury.
Table 5. Area in hectares of LUC Classes 1–8, estuaries, lakes, quarries, rivers and towns in the Canterbury Region and nationally as mapped during the NZLRI survey, 1975–1999.
Proposed modifications
We suggest that the soil natural capital approach, as applied in the One Plan, could be modified when applying a natural capital approach in Canterbury or other regions (e.g. eastern parts of the North Island) where irrigation is becoming a major management practice, there are high levels of variability of productivity and leaching within some LUC Classes, and where LUC Class 3 and 4 land and soils are economically significant.
These modifications are:
Use the attainable potential carrying capacity of irrigated pasture rather than rain-fed pasture for land that is potentially irrigable.
Combine LUC Classes 1–3 (or perhaps other groupings of LUC Units) to recognise the high productivity and economic significance of the LUC Class 3 land.
As an alternative to using LUC Class, adopt an approach that focuses more on the capacity of the soil to retain nutrients.
The first modification was trialled in the Selwyn-Waihora Zone and is described in Lilburne et al. (Citation2013). compares the mean potential stock-carrying capacity by LUC Class where irrigated rather than rain-fed productivity indices are used. The resulting nitrogen loss limits (following the procedure listed above but with irrigated rather than rain-fed productivity values) are provided in . There is less separation between LUC Classes 1–4 when irrigated productivity indices are used; however, due to the predominance of LUC Class 3 land in this particular sub-catchment, the increase in farm nitrogen loss limits for LUC Classes 3 and 4 was small. They concluded that the modification offered a valid option for recognising the productivity and importance of the LUC Class 2–4 land to the economy of Canterbury while still maintaining the philosophy of the natural capital approach to nutrient allocation. The second listed modification (to aggregate LUC Classes 1–3) would be a simpler alternative way to achieve a similar effect.
Figure 4. Mean potential livestock carrying capacity under rain-fed and irrigated pasture agriculture for LUC Class 1–8 land.
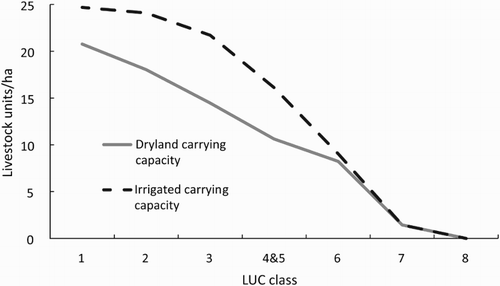
Table 6. Nitrogen loss limits (kg/ha) for the Selwyn-Waihora Zone calculated using the irrigated and rain-fed productivity indices.
There is a range of options for implementing the third modification, which seeks to employ a natural capital measure that is more pertinent to limiting nitrogen losses. For example, one option, the ‘nutrient vulnerability allocation approach’, is described in Daigneault et al. (Citation2013) and Lilburne (Citation2015). In this method, nutrient limits are set according to the level of filtering service (Hewitt et al. Citation2015) provided by the different soils. The higher the level of filtering service provided by a soil, the less it will leach. The method comprises two steps. The first is to assign an initial allowance sufficient to allow a landowner to run a rain-fed sheep and beef farm system. In most catchments, the cumulative load from 100% rain-fed sheep and beef farms will be less than the catchment's target load. When this is the case, the difference between cumulative and target loads is then redistributed in a second step according to the level of filtering service provided by the soil. Soils with a high filtering capacity are allocated more of the remaining load (proportional to their filtering capacity), thereby encouraging intensification on the least leaky soils. Soils with poor filtering capability are allocated a smaller portion of the remaining load, potentially limiting the intensification of these leakier soils. Land that has severe limitations to intensive agricultural production (e.g. too steep) is not given any additional load.
In a preliminary implementation of this approach, a simple model for nitrate leaching vulnerability for Canterbury soils (Webb et al. Citation2010; Webb & Lilburne Citation2011) was used to characterise soil filtering capacity. Soils with very high vulnerability reflect the soils’ poor capacity for filtering nitrogen, and soils with low vulnerability indicate soils with relatively high filtering capacity. This relative capacity is quantified by normalising modelled leaching results from OVERSEER on a nominal land use (e.g. the very vulnerable soils have 30% of the filtering capacity of the least vulnerable soils). This method was applied in the South Canterbury Coastal Stream Zone area (Lilburne Citation2015).
This method and other variations of a natural-capital-based approach that focus on the capacity of the soil to retain nutrients would need further development and testing before they could be compared with the LUC-based approach. The specific variation above focuses on nitrogen filtering whereas a metric that combines a capacity for filtering or retaining other nutrients might be more useful (to avoid encouraging intensification on soils with high nitrogen filtering capacity but poor soil retention capacity leading to sediment and phosphorus losses, for example). We note there is ongoing research into quantifying natural capital stocks and services and urge progress with this work (Dominati et al. Citation2014; Hewitt et al. Citation2015).
Conclusion
The LUC classification was designed to provide a sense of the suitability of land for long-term sustained productive use or uses after taking into account the different physical limitations of the land. At first glance this would seem to be a good proxy for natural capital. However, there are some issues that ought to be considered when using LUC Classes in the context of a natural-capital-based approach to setting nutrient limits, particularly where the natural capital stocks are ranked on their productive capacity for legume-based pasture, in moisture-deficient areas where irrigation is becoming a major management tool, such as in Canterbury. These issues include the following:
LUC Classes 1–4 are based on arable rather than pasture suitability.
High levels of variability of pastoral productivity and leakiness exist within some LUC Classes, reflecting the variability associated with Subclass limitations.
LUC Class does not correspond well with potential nitrate-leaching loss rates or denitrification capacity.
There is lack of transparency and difficulty in selecting soil properties for use in the OVERSEER model to fairly represent the average soil properties for an LUC Class.
Productivity under rain-fed conditions does not reflect the differences in soil natural capital under irrigated conditions.
LUC Class 3 and 4 lands and their soils have high importance to the Canterbury economy.
Several adaptations to the LUC-based approach to setting natural-capital-based nitrogen loss limits have been suggested. We also recommend that a more targeted approach to the estimation of natural capital in relation to nitrogen leaching could be more suitable than using the LUC classification, which is based on other objectives. If LUC Classes are used then pastoral productivity under irrigation rather than rain-fed conditions would be more appropriate.
Acknowledgements
We are grateful for the reviews provided by Allan Hewitt and Andrew Fenemor (Landcare Research), Raymond Ford (Environment Canterbury) and three anonymous reviewers.
Disclosure statement
No potential conflict of interest was reported by the authors.
Additional information
Funding
Related Research Data
References
- OVERSEER Management Services Ltd. 2013. OVERSEER® nutrient budgets v6.1: information. Wellington; New Zealand Ministry for Primary Industries (MPI), the Fertiliser Association of New Zealand (FANZ) and AgResearch Limited; [cited 2014 Sept]. Available from: http://www.overseer.org.nz/OVERSEERModel/Information.aspx.
- Barton C. 2012. Statement of planning evidence by Clare Barton on the topic of surface water quality—non-point-source discharges on behalf of Manawatu-Wanganui regional council. Palmerston North; Horizons Regional Council; [cited 2014 Sept 9]. Available from: https://www.horizons.govt.nz/assets/one-plan-publications-and-reports/SWQ-Planning-Evidence-Clare-Barton-20120214.pdf.
- Clothier B, Mackay AD, Carran A, Gray R, Parfitt R, Francis G, Manning M, Duerer M, Green S. 2007. Farm strategies for contaminant management: a report by SLURI, the Sustainable Land Use Research Initiative, for Horizons Regional Council. Palmerston North; AgResearch; [cited 2014 May]. Available from: https://www.horizons.govt.nz/assets/horizons/Images/one_plan/Farm%20Strategies%20for%20Contaminant%20Management%20June%202007.pdf.
- Daigneault A, Samarasinghe O, Lilburne L. 2013. Modelling economic impacts of nutrient allocation policies in Canterbury: Hinds catchment. Ministry for the Environment report. Auckland; Landcare Research; [cited 2014 May]. Available from: http://www.mfe.govt.nz/issues/water/freshwater/supporting-papers/modelling-economic-impacts-of-nutrient-allocation-policies-canterbury.pdf.
- Dominati E, Mackay AS, Green S, Patterson M. 2014. A soil change-based methodology for the quantification and valuation of ecosystem services from agro-ecosystems: A case study of pastoral agriculture in New Zealand. Ecol Econ. 100:119–129. doi: 10.1016/j.ecolecon.2014.02.008
- Environment Canterbury. 2014. Irrigated land area. In: Canterbury water—the regional context. Supporting the Canterbury Water Management Strategy. Christchurch: Environment Canterbury Regional Council; [cited 2016 Jan 22]. Available from: http://ecan.govt.nz/publications/Plans/cw-regional-context-part9.pdf.
- Environmental Protection Authority. 2014. Tukituki catchment proposal board of inquiry final report and decisions. Wellington; Environmental Protection Authority; [cited 2015 March]. Available from: http://www.epa.govt.nz/Resource-management/Tukituki/final-report-decisions/Pages/default.aspx.
- Ford R. 2012. Managing scarce resources: options for allocating catchment nutrient loads. Unpublished working paper prepared for the Canterbury Water Management Strategy Regional Committee, October 2012.
- Hewitt AE. 2010. New Zealand soil classification. Landcare Research Science Series 1. 3rd edition. Lincoln: Manaaki Whenua Press.
- Hewitt A, Dominati E, Webb T, Cuthill T. 2015. Soil natural capital quantification by the stock adequacy method. Geoderma. 241–242:107–114. doi: 10.1016/j.geoderma.2014.11.014
- Horizons Regional Council. 2012. Environment court decisions. Palmerston North: Horizons Regional Council; [cited 2014 Feb]. Available from: http://www.horizons.govt.nz/about-us/one-plan/appeals-to-the-proposed-one-plan-as-amended-by-decisions-august-2010/environment-court-decisions/.
- Horizons Regional Council. 2014. Proposed one plan as amended by environment court decisions. Palmerston North: Horizons Regional Council; [cited 2014 Feb]. Available from: http://www.horizons.govt.nz/about-us/publications/about-us-publications/one-plan/proposed-one-plan/.
- Hunter GG, Lynn IH, Prickett RC. 1980. South Island agricultural production estimates for land use capability units. Report No. WS375. Christchurch: Water and Soil Science Centre, Ministry of Works and Development.
- Kimberley M, West G, Dean M, Knowles L. 2005. The 300 index—a volume productivity index for radiata pine. New Zeal J For. 50(2):13–18.
- Land Resources Group. 1981. Stock carrying capacities and fertiliser data for the North Island. Internal Report No. 22. Palmerston North: Aokautere Science Centre, Ministry of Works.
- Lilburne LR. 2015. South canterbury coastal streams (SCCS) limit setting process. Estimating nitrogen loss under rural land use and informing nitrogen allocation options. Landcare Research Contract Report LC2124. Christchurch: Environment Canterbury Regional Council.
- Lilburne LR, Mackay AD, Mercer G, Lynn IH, Wheeler D. 2013. Applying the ‘natural capital’ approach to nutrient allocation the Selwyn-Waihora Zone in Canterbury. Report for the Ministry of the Environment. Lincoln: Landcare Research.
- Lynn IH, Manderson AK, Page MJ, et al. 2009. Land use capability survey handbook—a New Zealand handbook for the classification of land. 3rd edition. Hamilton: AgResearch; Lincoln: Landcare Research; Lower Hutt: GNS Science.
- Mackay A. 2013a. Section 42A report of Dr Alec Mackay on behalf of Horizons Regional Council. Palmerston North: Horizons Regional Council; [cited 2013 Jun]. Available from: www.horizons.govt.nz/assets/publications/about-us-publications/one-plan-publications-and-reports/officer-reports/the-water-hearing-reports/Dr-Alec-Donald-Mackay.pdf.
- Mackay AD. 2013b. Supplementary evidence of Dr Alex Donald Mackay for the end of hearing report (water) on behalf of Horizons Regional Council. Palmerston North: Horizons Regional Council; [cited 2013 Jul]. Available from: www.horizons.govt.nz/assets/1plan_eoh-report/Dr-Alec-Donald-Mackay-End-of-Hearing-Technical-Report.pdf.
- Mackay AD, Clothier B, Parfitt RL. 2008. Defining nitrogen-loss limits within a water management zone using a natural capital valuation of the soil. In: Currie LD, Yates LJ, editors. Carbon and nutrient management in agriculture. Occasional Report No. 21. Palmerston North: Fertilizer and Lime Research Centre, Massey University; p. 525–530.
- Ministry for the Environment. 2014. National policy statement for freshwater management. Wellington: Ministry of the Environment; [cited 2015 Mar]. Available from: http://www.mfe.govt.nz/publications/fresh-water/national-policy-statement-freshwater-management-2014.
- NWASCO. 1975–79. NZLRI worksheets, 1:63 360. Wellington: National Water and Soil Conservation Organisation.
- NWASCO. 1979. ‘Our land resources’—a bulletin to accompany New Zealand land resource inventory worksheets. Wellington: National Water and Soil Conservation Organisation.
- NWASCA. 1986a. NZLRI worksheets. 2nd edition. 1:63 360. Wellington: National Water and Soil Conservation Authority.
- NWASCA. 1986b. NZLRI worksheets. 2nd edition. 1:50 000. Wellington: National Water and Soil Conservation Authority.
- Prickett RC. 1978. New Zealand land resource inventory South Island land use capability extended legend. Wellington: National Water and Soil Conservation Organisation.
- Roche MM. 1994. Land and water—water and soil conservation and central government in New Zealand, 1941–1988. Wellington: Historical Branch, New Zealand Department of Internal Affairs.
- Rotorua Te Arawa Lakes Programme. 2014. Setting nitrogen discharge allowances. Rotorua: Bay of Plenty Regional Council; Rotorua Lakes Council: Te Arawa Lakes Trust; [cited 2014 Sept 9]. Available from: http://www.rotorualakes.co.nz/setting_NDAs.
- SCRCC. 1974. Land use capability survey handbook: a New Zealand handbook for the classification of land, produced for the soil conservation and rivers control council. Wellington: Water and Soil Division, Ministry of Works.
- Van Berkel P, editor. 1983. The South Island land use capability extended legend for the New Zealand land resource inventory. 2nd edition. Wellington: National Water and Soils Conservation Organisation.
- Webb TH, Lilburne LR. 2011. Addendum to report LC0910/141 & ECan R10/125. Extension of Canterbury mapping of vulnerability of nitrate and phosphorus leaching, microbial bypass flow, and soil runoff potential. Lincoln: Landcare Research; [cited 2016 Jan 15]. Available from: http://ecan.govt.nz/publications/Reports/extension-canterbury-mapping-vulnerability-nitrate-phosphorus.pdf.
- Webb TH, Hewitt AE, Lilburne LR, McLeod M, Close M. 2010. Mapping of vulnerability of nitrate and phosphorus leaching, microbial bypass flow, and soil runoff potential for two areas of Canterbury. Landcare Research Contract Report LC0910/141 and Environment Canterbury R10/125. Christchurch: Environment Canterbury Regional Council.