
ABSTRACT
Wintering cows on forage crops leads to urine being excreted onto wet, compacted soils, which can result in significant emissions of nitrous oxide (N2O). A field trial was conducted to determine the N2O emission factor (EF3; proportion of urine-N lost as N2O-N) for dairy cows wintered on a kale forage crop on a poorly drained soil. Urine was collected from non-lactating dairy cows on a forage kale diet and applied at 550 kg N ha−1 to artificially compacted soil to simulate trampling and non-compacted soil in a kale field. Cumulative N2O losses over four months were 7.38 and 2.64 kg N2O-N ha−1 from urine applied to, respectively, compacted and non-compacted soil. The corresponding EF3 values 0.75% and 0.30%, respectively, differed (P = .003) due to compaction. Combining our results with previous studies, where brassica-fed livestock urine was applied to soils supporting a forage brassica crop, suggested a significant relationship between soil water-filled pore space (WFPS) and brassica-derived urine EF3 (P = .005).
Introduction
Nitrous oxide (N2O) is a potent greenhouse gas with a global warming potential of 298 times that of carbon dioxide over a 100-year time frame (Forster et al. Citation2007). Agriculture represents 49% of New Zealand’s greenhouse gas emissions, with N2O emissions from soils representing 22% of agricultural emissions (Ministry for the Environment Citation2016). Nitrous oxide emissions from soils reported in the national greenhouse gas inventory have increased by 24% over 24 years, equivalent to a rise of 1% per year, from 23.1 kt in 1990 to 28.6 kt N2O in 2014. The main source of N2O emissions in New Zealand is urine deposited onto soils supporting ryegrass/white clover mixed pastures (de Klein et al. Citation2010). However, brassicas and fodder beet are increasingly used as winter forage crops in the South Island of New Zealand (Drewry & Paton Citation2005; Edwards et al. Citation2014) due to cool soil temperatures that limit winter pasture production (Dalley & Van der Poel Citation2008).
The increasing dairy population in Southern New Zealand (Beukes et al. Citation2011) will see increasing environmental issues associated with wintering cows on forage crops. Because of the high yields of winter crops (e.g. 12–22 t DM ha−1 for kale and fodder beet; Edwards et al. Citation2014), crops are break-fed on a daily basis. Under such conditions, stocking density can be very high, reaching up to 1000–1400 cows ha−1, although this is dependent on feed availability (Monaghan et al. Citation2013). During grazing under wet winter conditions, such stocking rates can lead to trampling and soil deformation reducing the volume of macropores (Houlbrooke et al. Citation2009), thereby creating anaerobic conditions at a scale not usually associated with pastoral grazing systems. Under these conditions, urine deposition could lead to relatively high N leaching and N2O production and emissions via denitrification (Monaghan et al. Citation2013; van der Weerden et al. Citation2014). Once forage crops are grazed off, fields can remain bare for two to three months before being resown in the spring. Long periods of fallow mean surplus N remaining in the soil is not utilised by plants, increasing the risk of N losses via gaseous emissions and leaching from deposited excreta.
Winter forage crops such as brassicas and fodder beet typically have relatively low cattle urinary N concentrations, ranging from 1.8 to 5.2 g N L−1 (van der Weerden & Styles Citation2012; Edwards et al. Citation2014; Farrell et al. Citation2016; Hoogendoorn et al. Citation2016) compared to pasture-based cattle urine (Selbie et al. Citation2015). Excess urinary N can be reduced through feeding of forage crops with lower N contents and higher energy-to-protein ratios (de Klein et al. Citation2010). Furthermore, brassicas contain secondary metabolites such as isothiocyanates (ITCs), a breakdown product of glucosinolate, which may have an inhibitory effect on nitrification, leading to lower N2O emissions (Bending & Lincoln Citation2000; Luo et al. Citation2015; Di et al. Citation2016; Gardiner et al. Citation2016). The grazing of brassica and fodder beet crops may, therefore, produce lower N2O emissions due to the resulting urine containing a low N content and/or inhibitory compounds.
Given the potential for forage crops to increase N2O emissions through urine deposition onto wet, compacted soils while also decrease emissions through lower urine N concentrations/inclusion of inhibitory compounds, there is a need to quantify N2O emissions from forage brassica crops. The objective of this field study was to determine N2O emissions and the associated emission factor (EF3; percentage of urine-N lost as N2O-N) for dairy cow urine deposited onto a winter-grazed kale crop in Otago, New Zealand.
Methodology
Soil and site description
The study was conducted on a poorly drained Koau deep silty clay loam soil (Acidic Orthic Gley soil; Hewitt Citation2010) supporting a winter crop of kale (Brassica oleracea L.) in Otago. The paddock was previously in pasture, which was sprayed out with glyphosate and surface tilled, followed by seeding by direct drill in November 2014. Mean annual rainfall was 700 mm, while mean annual air temperature was 9°C. An area of 25 × 15 m was fenced off within the established kale crop in early June 2015 to ensure cattle did not disturb the study site. details key soil chemical and physical properties at the site.
Table 1. Soil chemical and physical characteristics prior to compaction (0–7.5 cm).
Treatments
Treatments included (i) no compaction, (ii) no compaction + urine, (iii) compaction and (iv) compaction + urine. A randomised block design was used, with six replicate plots (1 × 2 m) for each treatment. Compaction and urine treatments were applied on 12 June 2015, with compaction achieved by using stilts strapped on the base of shoes to simulate cow hoofs (van der Weerden & Styles Citation2012). Care was taken to ensure the same level of compaction per area was applied to all ‘compacted’ plots, representing a single hoof print. The applied pressure of the stilts was estimated at approximately 300 kPa, which is similar to a walking adult cow (Di et al. Citation2001). Plots were divided into a soil sampling area (1 × 1 m2) and gas sampling area (1 × 1 m2). Static chamber bases (250 mm internal diameter) were inserted 90 mm into the soil in the gas sampling area.
Dairy cow urine for the gas sampling plots was collected on 8 June 2015 from non-lactating dairy cows grazing a predominantly kale winter forage crop supplemented with oats silage at Lincoln University’s Ashley Dene research farm in Canterbury. Urine was couriered to Otago and refrigerated overnight at 4°C. The total N content of the urine was 5.5 g N L−1: this was applied at a rate of 10 L m−2, resulting in an application rate of 550 kg N ha−1. Due to the challenges associated with collecting large volumes of real cow urine, an artificial urine solution was applied to the soil sampling plots. The composition of this artificial urine solution was based on a pasture diet (Fraser et al. Citation1994) and had the same N concentration as the fresh cow urine. Following treatment application, gas and soil sampling was carried out over a four-month period, until both the N2O emissions and the soil mineral N content of urine-treated plots had returned to background levels (as measured from the control treatment).
N2O emissions and EF3 calculation
Nitrous oxide emissions were measured using a standardised static cover technique (de Klein et al. Citation2014). Measurements were taken twice a week for the first six weeks after treatment application and then once a week, with extra samplings conducted when rainfall exceeded 10 mm in 24 hours. On each sampling day, N2O measurements were carried out once between 10 a.m. and 12 p.m. standard time; a period that allows extrapolation to a daily flux without bias (van der Weerden et al. Citation2013). Headspace gas samples were taken over a cover period of 40 minutes; for the first 13 measurement days, equivalent to c. 6 weeks when fluxes are typically highest, samples were taken at times t0, t20 and t40 minutes, while samples were collected at t0 and t40 minutes for the remainder of the sampling occasions when fluxes are typically low. Gas samples were analysed by gas chromatography at Lincoln University, Canterbury.
The hourly N2O fluxes (mg N m−2 h−1) were calculated from the increase in head space N2O over the sampling time (de Klein et al. Citation2014):(1) where, δN2O is the increase in head space N2O over time (μL L−1); δT is the enclosure period (hours); M is the molar weight of N in N2O (g mol−1); Vm is the molar volume of gas at the sampling temperature measured inside the chamber (L mol−1); V is the headspace volume (m3) and A is the area covered (m2).
These hourly emissions were subjected to a trapezoidal integration, for each chamber, to estimate the total emission over the measurement period. The N2O EF3 (N2O-N emitted as a % of N applied) was then calculated by dividing the treatment-induced emission by the amount of N applied for each treatment (de Klein et al. Citation2014):(2) where EF3 is the urine emission factor (N2O-N emitted as a % of N applied), Urine N2O and Control N2O are the cumulative N2O emissions from the urine and control plots, respectively (kg N ha−1) and Urine N applied is the rate of N applied (kg N ha−1).
Soil parameters
Soil physical measurements (bulk density, macroporosity (MP) (pores >30 µm diameter) and total porosity (TP)) were determined two weeks following the start of the experiment. Soil cores (10 cm diameter × 5 cm height) were collected from two depths (0–5 and 5–10 cm) and placed on tension tables with suction of −1 or −10 kPa after which soil weights were recorded. All cores were then dried at 105°C for 48 hours with weights again recorded. Bulk densities (Mg m−3), soil moisture content at field capacity i.e. −10 kPa (v/v, %), soil MP and TP (m3 m−3, %) were calculated for all treatments.
On each gas sampling day, soil samples (7.5 cm deep, 2.5 cm diameter) were taken from all plots for determination of soil nitrate , ammonium
and water content. During the first six weeks, when soil samples were collected twice a week, soil mineral N determination was limited to once a week. In the laboratory on the following day, the soil samples were thoroughly mixed and 15 g of fresh soil (10 g dry soil equivalent) was extracted for one hour in 100 mL 2 M KCl. The filtered solution was then frozen until being analysed for nitrate N (plus nitrite N), and ammonium N using a modified hydrazine reduction and a salicylate/dichloroisocyanurate method, respectively (Blakemore et al. Citation1987). The remainder of the mixed soil was dried at 105°C for 24 hours, to determine gravimetric soil water content. These gravimetric soil water contents were converted to volumetric water content (ϴV) based on the soil bulk density. In addition, ϴV was continuously monitored using a series of soil moisture probes (Model AOS220A-20, AovicTech, Beijing, China) and a data logger (van der Weerden et al. Citation2013). Logged ϴV data were calibrated against the measured ϴV. Water-filled pore space (WFPS) was calculated by dividing ϴV by total soil porosity. Daily rainfall and soil temperatures (5 cm depth) were logged for the entire measurement period at the experimental site.
Statistical analysis
An analysis of variance (ANOVA) using R (R core team, Citation2015) was performed to determine if the cumulative N2O emission or EF3 data were significantly different due to treatment. Because cumulative N2O emissions were found to be skewed, values were log transformed prior to analysis, with back-transformed data presented. Part of the research site was flooded by heavy rainfall on 13 August, affecting the flux values measured from two of the blocks for the remaining 10 sampling occasions. Because fluxes were low at this point of the experiment, we used the mean flux of the remaining four blocks per treatment to represent N2O losses for the remaining sampling occasions to allow calculation of the cumulative N2O emissions.
Results
Soil and climatic conditions
The compaction treatments significantly increased the soil bulk density in the top 5 cm depth from 0.76 to 0.82 Mg m−3 (; P < .001). TP and MP in the top 5 cm were reduced with the compaction treatments, with TP declining from 0.71 to 0.69 m3 m−3 (P < .001) while MP reduced from 0.31 to 0.22 m3 m−3 (P < .01). As a consequence of these soil physical changes, the soil moisture content at field capacity increased from 49% to 54% v/v with compaction (P < .01). The compaction treatment did not affect soil bulk density, TP and MP in the 5–10 cm depth (P > .05).
Table 2. Physical data for non-compacted and compacted soil (mean ± SEM; n = 6).
Daily mean soil temperature (5 cm depth) ranged from a minimum of 2.1°C to a maximum of 15.2°C, averaging 8.4°C during the entire measurement period ((A)). On two occasions, severe ground frosts caused surface water to freeze for several days (24–26 June and 11–15 July). Rainfall over the 4½ month trial was 215 mm ((A)). Soil WFPS was 65% (equivalent to 95% of field capacity) just prior to the compaction treatments, after which WFPS averaged 64% and 74% in the non-compacted and compacted treatment, respectively, over the first six weeks following compaction and urine application ((A)). Soil WFPS was, on average, 9% higher in the compacted plots compared to the non-compacted plots over the entire experiment.
Figure 1. Soil WFPS (%, 0–7.5 cm), rainfall, mean soil temperature (5 cm) (A), soil ammoniacal-N content (0–7.5 cm) (B), soil nitrate-N content (0–7.5 cm) (C), and hourly N2O fluxes (mg N2O m−2 h−1) (D) from ± urine and ± compaction treatments. Mineral N and flux data points represent mean values ± 1 standard error of the mean.
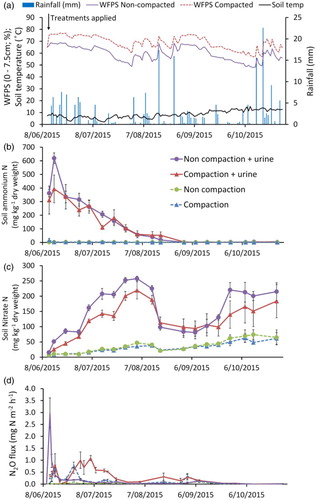
The urine application raised the soil NH4+-N content to 619 mg N kg−1 dry soil in the top 7.5 cm in the non-compacted treatment, while in the compacted treatment NH4+-N content increased to 393 mg N kg−1 dry soil ((B)). After this initial spike, the NH4+-N content gradually declined to background levels over the following three months. Soil content increased in the urine-treated soil over a two-month period, peaking at between 219 and 257 mg N kg−1 dry soil in the top 7.5 cm ((C)). Soon after, on 16 August, a heavy rainfall event (18 mm) occurred after which soil
in the top 7.5 cm was reduced by approximately 50%. The rainfall event probably moved the
down below 7.5 cm measurement depth. During late September and October, we measured a gradual increase in the soil
content in both the control and urine treatments, presumably due to a combination of declining WFPS and gradual increase in soil temperature leading to increased soil mineralisation and nitrification activity; the absence of plants prevented N uptake as a pathway for reducing soil
content. Accordingly, soil mineral N content in the urine-treated soil did not return to background levels by the end of the experiment, when the field was due to be cultivated and resown into pasture, as per standard practice following a winter forage crop.
Nitrous oxide emissions
Hourly N2O fluxes from the control (non-compacted and no urine) treatment remained low (−0.01 to 0.11 mg N2O-N m−2 h−1) throughout the experiment ((D)). The compaction treatment produced two small N2O peaks, reaching 0.66 and 0.80 mg N2O-N m−2 h−1 within ca. two weeks of compaction, after which fluxes remained low at between −0.03 and 0.33 mg N2O-N m−2 h−1. The non-compacted soil, treated with urine, produced a large N2O spike (2.98 mg N2O-N m−2 h−1) immediately following application, after which fluxes declined over the following month and remained at low levels (between 0.00 and 0.13 mg N2O-N m−2 h−1) for the next three months until measurements were completed ((D)). In contrast, the compacted + urine treatment showed a delayed response in N2O production, reaching a maximum of 1.09 mg N2O-N m−2 h−1 four weeks following urine application. Fluxes gradually decreased to background levels by early September, three months following treatments being applied ((D)).
Cumulative emissions and EF3
Cumulative N2O emissions were greater from the compaction + urine treatment (P < .001), at 7.38 kg N2O-N ha−1 compared to compaction with no urine (3.22 kg N2O-N ha−1) (). For the non-compacted treatments, cumulative emissions from added urine were also greater than from no urine (2.64 and 1.00 kg N2O-N ha−1, respectively; P < .001).
Table 3. Cumulative N2O emissions (kg N2O-N ha−1) for non-compacted and compacted soil both with and without urine, and EF3.
The EF3 value for urine deposited onto compacted soil was significantly higher than the value for urine deposited onto non-compacted soil (0.75% and 0.30%, respectively, P = .003; ).
Discussion
Soil compaction reduces the total pore volume, pore continuity and pore size. These changes to the soil pore distribution and network limit soil aeration and drainage through the profile, all of which influence regulation of N transformations and N2O production (Ball et al. Citation2012; Harrison-Kirk et al. Citation2015). This was observed in the compaction treatment where no urine was applied, with conditions becoming more favourable for N2O emissions via denitrification of soil-borne compared to non-compacted soil. Urine deposition onto soils supplies denitrifying bacteria and fungi with a readily available N and carbon (C) source, leading to N2O production which is enhanced when oxygen diffusion is restricted (Bhandral et al. Citation2007; Uchida et al. Citation2008). In our study, compaction increased soil bulk density and reduced both total and MP in the top 5 cm of the soil profile, resulting in a significant increase in cumulative N2O emissions from deposited urine compared to non-compacted soil. The compaction treatment, applied when ϴV was just below field capacity, increased WFPS by 9% compared to non-compacted soil, which may have reduced the rate of
production and subsequent nitrification to
. Under these conditions, any
that is present will be denitrified leading to the enhanced N2O emissions compared to non-compacted soil. Even though the non-compacted soil exhibited a large spike in N2O flux immediately following urine deposition and had a higher soil mineral N content throughout the experiment, the higher porosity and therefore lower WFPS was presumably responsible for the lower N2O production compared to the compacted soil. It should be noted, however, that an artificial urine solution based on a pasture diet was used for the soil sampling plots. Consequently, it did not include any brassica secondary metabolites such as ITCs, which can inhibit nitrification (Gardiner et al. Citation2016). While not measured, it is possible that the kale-derived urine applied to soil plots for gas measurements contained ITCs, which may have inhibited nitrification. This may explain the lack of N2O emissions during the latter part of the experiment when measured soil
content in the soil sampling plots was high, given that soil temperatures were greater than 10○C and soil moisture conditions were suitable for denitrification activity ().
Other workers have also observed increases in N2O production following compaction (Bhandral et al. Citation2007; Ball et al. Citation2012; Harrison-Kirk et al. Citation2015). Bhandral et al. (Citation2007) measured a threefold increase in cumulative N2O emissions from urine deposited onto a compacted soil compared to non-compacted soil, suggesting the increased volume of soil in an anaerobic state led to increased denitrification activity. Ball et al. (Citation2012) measured a threefold increase in N2O emissions from urine-treated pasture following compaction applied using a mechanical hoof and attributed the increase to increased WFPS, aggregate destruction and suppression of grass growth. However, significantly greater N2O emissions from non-compacted soil have been observed, when compared to compacted soil, following urine application to a field supporting a swede crop (van der Weerden and Styles, Citation2012). The lower N2O emissions from the compacted soil were attributed to complete denitrification of to N2, as WFPS was often at saturation (i.e. 100% WFPS), thereby favouring N2 production over N2O production (Harrison-Kirk et al. Citation2015). In the current study, the WFPS in the compacted plots never reached saturation and averaged 74% over the first six weeks. This may have restricted complete denitrification activity, which may explain the higher N2O emissions found in the compacted treatment.
The N2O EF3 for the compacted soil (0.75%) is at the lower end of the range of values for urine deposited onto compacted soils supporting winter forage brassicas (Monaghan et al. Citation2013, Treweek et al. Citation2016; Di et al. Citation2016). Monaghan et al. (Citation2013) conducted a field study in two separate years, where artificial cattle urine solution with an N loading of 399 and 528 kg N ha−1 was applied to a poorly drained compacted Southland soil supporting a kale crop and measured EF3 values of 1.41% and 0.62%, respectively. In a lysimeter study with freely drained, compacted soil, Treweek et al. (Citation2016) measured an EF3 value of 2.1% using dairy urine collected from cows grazing a kale crop that was spiked with urea to N concentration of 7 g N L−1 (N application rate of 700 kg N ha−1). Di et al. (Citation2016) also collected urine from cows grazing kale and adjusted the N concentration to 3 g N L−1 to represent typical N concentrations and loads for cows grazing kale (Edwards et al. Citation2014), recording an EF3 value of 1.10%. In contrast, EF3 values of 3.0 and 3.3% were measured in two trials where swede-fed cattle urine was applied to a poorly drained, compacted and very wet soil supporting a swede crop (van der Weerden & Styles Citation2012).
Soil and climatic conditions can strongly influence N2O emissions and associated emission factors. Previous research has shown that soil water content, influenced by the soil characteristics, rainfall and evapotranspiration, is related to pasture-derived dairy cattle urine EF3 (van der Weerden et al. Citation2014). To examine whether soil water content is a key driver of urine EF3 values for brassica-based diets, we collated soil water content (ϴV and WFPS) and EF3 data from available studies. We only included the three studies where urine was collected from livestock grazing brassicas and applied to soils supporting forage brassica crops: van der Weerden and Styles (Citation2012), Hoogendoorn et al. (Citation2016) and the current study. Other studies were excluded as they either used artificial urine using a recipe based on pasture-fed cattle (Monaghan et al. Citation2013), applied rape-fed cattle urine to pasture (Luo et al. Citation2015) or did not include soil water content data (Treweek et al. Citation2016; Di et al. Citation2016). Because van der Weerden et al. (Citation2014) calculated the average soil water content over 30 days following urine deposition, we used the same duration for this data analysis. Where required, data was sourced directly from the author. We included both sheep and cattle urine data and also accepted data where compaction was or was not imposed on the basis that compaction will reduce soil porosity and therefore increase ϴV and WFPS. This limited the data to seven values, but was sufficient to illustrate that the natural log of urine EF3 appears to be significantly related to WFPS (; R2 = 0.83; n = 7; P = .005).
Figure 2. Relationship between ln (EF3, %) and soil WFPS (%), averaged over the first 30 days following urine application (R2 = 0.83; n = 7; P = .005). Solid line represents line of best fit; data sourced from van der Weerden and Styles (Citation2012) (□); Hoogendoorn et al. (Citation2016) (○) and the current study (▪). Dashed line represents line of best fit for soil WFPS-pasture dairy cattle urine ln (EF3) relationship, reported by van der Weerden et al. (Citation2014), with associated shaded area representing ± 50% confidence interval.
The relationship appears to be strongly influenced by a single data point, where WFPS = 34%. Therefore, we assessed the impact of this single point by re-analysing the dataset with this value omitted and found that the slope and intercept did not change markedly (slope reduced from 0.055 to 0.054, and Y-intercept reduced from 4.14 to 4.00). However, R2 was reduced from 0.83 to 0.61, while the P value was reduced from .005 to .067 (n = 6), i.e. marginally significant. Furthermore, considering complete denitrification occurs at 100% WFPS, one may expect the relationship between WFPS and ln (EF3) to be non-linear between c. 60% and 100% WFPS. The current number of data points restricts any clear indication of a curvilinear relationship.
We also tested ϴV as a soil metric, and, using the full dataset, found a weaker relationship compared to WFPS (R2 = 0.66; n = 7; P = .03), thus, on an empirical basis, supporting the use of WFPS as a proxy for soil aeration status (Linn & Doran Citation1984; van der Weerden et al. Citation2014). Also shown in is the original mean relationship (±50% confidence interval) between soil WFPS and ln (EF3), determined from 43 New Zealand values measured from pasture (ryegrass/white clover mixed swards) derived dairy cattle urine deposited onto pastoral soils (van der Weerden et al. Citation2014). While the pasture-based relationship is limited to a WFPS range of 30–90% and the brassica urine dataset is limited to seven values coming from a total of three studies, our results suggest that N2O emissions from both brassica-derived and pasture-derived urine respond similarly to WFPS. WFPS is a proxy for soil aeration status (van der Weerden et al. Citation2014) and a function of soil texture, rainfall, evaporation and soil density. Soil aeration status will regulate nitrification and denitrification activity, directly influencing N2O production and emission. As noted earlier, our field data suggest an inconsistency between soil mineral N status and N2O emissions, which may be due to the presence of ITCs in the kale-derived urine inhibiting nitrification. However, our analysis of trial data from several studies would suggest that WFPS, and, by proxy, soil aeration status, may have a greater influence than plant species (ryegrass/white clover mixed sward vs. forage brassicas) on urine EF3.
Conclusion
Cumulative N2O emissions from kale-fed non-lactating dairy cattle urine applied to compacted and non-compacted soil were 7.38 kg and 2.64 kg N2O-N ha−1, respectively. The corresponding EF3 values were 0.75% and 0.30%. We observed a significant relationship between WFPS and brassica-derived urine EF3 (P = .005) when our data were combined with other New Zealand studies on brassica-fed livestock urine. This was very similar to a previously determined relationship for WFPS and pasture-derived urine EF3, suggesting plant species (ryegrass/white clover mixed sward vs. forage brassicas) may have a minor effect on urine EF3. We recommend further research to compare winter grazing of forage crops and standard pastures, where the effects of compaction are included, to provide robust data for identifying winter forage options with low N2O emission footprints.
Acknowledgements
We would like to thank Tom Orchiston, Wayne Worth and Jen Robson for assisting with field and laboratory work, Alasdair Noble for conducting the statistical analyses and Jiafa Luo for supplying data from earlier field studies. Seth Laurenson and Jiafa Luo provided comments on an earlier version of this manuscript.
Disclosure statement
No potential conflict of interest was reported by the authors.
Additional information
Funding
References
- Ball BC, Cameron KC, Di HJ, Moore S. 2012. Effects of trampling of a wet dairy pasture soil on soil porosity and on mitigation of nitrous oxide emissions by a nitrification inhibitor, dicyandiamide. Soil Use Management. 28:194–201. doi: 10.1111/j.1475-2743.2012.00389.x
- Bending GD, Lincoln SD. 2000. Inhibition of soil nitrifying bacteria communities and their activities by glucosinolate hydrolysis products. Soil Biol Biochem. 32:1261–1269. doi: 10.1016/S0038-0717(00)00043-2
- Beukes PC, Gregorini P, Romera AJ, Dalley DE. 2011. The profitability and risk of dairy cow wintering strategies in the Southland region of New Zealand. Agr Systems. 104:541–550. doi: 10.1016/j.agsy.2011.04.003
- Bhandral R, Saggar S, Bolan NS, Hedley MJ. 2007. Transformation of nitrogen and nitrous oxide emission from grassland soils as affected by compaction. Soil Tillage Res. 94:482–492. doi: 10.1016/j.still.2006.10.006
- Blakemore LC, Searle PL, Daly BK. 1987. Methods for chemical analysis of soils. New Zealand Soil Bureau Scientific Report No. 80. Lower Hutt, New Zealand, Department of Scientific and Industrial Research. p. 103.
- Dalley DE, Van der Poel G. 2008. Southland monitor farm project. Proceedings of the South Island Dairy Event. Lincoln, New Zealand, p. 92–104. Available from: http://side.org.nz/wp-content/uploads/2014/05/Southland-Monitor-Farms1.pdf
- Di HJ, Cameron KC, Milne J, Drewry JJ, Smith NP, Hendry T, Moore S, Reijnen B. 2001. A mechanical hoof for simulating animal treading under controlled conditions. New Zeal J Agr Res. 44:111–116. doi: 10.1080/00288233.2001.9513465
- Di HJ, Cameron KC, Podolyan A, Edwards GR, de Klein CAM, Dynes R, Woods R. 2016. The potential of using alternative pastures, forage crops and gibberellic acid to mitigate nitrous oxide emissions. J Soils Sediments. doi:10.1007/s11368-016-1442-1
- Drewry JJ, Paton RJ. 2005. Soil physical quality under cattle grazing of a winter-fed brassica crop. Aust J Soil Res. 43:525–531. doi: 10.1071/SR04122
- Edwards GR, de Ruiter JM, Dalley DE, Pinxterhuis JB, Cameron KC, Bryant RH, Di HJ, Malcolm BJ, Chapman DF. 2014. Urinary nitrogen concentration of cows grazing fodder beet, kale and kale-oat forage systems in winter. Australian Dairy Science Symposium, Waikato, New Zealand, Nov 19-21 (2014): 144-147.
- Farrell LJ, Bryant RH, Hague H, Edwards G. 2016. Urine volume of non-lactating dairy cows in late gestation fed forage based diets in winter. Proceedings of the New Zealand Society of Animal Production. 76:22–25.
- Forster P, Ramaswamy V, Artaxo P, Berntsen T, Betts R, Fahey DW, Haywood J, Lean J, Lowe DC, Myhre G, Nganga J, Prinn R, Raga G, Schulz M, Van Dorland R. 2007. Changes in atmospheric constituents and in radiative forcing. In:Solomon S., et al., editors. Climate change 2007: the physical science basis. Contribution of Working Group I to the Fourth Assessment Report of the Intergovernmental Panel on Climate Change. Cambridge: Cambridge University Press, and New York, NY; p. 996.
- Fraser PM, Cameron KC, Sherlock RR. 1994. Lysimeter study of the fate of nitrogen in animal urine returns to irrigated pasture. Eur J Soil Sci. 45:439–447. doi: 10.1111/j.1365-2389.1994.tb00529.x
- Gardiner CA, Clough TJ, Cameron KC, Di HJ, Edwards GR, de Klein CAM. 2016. Potential for forage diet manipulation in New Zealand pasture ecosystems to mitigate ruminant urine derived N2O emissions: a review. New Zeal J Agr Res. doi:10.1080/00288233.2016.1190386
- Harrison-Kirk T, Thomas SM, Clough TJ, Beare MH, van der Weerden TJ, Meenken ED. 2015. Compaction influences N2O and N2 emissions from 15N-labeled synthetic urine in wet soils during successive saturation/drainage cycles. Soil Biol Biochem. 88:178–188. doi: 10.1016/j.soilbio.2015.05.022
- Hewitt AE. 2010. New Zealand soil classification. 3rd ed. Landcare Research Science Series No. 1. Lincoln: Manaaki Whenua Press.
- Hoogendoorn CJ, Betteridge K, Ledgard SF, Costall DA, Park ZA, Theobald PW. 2011. Nitrogen leaching from sheep-, cattle- and deer-grazed pastures in the Lake Taupo catchment in New Zealand. Animal Production Science. 51:416–425. doi: 10.1071/AN10179
- Hoogendoorn CJ, Luo J, Lloyd-West CM, Devantier BP, Lindsey SB, Sun S, Pacheco D, Li Y, Theobald PW, Judge A. 2016. Nitrous oxide emission factors for urine from sheep and cattle fed forage rape (Brassica napus L.) or perennial ryegrass/White clover pasture (Lolium perenne L./Trifolium repens). Agric Ecosys Environ. 227:11–23. doi: 10.1016/j.agee.2016.04.029
- Houlbrooke DJ, Paton RJ, Morton JD, Littlejohn RP. 2009. Soil quality and plant yield under dryland and irrigated winter forage crops grazed by sheep or cattle. Aust J Soil Res. 47:470–477. doi: 10.1071/SR08228
- de Klein C, Eckard R, van der Weerden T. 2010. Nitrous oxide emissions from the nitrogen cycle in livestock agriculture: estimation and mitigation. In: Smith KA, editor. Nitrous oxide and climate change. London: Earthscan; p. 107–142.
- de Klein CAM, Luo J, Woodward KB, Styles T, Wise B, Lindsey S, Cox N. 2014. The effect of nitrogen concentration in synthetic cattle urine on nitrous oxide emissions. Agric Ecosyst Environ. 188:85–92. doi: 10.1016/j.agee.2014.02.020
- Linn DM, Doran JW. 1984. Effect of water-filled pore space on carbon dioxide and nitrous oxide production in tilled and nontilled soils. Soil Sci Soc Am J. 48:1267–1272. doi: 10.2136/sssaj1984.03615995004800060013x
- Luo J, Sun XZ, Pacheco D, Ledgard SF, Lindsey SB, Hoogendoorn CJ, Wise B, Watkins NL. 2015. Nitrous oxide emission factors for urine and dung from sheep fed either fresh forage rape (Brassica napus L.) or fresh perennial ryegrass (Lolium perenne L.). Animal. 9:534–543. doi: 10.1017/S1751731114002742
- Ministry for the Environment. 2016. New Zealand’s greenhouse gas inventory 1990-2014. Ministry for the Environment. ISSN 1179-223X. Publication number ME 1239. p. 519.
- Monaghan RM, Smith LC, de Klein CAM. 2013. The effectiveness of the nitrification inhibitor dicyandiamide (DCD) in reducing nitrate leaching and nitrous oxide emissions from a grazed winter forage crop in southern New Zealand. Agric Ecosys Environ. 175:29–38. doi: 10.1016/j.agee.2013.04.019
- R Core Team. 2015. R: A language and environment for statistical computing. Vienna: R Foundation for Statistical Computing. Available from: https://www.R-project.org/
- Selbie DR, Buckthought LE, Shepherd MA. 2015. The challenge of the urine patch for managing nitrogen in grazed pasture systems. In: Donald LS ed. Adv Agron. 129:229–292. doi: 10.1016/bs.agron.2014.09.004
- Treweek G, Di HJ, Cameron KC, Podolyan A. 2016. Effectiveness of the nitrification inhibitor dicyandiamide and biochar to reduce nitrous oxide emissions. New Zeal J Agr Res. 59:165–173. doi: 10.1080/00288233.2016.1161651
- Uchida Y, Clough TJ, Kelliher FM, Sherlock RR. 2008. Effects of aggregate size, soil compaction, and bovine urine on N2O emissions from a pasture soil. Soil Biol Biochem. 40:924–931. doi: 10.1016/j.soilbio.2007.11.007
- van der Weerden TJ, Clough TJ, Styles TM. 2013. Using near-continuous measurements of N2O emission from urine-affected soil to guide manual gas sampling. New Zeal J Agr Res. 56:60–76. doi: 10.1080/00288233.2012.747548
- van der Weerden TJ, Manderson A, Kelliher FM, de Klein CAM. 2014. Spatial and temporal nitrous oxide emissions from dairy cattle urine deposited onto grazed pastures across New Zealand based on soil water balance modelling. Agr Ecosys Environ. 189:92–100. doi: 10.1016/j.agee.2014.03.018
- van der Weerden TJ, Styles TM. 2012. Reducing nitrous oxide emissions from grazed winter forage crops. Proc New Zeal Grassland Assoc. 74:57–62.