
ABSTRACT
Soil organic matter is a potential sink of atmospheric carbon (C) and critical for maintaining soil quality. We reviewed New Zealand studies of soil C changes after conversion from woody vegetation to pasture, and under long-term pasture. Soil C increased by about 13.7 t C ha−1 to a new steady state when forests were initially converted to pasture. In the last 3–4 decades, resampling of soil profiles demonstrated that under long-term pasture on flat land, soil C had subsequently declined for allophanic, gley and organic soils by 0.54, 0.32 and 2.9 t C ha−1 y−1, respectively, and soil C had not changed in the remainder of sampled soil orders. For the same time period, pasture soils on stable midslopes of hill country gained 0.6 t C ha−1 y−1. Whether these changes are ongoing is not known, except for the organic soils where losses will continue so long as they are drained. Phosphorus fertiliser application did not change C stocks. Irrigation decreased carbon by 7 t C ha−1. Carbon losses during pasture renewal ranged between 0.8 and 4.1 t C ha−1. Some evidence suggests tussock grasslands can gain C when fertilised and not overgrazed. When combined to the national scale, different data sets suggest either no change or a gain of C, but with large uncertainties. We highlight key land-use practices and soil orders that require further information of soil C stock changes and advocate for a better understanding of underpinning reasons for changes in soil C.
Introduction
Globally, there is considerably more C in the soil than in terrestrial vegetation and the atmosphere combined, and maintaining or increasing soil C is viewed as important for climate stability (Janzen Citation2004; Lal Citation2004). About 12% of anthropogenic CO2 that has entered the atmosphere can be attributed to land-use change (Houghton et al. Citation2012). Indeed, increasing soil C is a proposed mechanism for re-capturing CO2 emitted from burning fossil fuels (Smith et al. Citation2013). Increasing soil C provides additional benefits to soils such as improving structure and nutrient- and water-storage capacities (Sparling et al. Citation2006), which may lead to greater plant productivity (Lal Citation2004).
To a large degree, the opportunity to increase soil C depends on land use and management. There have been meta-analyses and statistical analyses demonstrating the magnitude of soil C stock changes due to land-use change, both internationally (e.g. Murty et al. Citation2002; Poeplau et al. Citation2011; Kim & Kirschbaum Citation2015) and within New Zealand (Tate et al. Citation2005; McNeill et al. Citation2014). These broad-scale assessments are useful and informative, though they may hide more subtle changes in C stocks that occur in response to changes in management within a land-use category, such as through changes in fertiliser application rates, stocking rate, the frequency of soil cultivation or the introduction of irrigation. These management practices generally aim to increase food and fibre production per unit area, part of a worldwide trend towards land-use intensification that is also evident in New Zealand (MacLeod & Moller Citation2006).
In New Zealand, the predominant land use is grazed pasture. In 2012, there were about 5.8 Mha (million hectares) of high-producing grassland (22% of New Zealand’s total land area), 7.5 Mha of low-producing grassland (28%) and 1.4 Mha of grassland with woody biomass (5%) (MfE Citation2014). Following conversion from native vegetation to grasslands for grazing, pasture production increased over time due to a number of management strategies such as application of fertiliser and lime along with the optimisation of grazing regimes. Photosynthetically fixed carbon is incorporated into the soil following plant (especially root) senescence, or dung deposition and is lost through respiration, leaching and export of animal produce. The net balance of these inputs and outputs dictates whether soil C stocks increase, decrease or remain the same over time (Kirschbaum et al. Citation2015, Citation2017). Such change is not readily predicted from first principles (e.g. Parsons et al. Citation2013).
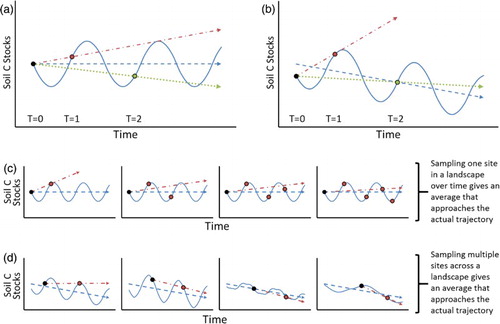
There are a number of different methodological approaches that have been used to design sampling regimes and measure C stock changes, and these have been extensively reviewed (Richter et al. Citation2007; De Gruiter et al. Citation2010; Minasny et al. Citation2013; Olson et al. Citation2014). A key consideration when measuring changes in soil C stocks is the degree of inference that can be obtained when sampling individual sites in comparison to broad-scale assessments of soil C changes (Davies & Gray Citation2015). Soil C stock at any one site is likely to vary to some degree on a year-to-year basis depending on climatic effects (e.g. losses due to drought) and management decisions. Therefore, if only two samples are taken, where sampling points fall within the year-to-year variability, this is likely to affect the conclusion drawn about the trajectory of C stock change ((a) and 1(b)). Additionally, when only two samples are taken through time, a linear rate of change between samplings is assumed whereas this may not be the case. It is possible that between samplings, a change in soil C can occur rapidly to a new steady state (e.g. Thornley & Cannell Citation1997) and the assumption of linearity would result in an under-estimation of rates of change prior to steady state being reached. Sampling a specific site within a landscape on multiple occasions over a period of time allows insight into the high-level causes for changes ((c)) but it will not be known if treatment effects apply only to the sampled site or more broadly. Conversely, sampling multiple sites within a studied landscape over a range of time intervals can reduce some site-specific variability ((d)) to allow detection of long-term directions in change, but this approach often limits the ability to determine the causes for changes in stocks. Alternatively, if individual sites are sampled multiple times under different well-controlled treatments it might allow insight to high-level reasons for changes.
Figure 1. Hypothetical trends in soil C (solid lines) for systems that are oscillating over the short term but are at steady state (a, c), or losing carbon (b, d), over the long term. Blue dashed lines with arrows indicate actual or inferred trends in soil C stocks, the latter based on measurement points indicated by circles. (a) Relying on only a pair of measurements (e.g. T = 0 and T = 1, or T = 0 and T = 2) will readily produce overestimates (red dash-dot line) or underestimates (green dotted line) of soil C stocks. (b) Furthermore, it is impossible for an estimate of trajectory to be accurate from a single pair of measurements unless both T = 0 and the subsequent measure fall on the actual mean trajectory. (c) Sampling the same site multiple times can improve the accuracy of estimated soil C stock trajectories (dash-dot line) over time. (d) Taking paired measurements at several sites across a landscape can also produce multiple estimated soil C stock trajectories (dash-dot line) that average over the studied landscape to the real change. If the multiple paired sites are sampled at different times it will reduce the chances that trends are due to short-term climate/weather driven events that affect all sampling points in the landscape.
In this review, we focus on the influence of land use and management on soil carbon in New Zealand’s grazed pasture systems. We conducted a comprehensive literature review and synthesised values as reported in the various studies, assuming the authors used the best approach for their situation. Throughout, we use units for soil C stock changes of t C ha−1 y−1 to a specified depth, as sampling depth varies greatly between studies. We recognise that data from shallow sampling can be misleading of changes in full profiles particularly when potential differences in sampled soil mass are not considered (Olson et al. Citation2014). Moreover, estimating deep stocks from shallow samples introduces considerable uncertainty (Kelliher et al. Citation2013). Nevertheless, in cases where there is little or no deep sampling, data from shallow sampling can still provide some insight into possible C trajectories. First, we examine the effect of land-cover and land-use conversions from native or exotic forests to pastures on measured trajectories and rates of change of soil C stocks. We then focus the evidence for management effects on soil C beneath grazed pasture. Hill country and flat land (<15°) are treated separately because observations suggest divergent trends. We conclude this review with a preliminary estimate of national-scale changes in soil C stocks for the area of land under grazed pastures for New Zealand, based on the data gathered to date.
Soil carbon trajectories associated with land-use change to and from pasture
National-scale modelling of land-use change effect on soil C
Prior to arrival of humans and introduction of increasingly intensive agricultural techniques, New Zealand was originally largely covered by forests. Since then there has been large areas that have undergone land-use change (e.g. forest clearance to pasture). To assess changes in steady-state stocks in soil C in response to these land-use changes, McNeill et al. (Citation2014) refined a statistically based modelling approach for New Zealand (). This is the latest version of the original model that Tate et al. (Citation2005) developed for the soil carbon monitoring system (CMS). The soil CMS has been progressively improved through successive iterations, including methodological advances and augmenting the underlying soils data set. The land-use effect (LUE) coefficients generated by the soil CMS model provide estimates of soil C stocks for different land-use categories, taking account of other factors, such as climate and soil type. Resultant C stocks are compared with that of low-producing grassland, which serves as the reference case (i.e. the model intercept). This approach allows calculation of the effect of land-use change on national soil C stocks, which is used for New Zealand’s National Greenhouse Gas Inventory Report (e.g. MfE Citation2015). The most current soil CMS LUE coefficients for use in the national greenhouse gas inventory (or any other national-scale estimates) are found in McNeill and Barringer (Citation2014), which updated the soil CMS model (McNeill et al. Citation2014) with a new soil C data set collected in 2014 from post-1989 planted forests.
Table 1. Soil C change attributable to land-use change: LUE relative to low-producing grassland (t C ha−1), the model intercept, based on McNeill and Barringer (Citation2014), updated from McNeill et al. (Citation2014).
The model of McNeill et al. (Citation2014) is an important national-scale approach for estimating steady-state stocks of soil C that allows calculation of changes in stocks associated with land-use change. However, this model does not include any effects of different management practices within pastures on absolute changes or rates of change.
Deforestation of native forest for pasture development
Before the arrival of humans, the New Zealand landscape was dominated by forests (85% of land area) and tussock grassland (MacLeod & Moller Citation2006). This landscape was first transformed upon the arrival of Māori with widespread clearance through burning. Europeans followed in the nineteenth century with pasture establishment (i.e. clearing vegetation and sowing seeds). In the early 1900s, production was initially enhanced by addition of phosphorus fertiliser and lime, which promoted nitrogen fixation by clover. In the 1980s, pasture production has been further accelerated by inputs of nitrogen fertilisers in parts of the landscape. Throughout, improvements to grazing strategies and other on-farm management practices have also increased productivity.
Jackman (Citation1964) sampled North Island soils (0–0.3 m) from several chronosequences where poorly developed grasslands or native forest were converted to higher producing grasslands. These chronosequences included conversion to high-producing pastures from (i) native forest (one chronosequence), (ii) pasture that had reverted back to gorse/mānuka/blackberry (three chronosequences), (iii) from poorly developed pasture (five chronosequences) and (iv) one site of well-developed pasture. Data provided in appendices by Jackman (Citation1964) were reanalysed by Schipper and Sparling (Citation2011) to determine rates of soil C change. On average, for the chronosequences, the mean rates of C accumulation were large for the first 5 years, followed by much lower rates over the next 20 years, with only small changes thereafter (). In this data set, observed changes were almost completely attributable to changes in the top 0.075 m, so that stock changes for the top layer were nearly identical to changes for the top 0.30 m.
Figure 2. Mean rate (±95% confidence interval) of soil C accumulation (top 0.075 and 0.030 m) for 10 different chronosequences where forest/scrub was converted to pasture (Jackman Citation1964; Schipper & Sparling Citation2011).
An earlier soil sampling (to 0.20 m) of a pasture development chronosequence near Taupo was conducted by Walker et al. (Citation1959), but full interpretation of these data is limited because there were also very large increases in bulk density after the soil had been under pasture for 25 years. This meant that vastly different masses of soil were sampled along the chronosequence. They estimated an increase of about 0.125 t C ha−1 y−1 or 3.1 t C ha−1 after 25 years, but when changes in bulk density were accounted for using the equivalent soil mass (EQM) approach (Ellert & Bettany Citation1995), there was actually a loss of about 11.6 t C ha−1 or 0.46 t C ha−1 y−1. It is unclear whether plant litter was included in the original forest sampling.
Conversion between plantation forest and pasture
While the clearance of native vegetation has markedly decreased in recent decades, there have been large areas of commercial forest (mainly Radiata pine) that have recently been converted to pastures, particularly in the Central North Island and the Canterbury Plains (MfE Citation2015). Paired site and chronosequence studies have attempted to determine rates of soil C change following conversion of plantation forests to high-producing pastures. Sparling et al. (Citation2014) sampled soils (0–0.60 m) from three pine-to-pasture chronosequences in the Central North Island and reported an average accumulation rate of 1.67 t C ha−1 y−1 in the first 10 years and 0.27 t C ha−1 y−1 from years 10 to 50. These latter rates of accumulation were more uncertain because the age of the long-term pastures sites was not always well known and there were few sites with ages between 11 and 40 years under pasture. Hedley et al. (Citation2009) sampled two paired sites from the same area, and estimated much higher soil C sequestration rates of 6.1 t C ha−1 y−1 (0–0.15 m) over the first 5 years. In this latter study, rapid C accumulation was attributed to capital dressings of fertiliser, latest ryegrass–clover seed cultivar mixes and consequent rapid incorporation of fine pasture roots into the previously forested soils.
Pasture has also been planted back into exotic forests (afforestation) in New Zealand. Parfitt and Ross (Citation2011) tracked changes in soil C stocks (0–0.10 m) for 9 years after planting pines in pasture and measured a decline of about 6 t C ha−1. Decreases in soil C stocks following afforestation of pastures were also observed in two other paired site samplings. Hewitt et al. (Citation2012) combined data on soil C stocks (0–0.30 m) from 30 adjacent pine/pasture sites from around New Zealand where pine forests had been established more than 20 years prior. They found that, on average, forest had −17.4 t C ha−1 (95% CI −24.6 to −10.1) less C than pasture soils. The Hewitt et al. (Citation2012) study did not include a temporal component, but assumed that both pine and pasture sites were at steady state. Similarly, Davis and Condron (Citation2002) collated data from 28 paired study sites of pine planted into pasture around New Zealand and reported a decline in soil C stocks of 4.5 t C ha−1 in the top 0.10 m of afforested stands. Considering the shallower sampling used by Davis and Condron (Citation2002), these changes are in broad agreement with the modelled land-use change difference between commercial forest (pre-1990) and low-producing pastures of 15.4 t C ha−1 (). The observed decreases in soil C associated with afforestation supports the observed increases in soil C following conversion of forest to pasture.
Soil C trajectories in long-term grasslands
Pastures on flat land
A series of studies documented temporal changes in soil C stocks under long-term pastures by re-sampling sites that had been sampled c. 30 years previously (Schipper et al. Citation2007, Citation2010, Citation2014). These sites were originally sampled as part of the soil survey of New Zealand, with a specific focus on selecting and describing a modal soil profile for soil classification purposes, and obtaining data on soil properties for the National Soils Database (NSD). Bulk density had been measured and soil samples were archived. Careful recording of sample locations gave a high degree of certainty in relocating the sites.
As additional sites were sampled, interpretation of results became increasingly refined. The initial sampling of 31 sites by Schipper et al. (Citation2007), located mainly on dairy farms, identified large losses of soil C in the preceding c. 30 years under ongoing grazing. The second tranche of sampling expanded the data set to 56 flat-land sites and found significant losses of soil C under dairy but not under drystock (mainly sheep/beef) farms (Schipper et al. Citation2010). Finally, Schipper et al. (Citation2014) increased the number of flat-land sites to 125. On average across all 125 sites, there was still a significant loss of C between samplings (4.8 t C ha−1, P < .05, or 0.2 t C ha−1 y−1, P < .01 for the top 0.30 m), but the increased number of sites allowed partitioning of changes into soil order and LUEs (). This revealed that significant C losses were observed only in allophanic and gley soils, and the stock-type categories of dairy and drystock were no longer significant predictors of soil C change within this data set (). Parfitt et al. (Citation2014) conducted a third sampling of some of these soil profiles after a further 5 years, and were unable to identify any significant further decrease in soil C stocks. The short time interval between second and third samplings and the low number of sites sampled (eight allophanic soils under dairy) likely meant that it would have been difficult to detect any significant changes.
Table 2. Mean change and rate of change in soil C (0–0.30 m) between samplings of pasture soils on flat land with 95% confidence intervals (including a Bonferroni adjustment to account for multiple comparisons).
While the Schipper et al. (Citation2014) study seemingly contradicted conclusions from the earlier work, it became apparent that in the earlier studies, more dairy farms than drystock farms had been sampled on allophanic soils. Consequently, the losses initially attributed to dairy farming were in fact due to a disproportionate sampling of dairy farms on allophanic soils. This set of studies has allowed a refinement of the area of soils vulnerable to C loss to gley and allophanic soils, a relatively small area of New Zealand’s grasslands. Soil C appeared to be at steady state during the measurement period for the other soil orders, although the high variability may mask small gradual changes. Soil C losses from gley soils could be due to increased artificial drainage in recent decades: when previously poorly drained or waterlogged parts of the profile become oxidised, which increases decomposition rates of soil organic matter in the profile. Similar conclusions were drawn for drained soils in Belgium where soil C losses under agriculture were also observed (Meersmans et al. Citation2009). In contrast, the reason(s) for C loss in allophanic soils is less clear. The apparent preferential loss of carbon from allophanic soils could be related to the fact that these soils contain a larger fraction of small organic molecules of microbial origin than other soil orders. These small, reworked organic molecules are possibly more susceptible to decomposition under intensive land use than are predominant forms of carbon in other soil orders (Wang et al. Citation2016).
A second large data set of soil C change from re-sampled soils was published by Parfitt et al. (Citation2014). This study drew together soil quality data collected by Regional Councils as part of the ‘500 Soils’ programme to a depth of 0.10 m (Sparling & Schipper Citation2004). While the samples had not been collected originally for quantifying changes in soil C, they nonetheless presented a large number of observations. On average over c. 7 years, Parfitt et al. (Citation2014) reported differences in total soil C stocks between drystock and dairy on flat land. On average, soils under drystock had gained 0.57 t C ha−1 y−1 (n = 54), and soils under dairying had gained 0.32 t C ha−1 y−1 (n = 85), but neither of these observations were significant at P < .05. We obtained the original data from Parfitt (personal communication) and combined them across both dairy and drystock to test whether there was an overall soil C change on flat land. The combined data set contained a total of 139 sites and showed an average increase of 0.42 t C ha−1 y−1 (95% CI of 0.09 to 0.75 t C ha−1 y−1, P = .012), over an average period of 7 years between 2000 and 2007.
This average increase across sites contrasts with the no change/decrease observed by Schipper et al. (Citation2014). However, these studies covered different time periods. Further, Parfitt et al. (Citation2014) reported no significant C change for allophanic soils, while Schipper et al. (Citation2014) reported significant losses of C in this soil order. The Parfitt et al. (Citation2014) data could therefore indicate that the decrease in soil C (over c. 30 years between 1980 and 2010) for allophanic and gley soils, identified by Schipper et al. (Citation2014) may have halted, or even been reversed during the more recent 7 years (2003–2009). However, there are important aspects of the 500 soils sampling approach that should be noted. The sampling depth of the 500 soil project was shallow (0–0.10 m), and Parfitt et al. (Citation2014) reported that there were changes in bulk density between samplings for many of the sites. To account for changes in bulk density, C stocks were estimated on an EQM basis. While expressing soil C stocks on an EQM basis is regarded as the best approach (Wendt & Hauser Citation2013), the method is generally not designed for a single sampling depth. Further, old and newly resampled soils from the ‘500 Soils’ data set were not analysed at the same time through the same instruments, leaving the potential for systematic bias between sampling periods. This potential issue could be easily checked in future because all soils have been archived (Kelliher et al. Citation2013). The reasons for changes in soil C stocks reported by both Schipper et al. (Citation2014) and Parfitt et al. (Citation2014) are not known.
Pastures on undisturbed hill country
Soil processes in hill country can be more complex than in flat land due to a variety of erosional processes that are often greater on steeper slopes in soft rock hill country. There have been a few site-specific studies on the effect of mass movement erosion on soil C stocks, particularly recovery of erosion scars (Sparling et al. Citation2003; Page et al. Citation2004; Rosser & Ross Citation2011; De Rose Citation2013), and studies have tried to quantify the effect of erosion on the national carbon budget (Scott et al. Citation2006; Dymond Citation2010). We focus on studies that have reported changes in soil C from sampling in areas of hill country that had been considered to have been unaffected by mass movement erosion. This separation is somewhat arbitrary as identifying previous erosion scars/slips is not always simple.
Two broad-scale sampling studies have indicated that soil C increased in parts of hill country pastures. Schipper et al. (Citation2014) re-sampled 23 pasture sites on stable mid-slopes of hill country and showed that, on average, sites (0–0.30 m) had gained 13.5 t C ha−1 (SE = 4.5) between samplings in c. 1978 and 2008 corresponding to approximately 0.6 t C ha−1 y−1 (SE = 0.16), assuming a linear change between samplings (). There were insufficient sampling sites to allow separation of soil order effects. Parfitt et al. (Citation2014) also resampled pastoral soils on hill country as part of the ‘500 Soils’ programme (top 0.10 m) and reported increases of 1.33 t C ha−1 y−1 (SE = 0.52, n = 19) over a 5-year period (). Using measurements of the radionuclide 137Cs (from atmospheric nuclear tests) as a tracer at the Schipper sample sites, Parfitt et al. (Citation2013) attributed some of the C gains to recovery of topsoil after widespread sheet erosion when forests were first cleared, as well as to C accumulation resulting from increased land fertility through clover nitrogen fixation.
Table 3. Summary of soil C stocks and stock changes in New Zealand hill country pastoral soils.
Hill country is known to be highly heterogeneous (e.g. Rosser & Ross Citation2011) and the representativeness of the Schipper and Parfitt data sets is not well known. A preliminary estimate suggested that the sites sampled represented about 30% of hillslope positions for all of New Zealand’s hill country regions based on hill slope position, landform, soil type and hill country rock type (C.B. Hedley, personal communication). It is likely that any rates of change in soil C stocks will be controlled by the position on the hillslope. Topsoil tends to move downhill over time, and this is accentuated on hill slopes that were originally forested before being converted to erosion-prone pastoral land. The direction and magnitude of C change in the c. 70% of hill country not represented by the study of Schipper et al. (Citation2014) is not known.
Site-specific studies based at the Whatawhata and Ballantrae hill country research stations have reported both increases and decreases in soil C (). At the Whatawhata long-term superphosphate trial, soil samples (0–0.075 m) were collected from the early 1980s to 2006. For the first 6 years, soil C (0–0.075 m) increased significantly at an average of 1.56 and 1.06 t C ha−1 y−1 on easy and steep slopes, respectively (Schipper et al. Citation2011). During the subsequent 17 years there was no significant change in soil C stocks on the easy slopes but significant losses of soil C on steep slopes (mean −0.45 t C ha−1 y−1). This change in soil C trajectory was tentatively attributed to a series of dry summers in the latter part of the trial, which decreased clover growth (Schipper et al. Citation2011). Analysis of archived surface soils (0–0.075 m) collected from different slope classes and aspects of the Ballantrae superphosphate trial between 1975 and 1987 revealed an average decrease of about 0.2 t C ha−1 y−1 in both high fertility and low-fertility treatments (Lambert et al. Citation2000). The effect (or lack thereof) of superphosphate application on soil C in these two trials is discussed below. The varying trajectories of C change at these individual sites demonstrates the uncertainty of generalising temporal trends in soil C from single sites and infrequent sampling (). The potentially spurious influence of site-specific factors on temporal changes in soil C can be reduced through sampling multiple sites at different time intervals and statistically testing overall directions of change across sites (e.g. Parfitt et al. Citation2014; Schipper et al. Citation2014). The multiple sites ideally need to be selected from a purpose built soil monitoring network to account for the full range of likely soil carbon stock values that occur in the area of interest (De Gruiter et al. Citation2010; Hedley et al. Citation2012; Minasny et al. Citation2013).
Tussocks grasslands
Tussock grasslands cover about 2.3 Mha of New Zealand, and are mainly located in the South Island High Country. There are also a further 1.6 Mha of low-producing grasslands that consist of a mixture of tussock grasslands and low-producing mixed-species grasslands. Together these represent about a third of the area of New Zealand grasslands. Many of these tussock grasslands and low-producing grasslands are used for extensive livestock grazing although some others have been retired from grazing due to marginal profitability, and in some cases, due to their high conservation and recreational value. Management inputs are generally low, with some woody biomass often present. This makes these ecosystems quite different from more intensively managed pastures that are mainly based on ryegrass/clover mixes. Schipper et al. (Citation2010) measured temporal changes in soil C stocks on sites not subject to any known management changes. This sampling included 12 profiles resampled on average 34 years apart, including brown (5), Pallic (4) and semi-arid (3) soils. For the top 0.3 m, Schipper et al. (Citation2010) detected no change in average soil C stocks. However, it is clear that 12 sites are not sufficient to represent all tussock grasslands, and that there could be significant unrecognised C-stock changes in tussock grasslands. The influences of management practices on soil C stocks in tussock grasslands are outlined below.
Pastures on organic soils—a special case
Peat or organic soils are very different from mineral soils. They are formed from dead plant material that decomposes slowly due to being continuously wet (anaerobic through exclusion of oxygen), and usually are acidic. Peat soils in New Zealand have slowly developed over hundreds to thousands of years (Clarkson et al. Citation2004), but once drained for agricultural use, oxygen enters, which results in rapid decomposition and peat loss. At the national scale, the remaining land area of peat under pasture is small (about 140,000 ha; Ausseil et al. Citation2015), but since much of this land is now under constant drainage, it is an ongoing source of C loss. The majority of organic soils are found on flat land in Waikato and Southland and can be many metres deep (Pronger et al. Citation2014).
The one study that directly measured C loss (using eddy covariance techniques) estimated losses of about 2.9 t C ha−1 y−1 from a Waikato dairy farm (Nieveen et al. Citation2005; Campbell et al. Citation2015), which is consistent with reported losses for temperate drained peats in other parts of the world. Short-term C losses measured on an additional three Waikato farms were similar to short-term C losses from the farm where annual measurements were made, which suggests that the annual C loss of 2.9 t C ha−1 y−1 is a reasonable estimate of C loss from Waikato peatland pastures (Campbell et al. Citation2015). An alternative approach measured change in soil C stocks above a tephra layer of an intact peat bog adjacent to drained agricultural peat from which losses of about 3.7 t C ha−1 y−1 were estimated (Schipper & McLeod Citation2002). It is well established that drained peat soils continue to lose C until all the peat has been lost. In parts of New Zealand, these agricultural peat soils are 10 m deep, so that current loss rates (20–30 mm y−1) could be sustained for centuries as observed internationally (Pronger et al. Citation2014).
Management effects on soil C
While changes in soil C stocks resulting from land-use change have been documented (e.g. Poeplau et al. Citation2011; McNeill et al. Citation2014), soil C can also change under consistent land use due to changes in management regime, such as increased fertiliser usage or stocking rates (McSherry & Ritchie Citation2013). Isolating the specific causes for changes in soil C associated with different management regimes can be difficult, because most practices (e.g. application of fertiliser or irrigation) are aimed at increasing pasture production, which usually leads to increased stocking rates. Hence system level responses are all that can be deduced. Below, we explore the evidence for net changes in soil C associated with different management practices.
Fertiliser effects
Inputs of fertiliser are critical to maintain high productivity of pastures (e.g. Smith et al. Citation2012), which potentially increases C flux into the soil through root turnover, exudation, and surface inputs of litter and excreta. Increased pasture production will also generally lead to greater grazing intensity and more C offtake via animal respiration and produce export (Kirschbaum et al. Citation2017). Furthermore, increased fertility might result in lower root growth and C inputs to the soil (e.g. Saggar et al. Citation1999). Consequently, it is not clear from first principles whether soils will gain or lose C when fertiliser is added to existing pastures that already have high soil C stocks. There have been a few field trials of sufficient length that tested whether there are changes in soil C following fertiliser inputs. Long-term phosphorus rate trials were established in hill country at Ballantrae (Manawatu) and Whatawhata (Waikato), and on flat land at Winchmore (Canterbury). Soil samples were collected over time and archived. These samples were retrieved and analysed for soil C and N on several occasions (Lambert et al. Citation2000; Schipper et al. Citation2011, Citation2013).
The Whatawhata hill country superphosphate trial was established in 1980 and ran until 2006. It included six phosphorus application rates ranging from nil to 100 kg P ha−1 y−1 on replicate paddocks grazed by sheep. The whole site had received phosphorus fertiliser previously, but by the end of the trial there were very large differences in Olsen P values in the soil. Soil samples (0–0.075 m) were taken from ‘steep’ and ‘easy’ slopes and stored air-dried until they were analysed for total C and N (Schipper et al. Citation2011). There were large changes in soil C through time, with increases for the first 6 years followed by either no change or a decrease, depending on slope (). However, a key finding was that there were no significant differences in soil C and its temporal change among the different phosphorus application rates. In other words, phosphorus application rate had no detectable effect on soil C stocks despite very large differences in phosphorus application rates, resultant Olsen P values, and pasture production rates (Schipper et al. Citation2011). It should be noted that this finding was based on a relatively shallow sampling, and possible effects deeper in the profile were not measured.
The Ballantrae superphosphate trial was established in 1975 and consisted of 10 self-contained farmlets, 7–14 ha in size, each with 4–5 paddocks and a similar balance of slope and aspect (Lambert et al. Citation2000). Five of the farmlets received 12 kg P ha−1 y−1 (low fertility), while the other five received an average of 46 kg P ha−1 y−1 (high fertility) between 1975 and 1987. Soil samples (0–0.075 m) were taken annually in winter from 3 slope classes (0–12°, 13–25° and >25°), 3 aspects (east, north-west and south-west), with 2 sites for each of the 9 slope-aspect classes, giving a total of 18 sites per farmlet. Soils were air dried and archived. Lambert et al. (Citation2000) bulked archived soils from the three aspects and analysed them for total C. There were few significant interactions between fertiliser treatment and slope and therefore all samples from each farmlet were combined for subsequent statistical analysis, which revealed that soil C declined significantly with time on both P treatments. However, as for the Whatawhata trial, the rate of superphosphate addition had little influence on the extent of soil C loss, with losses from the high fertility and low-fertility farmlets being 0.21 and 0.19 t C ha−1 y−1, respectively ().
A third hill country superphosphate trial was conducted near Te Kuiti, with the trial comprising two self-contained farmlets with six replicate paddocks each. Both farmlets received 250 kg ha−1 of superphosphate annually between 1973 and 1983 (Roach et al. Citation1996), after which one farmlet continued to receive superphosphate at 250 kg ha−1 y−1, while the other received no fertiliser. Analysis of soil samples collected from both easy (10–20°) and steep (25–35°) slopes in 1998 (15 years after the trial started) revealed no significant difference in C between treatments (Ghani et al. Citation2003). At this trial, soils had not been collected and archived through time so that samples could not be reanalysed to determine whether there were any changes in C over time.
A lack of phosphorus fertiliser response in soil C stocks was also evident at the Winchmore trial. This trial was established in the 1950s and included separate irrigation and phosphorus treatments (McDowell & Condron Citation2012). The irrigation trial is discussed further below. The site was initially converted to border/dyke irrigation, and the formation of borders required the removal of some topsoil to create the dykes. As a consequence, the paddocks had lowered topsoil C stocks than would have been present originally. Soil samples (0–0.075 m) were then taken at least once every year and archived. Schipper et al. (Citation2013) retrieved these soil samples from three phosphorus treatments, which included a control (no phosphorus addition) and two higher application rates of phosphorus from the 1950s to 2010, and analysed these soils for soil C and nitrogen. Biomass production in the high fertiliser treatment was 2.5 times greater than in the no phosphorus treatment. All treatments, including the control, gained C through time (ranging between 0.20 and 0.23 t C ha−1 y−1 for about 50 years) but there was no significant difference in stocks or rates of accumulation between phosphorus loading rates. In 2009, Condron et al. (Citation2012) sampled soils at the Winchmore trial to 1 m depth and found no significant differences in C stocks for any depth increment (including cumulative stocks to 1 m), except for higher C in the 0–0.075 m depth for one of the phosphorus treatments than the control (P < .03).
There was, thus, strong agreement that soil C stocks did not respond to increasing phosphorus fertiliser inputs at Winchmore, Ballantrae, Te Kuiti and Whatawhata (Lambert et al. Citation2000; Ghani et al. Citation2003; Schipper et al. Citation2011, Citation2013; Condron et al. Citation2012). In contrast, there have been no published New Zealand long-term trials of the consequences of nitrogen fertiliser inputs on soil C stocks. This is an important knowledge gap. While little nitrogen fertiliser was applied before 1980, dairy farming has become heavily dependent on nitrogen fertiliser inputs since then. In a study of grazed pastures in Northern Ireland, Watson et al. (Citation2007) measured increasing rates of soil C carbon accumulation (0–0.15 m) with increasing N fertiliser inputs over a decade. Before the trial, this site had been cropped, during which it had probably lost C. Any subsequent C accumulation was potentially a recovery of C stocks and the data mean that the rate of recovery was accelerated by nitrogen inputs. Increased nitrogen inputs have also been implicated in soil C gain in low-fertility forest ecosystems (Kirschbaum et al. Citation2003; Janssens et al. Citation2010) and prairie grasslands (Fornara & Tilman Citation2012).
In all the fertiliser studies discussed above, pasture production increased with increasing rates of fertiliser application and therefore gross C inputs would have also increased. However, across all studies the increase in gross C inputs to the systems did not lead to increased soil C stocks. This was probably because increased stocking rates occurred in tandem with increased fertiliser inputs and stocking rates were generally adjusted so pasture (and thus C) utilisation (% of grown pasture ingested by animals) was similar between treatments. Greater amounts of C would therefore have been respired by grazers and exported in products (e.g. meat and wool) in treatments receiving higher rates of fertiliser (Kirschbaum et al. Citation2017). Further C allocation to roots and thus inputs to the soil may have been reduced at higher fertilisation rates. The clear evidence from phosphorus trials suggests that factors increasing C (e.g. greater productivity) must have been matched by factors decreasing C (e.g. greater C removal through plant, soil and animal respiration and produce export) with no consistent residual effect. There is too little evidence from nitrogen trials to know whether the same conclusion is also likely to hold for nitrogen fertiliser interactions.
Irrigation effects
It has long been known that soil C stocks tend to increase with increases in water availability in natural environments (Harradine & Jenny Citation1958). Hence, as with fertiliser inputs, irrigation might be expected to increase soil C stocks due to increased plant growth and inputs to soils. This hypothesis is generally supported from measurement made in irrigated desert and semi-arid environments, but less is known about irrigation in humid environments (Trost et al. Citation2013).
Mudge et al. (Citation2016) sampled soils at 34 paired irrigated and non-irrigated sites generally within the same paddock, from regions across New Zealand. Paired sites were from Canterbury (14), Manawatū (7), Bay of Plenty (7) and Otago (6) including seven soil orders that had been irrigated for between 3 and 90 years. On average, there was 7 t C ha−1 less (0–0.3 m) in irrigated than dryland sites (P < .001) and even greater losses for sites that were sampled to 0.6 m (Mudge et al. Citation2016). This study was unable to find any evidence of an interaction between the size of the measured C loss and soil type, region or length of time under irrigation. Elucidation of the causal factors of this loss is important as the area of land under irrigation in New Zealand is increasing.
The Winchmore flood irrigation trial (Canterbury) is the sole long-term irrigation trial in New Zealand, running from the 1950s until 2009. Schipper et al. (Citation2013) analysed archived soil samples (0–0.075 m) collected from along the length of the border for total C stocks from: (i) dryland (no irrigation); (ii) irrigated, when gravimetric soil moisture reached 10% (Irr10%) and (iii) irrigated when soil moisture reached 20% (Irr20%). Soil C increased in all treatments as the topsoil recovered from initial scraping to form the border dykes. Rates of accumulation ranged between 0.13 and 0.16 t C ha−1 y−1 over 40 years. Throughout the trial, dryland and Irr10% plots had higher C stocks than the more frequently irrigated Irr20% plots. In 2009, Condron et al. (Citation2014) sampled these same treatments to 1 m depth and reported that the dryland (125.5 t C ha−1) and 10% irrigation (117.8 t C ha−1) treatments had significantly greater soil C stocks than the 20% irrigation treatment (93.0 t ha−1). Kelliher et al. (Citation2012) and Condron et al. (Citation2014) concluded that irrigation increased soil respiration (C loss) substantially and that higher stocking rates meant that insufficient C inputs from increased pasture growth was stabilised as soil C to offset losses.
The border/dyke system of flood irrigation used at Winchmore is now largely obsolete in New Zealand, with new irrigation systems for pastures based on sprinkler irrigation. Kelliher et al. (Citation2015) measured C stocks (0–0.30 m) at adjacent irrigated (sprinkler) and unirrigated sites at the Lincoln University Dairy Farm, and reported no significant difference when 0–0.30 m C stocks were calculated on an equivalent mass basis, or on a volumetric basis to 0.80 m. Houlbrooke et al. (Citation2008) measured soil quality parameters (0–0.10 m) on recently irrigated, longer-term irrigated and unirrigated sites on two soil types in Otago. While they found no significant difference in soil C stocks between dryland and irrigated sites, they did find that sites on average (across 4 years of sampling) that had been irrigated for >5 years had significantly less C (36.0 t C ha−1) than sites that had been irrigated for <5 years (39.3 t C ha−1).
Across these studies, the evidence points to soil C being reduced when grazed pastures in New Zealand are irrigated. However, it is not known whether the size of C loss varies with edaphic conditions or irrigation scheduling and whether losses are ongoing. There is also a lack of studies of the effect of irrigation of grazed pastures outside New Zealand and worth further exploration as we seek to increase production in water limited environments.
Livestock type and stocking rate effects
It is inherently difficult to determine the effects of stock type on soil properties because stock types on farms are intricately related to other management practices, such as fertiliser application, irrigation, feed imports and grazing management practices. However, we can use empirical observations to gauge possible changes in soil C under the combined effect of all management factors that are typically associated with different animal types and stocking rates.
A study that compared C stocks on 25 paired dairy and drystock farms found 8 t C ha−1 (P < .05) more C in the A horizon of drystock than dairy farms although there were no significant differences in the top 0.6 m (Barnett et al. Citation2014). Barnett et al. (Citation2014) speculated that this difference might be indirectly attributable to large differences in calculated stocking rates that were much greater on dairy (24 standard ewe stock units ha−1) farms than drystock farms (14 stock units ha−1). However, a cause and effect relationship was not demonstrated. This study was repeated using a coring rather than pit sampling technique and topsoils under drystock were found to have 4.1 t C ha−1 more soil C (P = .06) than dairy pasture (Norris Citation2014). In contrast, Houlbrooke et al. (Citation2008) found no difference in soil C stocks between 20 sheep-grazed and 20 cattle- (mainly dairy) grazed pastures in Otago. However, this was not a paired site study, which reduces the ability to detect significant differences due to stock type and can also be confounded by inherent differences in soil properties.
Data are limited on the effects of different stocking rates or stock types on soil C. However, of the many changes that occur to flat land grazed pastures in New Zealand, the conversion of drystock to dairy has been common, and more research is required to investigate any impacts of this management transition on soil C stocks.
Cultivation for pasture renewal or fodder crop production
Over the last few decades, farmers have increasingly re-sown their pastures, often in conjunction with fodder cropping (e.g. turnips). This management practice frequently involves spraying existing pastures with herbicide, followed by either direct drilling seed or soil cultivation before sowing seeds. While it is well known that long-term cropping leads to a decline in soil C stocks (Davidson & Ackerman Citation1993; Haynes & Tregurtha Citation1999; Shepherd et al. Citation2001), the effect of occasionally re-sowing pastures (or cropping then re-sowing) is less well understood (Conant et al. Citation2007).
Rutledge et al. (Citation2014) used chamber and eddy covariance techniques to determine short-term net C losses during three re-grassing events on a Waikato dairy farm where existing swards were sprayed, cultivated and then re-sown directly to pasture. Measurements were made between spraying and seedling emergence, a period of 39–42 days. Net C losses ranged from 0.77 to 4.06 t C ha−1 during the period. Losses were lowest when re-grassing was done during a dry autumn period and highest in spring, presumably due to lower soil moisture limiting microbial respiration. Net C losses of this magnitude are unlikely to lead to long-term loss of soil C if re-grassing only occurs every 5–10 years, because lost C could potentially be regained during the intervening years (Rutledge et al. Citation2017). While there have not yet been any studies of this management option, inclusion of a fodder crop within the rotation could possibly increase net C losses because the site would remain de-vegetated for longer decreasing photosynthetic inputs of C while soil respiration would continue. With continued intensification of pastoral systems, the long-term effects of re-grassing and fodder cropping need to be known.
Management of tussock grasslands
Tussock grasslands occupy a large area of southern New Zealand and much of this land is generally grazed at low stocking rates (e.g. sheep, cattle, deer) or by introduced pests, such as rabbits. Several studies on changes in nutrients and C stocks have been conducted on tussock grasslands that have been managed to support greater livestock numbers. In a broad study of four tussocks grassland, soils at 38 sites were sampled (0–0.075 m depth) in 1978/1979 before superphosphate was applied (McIntosh et al. Citation1994). Subsequently, 300 kg ha−1 superphosphate was applied in 1979 and a further 800 kg ha−1 between 1980 and 1992. A second set of soil samples was taken from the same sites in 1992. Bulk densities were not reported but C contents significantly increased (P < .001) from an average of 3.3% to 5.5%, with greater increases on sunny than shaded slopes. Whether these increases also occurred lower in the profile was not known but could potentially represent a large C sink. A second study compared soil C stocks (0–0.25 m depth) under four management practices (1. ungrazed; 2. grazed; 3. oversown and 4. grazed, oversown and fertilised) (McIntosh et al. Citation1997). After 15 years, total C stocks were significantly greater (by about 5.7 t C ha−1) in the grazed, oversown and fertilised treatment in comparison to all other treatments. Last, McIntosh et al. (Citation1999) sampled 10 matched undeveloped and developed tussock grassland sites. The developed tussock sites had been fertilised with superphosphate and oversown with ryegrass/clover and cockfoot seed from 1980 onwards. Matched sites were sampled in 1997 to 0.15 m depth and analysed for a variety of soil properties. Bulk densities did not change, and the developed tussock grassland had 7 t C ha−1 more C than undeveloped tussocks. Some care in interpretation of these data is needed: while soil profiles at each site were matched, developed and undeveloped sites were on opposite sides of a valley, and there could have been pre-existing soil differences along with differences in radiation, temperature and evaporation rates.
Combined, these studies suggest that development of tussocks (by supplying fertiliser and over-sowing) can lead to increased soil C, but there is still too little information available to allow firm conclusions to be drawn. Indeed, tussock grasslands evolved in the absence of grazing by mammals and it is unclear whether grazing of undeveloped tussocks by introduced rabbits and low stocking rates of sheep may have resulted in C loss in these systems that can be partially recovered through fertiliser inputs and over-sowing (McIntosh et al. Citation1994, Citation1997, Citation1999). Given the large area of tussock grassland, this uncertainty constitutes a major data gap in the national understanding of C stock changes under grazing lands.
Summary of estimated national soil carbon stock changes
A preliminary, and partial, national assessment of soil C change in New Zealand grasslands is summarised here (). Soil C data for permanent pastures from the studies previously discussed were extrapolated based on the area of relevant land use, soil type and topographical subgroups. We do not attempt to include management effects on soil C stocks in these estimates as described earlier in this review because the area associated with these practices are not known. Two estimates are presented based on the studies by Schipper et al. (Citation2014) and Parfitt et al. (Citation2014), which differ in their assessment of change in soil C on flat land and hill country mineral soils (see above for further details of the differences between these studies). They both use the same land area information and the same estimates for C losses from organic soils. The purpose is to present the current best estimates and uncertainties and so identify gaps that research can fill to improve estimates of national-scale C stock changes. Once management effects are better understood for different soils and climates then a substantial improvement on the estimate of this national stock change could be made.
Table 4. Estimates of changes in C stocks under permanent pastures in New Zealand based on Schipper et al. (Citation2014) and Parfitt et al. (Citation2014) for non-organic soils and Campbell et al. (Citation2015) for organic soils.
Overall, the national estimate based on the Schipper et al. (Citation2014) data set suggests a slight net loss of −0.23 Mt C y−1 (95% confidence limits: –1.6 to 1.1 Mt C y−1) whereas the Parfitt et al. (Citation2014) compilation suggests a net gain of 2.9 Mt C y−1 (0.8–5.1 Mt C y−1). The major uncertainty of these estimates relates to the representativeness of the sampled sites. It is also not known whether the identified changes are ongoing (e.g. losses on allophanic soils and gains in hill country), or whether rates or even direction of change may have changed between the periods covered by the Schipper and Parfitt studies. highlights the very large uncertainty that arises depending on whether the Parfitt or Schipper data sets are used to estimate change in mineral soils in New Zealand. Both these data sets also have high variability within studies.
Parfitt et al. (Citation2014) reported gains on flat land, whereas Schipper et al. (Citation2014) reported losses. The analysis by Parfitt et al. (Citation2014) represented a more recent time period than that of Schipper et al. (Citation2014) so that it is possible that the longer-term losses for allophanic and gley soils reported by Schipper et al. (Citation2014) have now ceased. However, the sampling of Parfitt et al. (Citation2014) ranged over a shorter 7-year sampling interval, and it is also possible that the apparent trend over that short time interval was due to short-term temporal factors, measurement artefacts, or other unidentified sampling or analysis issues (e.g. first and second sets of soils not being analysed together through the same instrument).
Despite relatively few sampling sites (c. 20), both Schipper and Parfitt data sets indicate large, and highly significant, increases in soil C in hill country. It is not known whether this gain is continuing, or for how long it might continue. Soils in hill country are inherently unstable, and soil with associated C is continuously being redistributed through erosional processes, with large C losses from eroded sites followed by periods of recovery and renewed C gain (De Rose Citation2013). It is not known to what extent the trends observed by Schipper et al. (Citation2014) and Parfitt et al. (Citation2014) are part of a long- or short-term trend between major erosion events, or whether the observed C gain in mid-slope positions were representative of all hill country, or whether the gains have come at the expense of losses in other slope positions.
One of the more striking components of the current national summary is the disproportionate effect of soil C losses from organic soils. Even though these soils cover only a very small proportion (<1%) of managed grasslands in New Zealand, they are C dense systems, and their very high carbon contents are currently undergoing rapid decomposition. These losses are linked to the draining of wetlands and can generally be anticipated to persist for many more decades to centuries so long as the land remains drained. This ongoing loss differs from mineral soils, which are generally considered to approach new steady-state C contents after a few decades (Thornley & Cannell Citation1997).
Conclusions and future needs
The estimated effects of land use on soil C stocks () determined by the statistical model developed by McNeill et al. (Citation2014) was largely supported by field measurements for the conversion of native forest, low-producing pasture, tussock grassland and exotic forest to high-producing grasslands. In general, high-producing grasslands had mineral soils with higher soil C than other land uses. However, over the last few decades, a number of studies have identified additional changes in soil C within the category of high-producing grassland. Schipper et al. (Citation2014) demonstrated that for flat land, on average, allophanic and gley soils had lost soil C at a statistically significant rate of 0.54 and 0.32 t C ha−1 y−1, respectively, but there were no significant changes for other soil orders. In contrast, Parfitt et al. (Citation2014) reported no statistically significant changes in soil C under drystock and dairying. These studies covered different periods of time and sampled to different depths and the discrepancies warrant further research. Both these previously studies measured a statistically significant increase in soil C on the stable mid-slopes of hill country. Whether these changes are ongoing remains an important question.
In agreement with international studies, drainage of organic soils resulted in large losses of C. These losses are expected to continue as long as the peat is drained (Schipper & McLeod Citation2002; Pronger et al. Citation2014; Campbell et al. Citation2015). For their small area in New Zealand, these C losses represent a disproportionate contribution to national C changes, and improved management of agricultural peats (such as maintaining a higher watertable) has internationally been identified as a high priority for reducing C emissions (Smith Citation2008).
Various management practices aim to increase pasture production, including fertilisation with phosphorus, nitrogen and other nutrients, irrigation and pasture renewal among others. Although such land-use intensification has been occurring in New Zealand grazing systems for decades (MacLeod & Moller Citation2006), few data exist to understand the consequences for soil quality, including changes in soil C. From the few studies that measured soil C under different management practices, our main findings were:
Data from a number of well replicated long-term trials provided no evidence that P fertiliser application rate influenced soil C stocks.
There was strong evidence that soil C stocks were lower under irrigated than adjacent dryland pastures.
Occasional pasture renewal (and associated cultivation) was unlikely to greatly affect soil C stocks. This contrasted with general losses of C due to frequent and repeated cultivation.
The effect of different stocking types or stocking rates on soil C stocks was poorly understood.
There was some evidence that suggested that fertiliser inputs to tussock grasslands increased C stocks.
Furthermore, there is a dearth of measurements of C stock changes under different management regimes, encompassing multiple land-use intensification activities and their interactions. Multi-factor studies are needed in order to understand the complex and variable responses of soil C, which is affected not only by land use and management, but also soil type, topography, climate and land-cover/land-use history. These studies are expensive and may need to be supported for long periods of time before results are clear, consequently other approaches are also needed such as targeted resampling of previously sampled sites, sampling of well-described chronosequences and paired sites of different landuses. Other approaches that measure C balances of ecosystems rather than direct measurements of carbon stock changes can allow for greater resolution of C changes in shorter time periods (e.g. Soussana et al. Citation2004; Baldocchi Citation2008), but these methods are also expensive, highly technical and bring with them other constraints that need to be respected. All these data streams can be included into models for interpretation of observed tends and hypothesis development.
Increasingly, nations are asked to account for their environmental impacts, including their net greenhouse gas emissions, and any contributions to water and air quality. We have reviewed the best information available on measured changes in soil C stocks in New Zealand’s pasture systems. Ultimately, increasing or maintaining soil C is important for reducing CO2 in the atmosphere and for preserving soil quality. Our analysis revealed large and important gaps in our understanding of both the magnitudes of change in soil C and the associated uncertainties. The representativeness of existing soil sampling data is also unclear. These gaps may be best addressed by establishing a national framework and methodology for sampling soils through time along with site-specific leveraging of previous studies. Establishing a national measurement campaign would represent an investment in the future understanding of C stock changes while resampling of existing sample sites or sampling paired land uses would allow more rapid, but spatially constrained, understanding of soil C stock changes.
Acknowledgements
We thank Andrew Manderson for obtaining area estimates for the relevant categories in , and David Palmer, James Shepherd, Kevin Tate, Marta Camps, Peter Newsome, Surinder Saggar, Mike Beare, Stephen McNeill, Denis Curtin and two anonymous reviewers for many useful comments on this work. We would also like to thank Anne Austin for editing expertise. We thank the many land owners who granted access to their land to allow for the many studies reported here. This paper is based on Section 6 of a report commissioned by the New Zealand Ministry of Primary Industries [contract report LC2327].
Disclosure statement
No potential conflict of interest was reported by the authors.
Additional information
Funding
References
- Ausseil AGE, Jamali H, Clarkson BR, Golubiewski NE. 2015. Soil carbon stocks in wetlands of New Zealand and impact of land conversion since European settlement. Wetlands Ecology and Management. 23:947–961. doi: 10.1007/s11273-015-9432-4
- Baldocchi D. 2008. Breathing of the terrestrial biosphere: lessons learned from a global network of carbon dioxide flux measurement systems. Australian Journal of Botany. 56(1):1–26. doi: 10.1071/BT07151
- Barnett AL, Schipper LA, Taylor A, Balks MR, Mudge PL. 2014. Soil C and N contents in a paired survey of dairy and dry stock pastures in New Zealand. Agriculture Ecosystems & Environment. 185:34–40. doi: 10.1016/j.agee.2013.12.008
- Campbell DI, Wall AM, Nieveen JP, Schipper LA. 2015. Variations in CO2 exchange for dairy farms with year-round rotational grazing on drained peatlands. Agriculture Ecosystems & Environment. 202:68–78. doi: 10.1016/j.agee.2014.12.019
- Clarkson BR, Schipper LA, Lehmann A. 2004. Vegetation and peat characteristics in the development of lowland restiad peat bogs, North Island, New Zealand. Wetlands. 24:133–151. doi: 10.1672/0277-5212(2004)024[0133:VAPCIT]2.0.CO;2
- Conant RT, Easter M, Paustian K, Swan A, Williams S. 2007. Impacts of periodic tillage on soil C stocks: a synthesis. Soil & Tillage Research. 95(1–2):1–10. doi: 10.1016/j.still.2006.12.006
- Condron LM, Black A, Wakelin SA. 2012. Effects of long-term fertiliser inputs on the quantities of organic carbon in a soil profile under irrigated grazed pasture. New Zealand Journal of Agricultural Research. 55:161–164. doi: 10.1080/00288233.2012.662898
- Condron LM, Hopkins DW, Gregorich EG, Black A, Wakelin SA. 2014. Long-term irrigation effects on soil organic matter under temperate grazed pasture. European Journal of Soil Science. 65:741–750. doi: 10.1111/ejss.12164
- Davidson EA, Ackerman IL. 1993. Changes in soil carbon inventories following cultivation of previously untilled soils. Biogeochemistry. 20:161–193. doi: 10.1007/BF00000786
- Davies GM, Gray A. 2015. Don’t let spurious accusations of pseudoreplication limit our ability to learn from natural experiments (and other messy kinds of ecological monitoring). Ecology and Evolution. 5:5295–5304. doi: 10.1002/ece3.1782
- Davis MR, Condron LM. 2002. Impact of grassland afforestation on soil carbon in New Zealand: a review of paired-site studies. Australian Journal of Soil Research. 40:675–690. doi: 10.1071/SR01074
- De Gruiter J, Brus D, Bierkens M, Knotters M. 2010. Sampling for natural resource monitoring. New York (NY): Springer.
- De Rose RC. 2013. Slope control on the frequency distribution of shallow landslides and associated soil properties, North Island, New Zealand. Earth Surface Processes and Landforms. 38:356–371. doi: 10.1002/esp.3283
- Dymond JR. 2010. Soil erosion in New Zealand is a net sink of CO2. Earth Surface Processes and Landforms. 35:1763–1772. doi: 10.1002/esp.2014
- Ellert BH, Bettany JR. 1995. Calculation of organic matter and nutrients stored in soils under contrasting management regimes. Canadian Journal of Soil Science. 75:529–538. doi: 10.4141/cjss95-075
- Fornara DA, Tilman D. 2012. Soil carbon sequestration in prairie grasslands increased by chronic nitrogen addition. Ecology. 93:2030–2036. doi: 10.1890/12-0292.1
- Ghani A, Dexter M, Perrott KW. 2003. Hot-water extractable carbon in soils: a sensitive measurement for determining impacts of fertilisation, grazing and cultivation. Soil Biology & Biochemistry. 35:1231–1243. doi: 10.1016/S0038-0717(03)00186-X
- Harradine F, Jenny H. 1958. Influence of parent material and climate on texture and nitrogen and carbon contents of virgin California soils. I. Texture and nitrogen contents of soils. Soil Science. 85:235–243. doi: 10.1097/00010694-195805000-00001
- Haynes RJ, Tregurtha R. 1999. Effects of increasing periods under intensive arable vegetable production on biological, chemical and physical indices of soil quality. Biology and Fertility of Soils. 28:259–266. doi: 10.1007/s003740050491
- Hedley CB, Kusumo BH, Hedley MJ, Tuohy MP, Hawke M. 2009. Soil C and N sequestration and fertility development under land recently converted from plantation forest to pastoral farming. New Zealand Journal of Agricultural Research. 52:443–453. doi: 10.1080/00288230909510526
- Hedley CB, Payton IJ, Lynn IH, Carrick ST, Webb TH, McNeill S. 2012. Random sampling of stony and non-stony soils for testing a national soil carbon monitoring system. Soil Research. 50:18–29. doi: 10.1071/SR11171
- Hewitt A, Forrester G, Fraser S, Hedley C, Lynn I, Payton I. 2012. Afforestation effects on soil carbon stocks of low productivity grassland in New Zealand. Soil Use and Management. 28:508–516. doi: 10.1111/j.1475-2743.2012.00439.x
- Houghton RA, House JI, Pongratz J, van der Werf GR, DeFries RS, Hansen MC, Le Quéré C, Ramankutty N. 2012. Carbon emissions from land use and land-cover change. Biogeosciences. 9:5125–5142. doi: 10.5194/bg-9-5125-2012
- Houlbrooke DJ, Littlejohn RP, Morton JD, Paton RJ. 2008. Effect of irrigation and grazing animals on soil quality measurements in the North Otago Rolling Downlands of New Zealand. Soil Use and Management. 24:416–423. doi: 10.1111/j.1475-2743.2008.00183.x
- Jackman RH. 1964. Accumulation of organic matter in some New Zealand soils under permanent pasture I. Patternsof change of organic carbon, nitrogen, sulphur, and phosphorus. New Zealand Journal of Agricultural Research. 7:445–471. doi: 10.1080/00288233.1964.10416373
- Janssens IA, Dieleman W, Luyssaert S, Subke JA, Reichstein M, Ceulemans R, Ciais P, Dolman AJ, Grace J, Matteucci G, et al. 2010. Reduction of forest soil respiration in response to nitrogen deposition. Nature Geoscience. 3:315–322. doi: 10.1038/ngeo844
- Janzen HH. 2004. Carbon cycling in earth systems – a soil science perspective. Agriculture Ecosystems & Environment. 104:399–417. doi: 10.1016/j.agee.2004.01.040
- Kelliher FM, Condron LM, Cook FJ, Black A. 2012. Sixty years of seasonal irrigation affects carbon storage in soils beneath pasture grazed by sheep. Agriculture Ecosystems & Environment. 148:29–36. doi: 10.1016/j.agee.2011.10.022
- Kelliher FM, Parfitt RL, van Koten C, Schipper LA, Rys G. 2013. Use of shallow samples to estimate the total carbon storage in pastoral soils. New Zealand Journal of Agricultural Research. 56:86–90. doi: 10.1080/00288233.2012.729512
- Kelliher FM, West PJS, Moir JL. 2015. Soil carbon stock beneath an established irrigated pasture grazed by dairy cattle. New Zealand Journal of Agricultural Research. 58:78–83. doi: 10.1080/00288233.2014.937878
- Kim DG, Kirschbaum MUF. 2015. The effect of land-use change on the net exchange rates of greenhouse gases: a compilation of estimates. Agriculture Ecosystems & Environment. 208:114–126. doi: 10.1016/j.agee.2015.04.026
- Kirschbaum MUF, Rutledge S, Kuijper IA, Mudge PL, Puche N, Wall AM, Roach CG, Schipper LA, Campbell DI. 2015. Modelling carbon and water exchange of a grazed pasture in New Zealand constrained by eddy covariance measurements. Science of the Total Environment. 512–513:273–286. doi: 10.1016/j.scitotenv.2015.01.045
- Kirschbaum MUF, Simioni G, Medlyn BE, McMurtrie RE. 2003. On the importance of including soil nutrient feedback effects for predicting ecosystem carbon exchange. Functional Plant Biology. 30:223–237. doi: 10.1071/FP02152
- Kirschbaum MUF, Schipper LA, Mudge PL, Rutledge S, Puche NJB, Campbell DI. 2017. The trade-offs between milk production and soil organic carbon storage in dairy systems under different management and environmental factors. Science of the Total Environment. 577:61–72. doi: 10.1016/j.scitotenv.2016.10.055
- Lal R. 2004. Soil carbon sequestration to mitigate climate change. Geoderma. 123(1–2):1–22. doi: 10.1016/j.geoderma.2004.01.032
- Lambert MG, Clark DA, Mackay AD, Costall DA. 2000. Effects of fertiliser application on nutrient status and organic matter content of hill soils. New Zealand Journal of Agricultural Research. 43:127–138. doi: 10.1080/00288233.2000.9513414
- MacLeod CJ, Moller H. 2006. Intensification and diversification of New Zealand agriculture since 1960: an evaluation of current indicators of land use change. Agriculture Ecosystems & Environment. 115:201–218. doi: 10.1016/j.agee.2006.01.003
- McDowell RW, Condron LM. 2012. Phosphorus and the Winchmore trials: review and lessons learnt. New Zealand Journal of Agricultural Research. 55:119–132. doi: 10.1080/00288233.2012.662899
- McIntosh PD, Allen RB, Patterson RG. 1994. Temporal changes of vegetation and soil carbon, nitrogen and pH on seasonally dry high country, South Island, New Zealand. The Rangeland Journal. 16:3–15. doi: 10.1071/RJ9940003
- McIntosh PD, Allen RB, Scott N. 1997. Effects of exclosure and management on biomass and soil nutrient pools in seasonally dry high country, New Zealand. Journal of Environmental Management. 51:169–186. doi: 10.1006/jema.1997.0143
- McIntosh PD, Gibson RS, Saggar S, Yeates GW, McGimpsey P. 1999. Effect of contrasting farm management on vegetation and biochemical, chemical, and biological condition of moist steepland soils of the South Island high country, New Zealand. Australian Journal of Soil Research. 37:847–865. doi: 10.1071/SR98086
- McNeill SJE, Barringer JRF. 2014. Respecification and reclassification of the 2013 MfE soil CMS model. Prepared for the New Zealand Ministry for the Environment, Wellington.
- McNeill SJE, Golubiewski N, Barringer J. 2014. Development and calibration of a soil carbon inventory model for New Zealand. Soil Research. 52:789–804. doi: 10.1071/SR14020
- McSherry ME, Ritchie ME. 2013. Effects of grazing on grassland soil carbon: a global review. Global Change Biology. 19:1347–1357. doi: 10.1111/gcb.12144
- Meersmans J, Van Wesemael B, De Ridder F, Dotti MF, De Baets S, Van Molle M. 2009. Changes in organic carbon distribution with depth in agricultural soils in northern Belgium, 1960–2006. Global Change Biology. 15:2739–2750. doi: 10.1111/j.1365-2486.2009.01855.x
- MfE. 2014. New Zealand’s greenhouse gas inventory 1990–2012. Wellington: MfE.
- MfE. 2015. New Zealand’s greenhouse gas inventory 1990–2013. Wellington: MfE.
- Minasny B, McBratney AB, Malone BP, Wheeler I. 2013. Digital mapping of soil carbon. Advances in Agronomy. 118:1–47. doi: 10.1016/B978-0-12-405942-9.00001-3
- Mudge PL, Kelliher FM, Knight T, O’Conell D, Fraser S, Schipper LA. 2016. Irrigating grazed pasture decreases soil carbon and nitrogen stocks. Global Change Biology. doi:10.1111/gcb.13448.
- Murty D, Kirschbaum MUF, McMurtrie RE, McGilvray A. 2002. Does conversion of forest to agricultural land change soil carbon and nitrogen? A review of the literature. Global Change Biology. 8:105–123. doi: 10.1046/j.1354-1013.2001.00459.x
- Nieveen JP, Campbell DI, Schipper LA, Blair IJ. 2005. Carbon exchange of grazed pasture on a drained peat soil. Global Change Biology. 11:607–618. doi: 10.1111/j.1365-2486.2005.00929.x
- Norris T. 2014. Detection of differences in soi carbon and nitrogen stocks between paired dairy and drystock pastures [unpublished thesis]. Hamilton: University of Waikato. 147 p.
- Olson KR, Al-Kaisi MM, Lal R, Lowery B. 2014. Experimental consideration, treatments, and methods in determining soil organic carbon sequestration rates. Soil Science Society of America Journal. 78:348–360. doi: 10.2136/sssaj2013.09.0412
- Page M, Trustrum N, Brackley H, Baisden T. 2004. Erosion-related soil carbon fluxes in a pastoral steepland catchment, New Zealand. Agriculture Ecosystems & Environment. 103:561–579. doi: 10.1016/j.agee.2003.11.010
- Parfitt RL, Baisden WT, Ross CW, Rosser BJ, Schipper LA, Barry B. 2013. Influence of erosion and deposition on carbon and nitrogen accumulation in resampled steepland soils under pasture in New Zealand. Geoderma. 192:154–159. doi: 10.1016/j.geoderma.2012.08.006
- Parfitt RL, Ross DJ. 2011. Long-term effects of afforestation with Pinus radiata on soil carbon, nitrogen, and pH: a case study. Soil Research. 49:494–503. doi: 10.1071/SR11106
- Parfitt RL, Stevenson BA, Ross C, Fraser S. 2014. Changes in pH, bicarbonate-extractable-P, carbon and nitrogen in soils under pasture over 7 to 27 years. New Zealand Journal of Agricultural Research. 57:216–227. doi: 10.1080/00288233.2014.924536
- Parsons AJ, Thornley JH, Newton PC, Rasmussen S, Rowarth JS. 2013. Soil carbon dynamics: the effects of nitrogen input, intake demand and off-take by animals. Science of the Total Environment. 465:205–215. doi: 10.1016/j.scitotenv.2013.02.019
- Poeplau C, Don A, Vesterdal L, Leifeld J, Van Wesemael B, Schumacher J, Gensior A. 2011. Temporal dynamics of soil organic carbon after land-use change in the temperate zone – carbon response functions as a model approach. Global Change Biology. 17:2415–2427. doi: 10.1111/j.1365-2486.2011.02408.x
- Pronger J, Schipper LA, Hill RB, Campbell DI, McLeod M. 2014. Subsidence rates of drained agricultural peatlands in New Zealand and the relationship with time since drainage. Journal of Environmental Quality. 43:1442–1449. doi: 10.2134/jeq2013.12.0505
- Richter DD, Hofmockel M, Callaham MA, Powlson DS, Smith P. 2007. Long-term soil experiments: keys to managing Earth’s rapidly changing ecosystems. Soil Science Society of America Journal. 71:266–279. doi: 10.2136/sssaj2006.0181
- Roach CG, Nemaia EKK, Ledgard SF, Brier GJ, McLay CDA. 1996. Effects of long-term differences in fertiliser history on hill country: seasonal pasture production, legume growth and soil phosphorus status. Proceedings of the New Zealand Grassland Association. 57:105–109.
- Rosser BJ, Ross CW. 2011. Recovery of pasture production and soil properties on soil slip scars in erodible siltstone hill country, Wairarapa, New Zealand. New Zealand Journal of Agricultural Research. 54:23–44. doi: 10.1080/00288233.2010.535489
- Rutledge S, Mudge PL, Wallace DF, Campbell DI, Woodward SL, Wall AM, Schipper LA. 2014. CO2 emissions following cultivation of a temperate permanent pasture. Agriculture Ecosystems & Environment. 184:21–33. doi: 10.1016/j.agee.2013.11.005
- Rutledge S, Wall AM, Mudge PL, Troughton B, Campbell DI, Pronger J, Joshi C, Schipper LA. 2017. The carbon balance of a temperate grassland Part II: the impact of pasture renewal via direct drilling. Agriculture Ecosystems & Environment. 239:132–142. doi: 10.1016/j.agee.2017.01.013
- Saggar S, Mackay AD, Hedley CB. 1999. Hill slope effects on the vertical fluxes of photosynthetically fixed C-14 in a grazed pasture. Australian Journal of Soil Research. 37:655–666.
- Schipper LA, Baisden WT, Parfitt RL, Ross C, Claydon JJ, Arnold G. 2007. Large losses of soil C and N from soil profiles under pasture in New Zealand during the past 20 years. Global Change Biology. 13:1138–1144. doi: 10.1111/j.1365-2486.2007.01366.x
- Schipper LA, Dodd MB, Fisk LM, Power IL, Parenzee J, Arnold G. 2011. Trends in soil carbon and nutrients of hill-country pastures receiving different phosphorus fertilizer loadings for 20 years. Biogeochemistry. 104:35–48. doi: 10.1007/s10533-009-9353-5
- Schipper LA, Dodd MB, Pronger J, Mudge PL, Upsdell M, Moss RA. 2013. Decadal changes in soil carbon and nitrogen under a range of irrigation and phosphorus fertilizer treatments. Soil Science Society of America Journal. 77:246–256. doi: 10.2136/sssaj2012.0126
- Schipper LA, McLeod M. 2002. Subsidence rates and carbon loss in peat soils following conversion to pasture in the Waikato Region, New Zealand. Soil Use and Management. 18:91–93. doi: 10.1111/j.1475-2743.2002.tb00225.x
- Schipper LA, Parfitt RL, Fraser S, Littler RA, Baisden WT, Ross C. 2014. Soil order and grazing management effects on changes in soil C and N in New Zealand pastures. Agriculture Ecosystems & Environment. 184:67–75. doi: 10.1016/j.agee.2013.11.012
- Schipper LA, Parfitt RL, Ross C, Baisden WT, Claydon JJ, Fraser S. 2010. Gains and losses in C and N stocks of New Zealand pasture soils depend on land use. Agriculture Ecosystems & Environment. 139:611–617. doi: 10.1016/j.agee.2010.10.005
- Schipper LA, Sparling GP. 2011. Accumulation of soil organic C and change in C:N ratio after establishment of pastures on reverted scrubland in New Zealand. Biogeochemistry. 104:49–58. doi: 10.1007/s10533-009-9367-z
- Scott DT, Baisden WT, Davies-Colley R, Gomez B, Hicks DM, Page MJ, Preston NJ, Trustrum NA, Tate KR, Woods RA. 2006. Localized erosion affects national carbon budget. Geophysical Research Letters. 33(1):L01402. doi:10.1029/2005GL024644.
- Shepherd TG, Saggar S, Newman RH, Ross CW, Dando JL. 2001. Tillage-induced changes to soil structure and organic carbon fractions in New Zealand soils. Australian Journal of Soil Research. 39:465–489. doi: 10.1071/SR00018
- Smith LC, Moss RA, Morton JD, Metherell AK, Fraser TJ. 2012. Pasture production from a long-term fertiliser trial under irrigation. New Zealand Journal of Agricultural Research. 55:105–117. doi: 10.1080/00288233.2012.662897
- Smith P. 2008. Land use change and soil organic carbon dynamics. Nutrient Cycling in Agroecosystems. 81:169–178. doi: 10.1007/s10705-007-9138-y
- Smith P, Haberl H, Popp A, Erb KH, Lauk C, Harper R, Tubiello FN, de Siqueira Pinto A, Jafari M, Sohi S, et al. 2013. How much land-based greenhouse gas mitigation can be achieved without compromising food security and environmental goals? Global Change Biology. 19:2285–2302. doi: 10.1111/gcb.12160
- Soussana JF, Loiseau P, Vuichard N, Ceschia E, Balesdent J, Chevallier T, Arrouays D. 2004. Carbon cycling and sequestration opportunities in temperate grasslands. Soil Use and Management. 20:219–230. doi: 10.1079/SUM2003234
- Sparling G, Ross D, Trustrum N, Arnold G, West A, Speir T, Schipper L. 2003. Recovery of topsoil characteristics after landslip erosion in dry hill country of New Zealand, and a test of the space-for-time hypothesis. Soil Biology & Biochemistry. 35:1575–1586. doi: 10.1016/j.soilbio.2003.08.002
- Sparling G, Schipper L. 2004. Soil quality monitoring in New Zealand: trends and issues arising from a broad-scale survey. Agriculture Ecosystems & Environment. 104:545–552. doi: 10.1016/j.agee.2003.11.014
- Sparling GP, Lewis R, Schipper LA, Mudge P, Balks M. 2014. Changes in soil total C and N contents at three chronosequences after conversion from plantation pine forest to dairy pasture on a New Zealand Pumice soil. Soil Research. 52:38–45. doi: 10.1071/SR13102
- Sparling GP, Wheeler D, Vesely ET, Schipper LA. 2006. What is soil organic matter worth? Journal of Environmental Quality. 35:548–557. doi: 10.2134/jeq2005.0230
- Tate KR, Wilde RH, Giltrap DJ, Baisden WT, Saggar S, Trustrum NA, Scott NA, Barton JP. 2005. Soil organic carbon stocks and flows in New Zealand: system development, measurement and modelling. Canadian Journal of Soil Science. 85:481–489. doi: 10.4141/S04-082
- Thornley JHM, Cannell MGR. 1997. Temperate grassland responses to climate change: an analysis using the Hurley pasture model. Annals of Botany. 80(2):205–221. doi: 10.1006/anbo.1997.0430
- Trost B, Prochnow A, Drastig K, Meyer-Aurich A, Ellmer F, Baumecker M. 2013. Irrigation, soil organic carbon and N2O emissions. A review. Agronomy for Sustainable Development. 33:733–749. doi: 10.1007/s13593-013-0134-0
- Walker TW, Thapa BK, Adams AFR. 1959. Studies on soil organic matter: 3. Accumulation of carbon, nitrogen, sulphur, organic and total phosphorus in improved grassland soils. Soil Science. 87:135–140. doi: 10.1097/00010694-195903000-00003
- Wang T, Camps-Arbestian M, Hedley CB. 2016. Factors influencing the molecular composition of soil organic matter in New Zealand grasslands. Agriculture, Ecosystems and Environment. 232:290–301. doi: 10.1016/j.agee.2016.08.016
- Watson CJ, Jordan C, Kilpatrick D, McCarney B, Stewart R. 2007. Impact of grazed grassland management on total N accumulation in soil receiving different levels of N inputs. Soil Use and Management. 23:121–128. doi: 10.1111/j.1475-2743.2006.00081.x
- Wendt JW, Hauser S. 2013. An equivalent soil mass procedure for monitoring soil organic carbon in multiple soil layers. European Journal of Soil Science. 64:58–65. doi: 10.1111/ejss.12002