
ABSTRACT
The aim of this research was to assess the potential of using perennial ryegrass (Lolium perenne) and white clover (Trifolium repens) forages containing plantain (Plantago lanceolata L.) (PRGWC + Plantain) to mitigate nitrate (NO3−) leaching in grazed grassland. Lysimeter studies were carried out to determine NO3− leaching losses from the PRGWC + Plantain forage, compared with the standard perennial ryegrass and white clover forage (PRGWC) under three different irrigation conditions (flood, rotorainer and pivot). Fresh dairy cow urine (700 kg N ha−1) was applied to these lysimeters in early summer (December) and late summer (February). Nitrogen (N) dynamics and the abundance of ammonia oxidising bacteria (AOB) and archaea (AOA) were also determined in companion mini-plots alongside the lysimeters. Nitrate leaching losses from the PRGWC + Plantain forage were 82% lower than those from the PRGWC forage when urine was applied in December and 74% less when urine was applied in February (P < .05). This was possibly due to the release of biological nitrification inhibitors by plantain which slowed down the nitrification process and this, combined with a lower drainage volume, was largely responsible for the lower NO3− leaching losses in the PRGWC + Plantain forages. The three different irrigation schemes did not significantly affect NO3− leaching losses under the two forage types. These results demonstrate the potential of using PRGWC + Plantain forages as an effective mitigation option for NO3− leaching in grazed grasslands.
Introduction
Nitrate (NO3−) leaching from agricultural land and the contamination of ground and surface waters is a major environmental concern (Di & Cameron Citation2002a; Cameron et al. Citation2013; Selbie et al. Citation2015). In intensively-grazed dairy forage systems, the main source of NO3− leached from soil comes from the nitrogen (N) that is deposited as urine onto the soil surface (Selbie et al. Citation2015). Typically, the N deposited in a cow urine patch exceeds plant nutritional requirements; thus surplus N (in the form of NO3−) can be leached from the soil profile when drainage occurs (Cameron et al. Citation2013).
Recent research has shown that cows grazing forages that contain plantain (Plantago lanceolata L.) have lower concentrations of N in their urine compared with cows grazing standard perennial ryegrass (Lolium perenne) and white clover (Trifolium repens) forages (Woodward et al. Citation2012; Totty et al. Citation2013; Edwards et al. Citation2015; Box et al. Citation2016). This lower N concentration in the urine is calculated to reduce the N loading rate in the urine patches and may therefore reduce NO3− leaching losses (Di & Cameron Citation2007). In addition, it has also been suggested that forages containing plantain may release biological nitrification inhibiting (BNI) compounds into the soil which could also reduce the risk of NO3− leaching by reducing the nitrification rate, thus allowing ammonium ions to be stored on cation exchange sites in the soil (Subbarao et al. Citation2012; Dietz et al. Citation2013). There is a lack of knowledge about the effect of plantain on soil nitrification rates and NO3− leaching losses.
The hypothesis tested in this experiment was that NO3− leaching losses would be lower from cow urine applied to soil with a perennial ryegrass, white clover and plantain (PRGWC + Plantain) forage composition compared with urine applied to soil with a standard perennial ryegrass and white clover (PRGWC) forage. Urine collected from cows grazing on PRGWC only forage was used specifically to test the effect of plant species composition on soil nitrification rates and leaching loss without the confounding factor of different chemical compositions of urine from different forages. This hypothesis was tested under three simulated irrigation types commonly used in New Zealand (i.e. pivot, rotorainer and flood) and on urine deposited in early summer (December) and late summer (February).
Materials and methods
Lysimeter and soil block collection
Sixty intact soil monolith lysimeters (500 mm diameter × 700 mm depth) were taken from PRGWC and PRGWC + Plantain field plots located on the Lincoln University Research Dairy Farm (LURDF) (43°38′52″S, 172°28′07″E). The soil is a well-drained Paparua fine sandy loam (Typic Immature Pallic soil (Hewitt Citation2010); USDA: Udic Haplustept (Soil Survey Staff Citation2014)), which consists of a fine sandy loam over a loamy sand. The parent material is alluvium derived from greywacke and the soil is described as moderately permeable with a high available water content (mm) in the root zone.
The lysimeters were collected using established protocols outlined by Cameron et al. (Citation1992). Briefly, this involved placing a metal (500 mm diameter by 700 mm depth) cylinder casing on the soil surface, digging around the casing, making sure to minimise disturbance to the soil structure inside, and gradually pushing the casing down by small increments. Once the casing had reached the desired depth (700 mm) the soil monolith was then cut at the base with a cutting plate, secured on the lysimeter casing, and lifted out of the collection site. The gap between the soil core and the casing was sealed using petroleum jelly to stop edge-flow effects. The lysimeters were then installed in a field facility on either side of a trench with the soil surface of the lysimeters at the same level as the surrounding field. The space outside the lysimeter casings was backfilled with soil to the same level as the surface of the lysimeters and the surrounding field. The lysimeters were exposed to the same climatic conditions as the soil and forage in the surrounding paddock.
Intact soil blocks (500 mm diameter × 75 mm deep), were also collected from the same PRGWC and PRGWC + Plantain forage plots. A cylindrical metal casing was carefully pushed into the soil in small 20 mm increments. Once at the desired depth, a cutting plate was then used to separate the soil block from the underlying subsoil. The soil blocks were installed alongside the lysimeter facility at LURDF. A metal sheet (150 mm deep) was then inserted vertically at the half way point of the soil block, and sat flush with the metal casing. This prevented urine seeping into the control portion of the soil block. The soil blocks were installed on top of a sandy layer to promote natural drainage. The trench was then backfilled with soil to the same level as the soil block surface. This enabled the soil blocks to be exposed to the same climatic conditions as the surrounding paddock.
Experiment description and design
One set of 30 lysimeters received a cow urine application in December (early summer) and a second set of 30 lysimeters plus soil blocks received a cow urine application in February (late summer).
The forages from both lysimeter collection sites were sown in March 2014 and at the time of extraction were two years old. The PRGWC forage contained perennial ryegrass and white clover. The PRGWC + Plantain contained perennial ryegrass, white clover and plantain (Plantago lanceolata L. cv. ‘Tonic’) (Agricom NZ). Sowing rates and cultivars are shown in . The perennial ryegrass cultivar used was ‘Trojan’ with NEA2 endophyte. Trojan is a late heading and high yielding diploid cultivar with high production on the shoulders of the season (winter/early spring and autumn) (Agriseeds Ltd Citation2013). Visual observations in the field and photographs of individual lysimeters and soil blocks were used to estimate the proportion of plantain in the PRGWC + Plantain forage. It was estimated that the proportion of plantain in the PRGWC + Plantain forage ranged from 20% to 30%.
Table 1. Species, cultivars and sowing rates for PRGWC and PRGWC + Plantain forages.
Irrigation was applied to reflect typical irrigation rates in the Canterbury region. Pivot irrigators typically apply 5–25 mm of water with a return period of 1–7 days; rotorainer irrigators typically apply 35–50 mm of water with a return period of 9–14 days, and flood irrigators typically apply 80–120 mm of water with a return period of 2–4 weeks (Hydroservices Ltd Citation2014).
The experimental design consisted of 12 treatments including 2 forage types (PRGWC vs. PRGWC + Plantain), three irrigation types (pivot vs. rotorainer vs. flood), two urine application dates (December vs. February) and one urinary–N application rate (700 kg N ha−1) (). Urine collected from cows grazing on the standard PRGWC forage was used specifically to test the effect of plant species composition on soil nitrification rates and leaching loss without the confounding factor of different chemical compositions of urine from different forages. The treatments were replicated five times and were arranged in a randomised split/split plot design. Dairy cow urine was applied to one set of lysimeters on 10 December 2015 and to another set of lysimeters on 19 February 2016, and measurements were taken thereafter until 30 September 2016.
Table 2. Description of lysimeter treatments.
Urine collection and application
On 9 December 2015 (early summer), fresh dairy cow urine was collected from Friesian × Jersey cows grazing ryegrass/clover forages on the Lincoln University Dairy Farm (LUDF) during the afternoon milking. The total urinary–N concentration was 3.7 g N L−1. This was standardised to a concentration of 7 g N L−1 using urea, and glycine in a 9:1 ratio (Bathurst Citation1952). Individual lysimeters (December application) received a 2 L surface application of urine to simulate urine patch deposition by grazing dairy cows at a loading rate equivalent to 700 kg N ha−1 (Selbie et al. Citation2015). Following the same procedure, fresh dairy cow urine was again collected from LUDF on 18 February 2016 (late summer). The total urinary–N concentration was 5.2 g N L−1, which was again standardised to a concentration of 7 g N L−1. Individual lysimeters (February application) then received a 2 L surface application of urine at a loading rate equivalent to 700 kg N ha−1. Soil blocks received a similar surface application of urine to simulate typical urine patch deposition by grazing dairy cows at a loading rate of 700 kg N ha−1 (Selbie et al. Citation2015).
Irrigation scheduling
From December to April (summer), pivot and rotorainer irrigation treatments were simulated using a precision controlled nozzle irrigation system. Flood irrigation was manually applied to individual lysimeters during this period. This involved measuring out 18 L of water (equivalent to 90 mm) and pouring the water onto the lysimeter to simulate flood irrigation. A stainless-steel ring was attached to the top of each lysimeter to prevent overflowing when the large volume of water was applied. Each ring was inserted 100 mm into the soil and sealed around the top edge of the lysimeter using silicone sealant. The rings were attached to all the lysimeters to maintain consistent micro environmental conditions between treatments. The pivot irrigation treatment comprised of irrigation every three days at an application rate of 15 mm and at an intensity of 20 mm h−1 (). The rotorainer irrigation treatment comprised of irrigation every nine days at an application rate of 45 mm and at an intensity of 20 mm h−1, and the flood irrigation treatment comprised of irrigation every 18 days at an application rate of 90 mm and at an intensity of 90 mm h−1 (). Irrigation was applied to match typical irrigation rates for pivot, rotorainer and flood irrigation in the Canterbury region (Hydroservices Ltd Citation2014). Soil moisture sensors (TDR) were used to monitor the soil moisture content and adjust irrigation applications when necessary. In the event of natural rainfall, the period of time between irrigation events was extended to remain consistent with typical irrigation practice.
Lysimeter sampling and analyses
Leachate and herbage sub-samples were collected from individual lysimeters for laboratory analysis. Leachates from the lysimeters were collected as required (when drainage was above 200 mL) or weekly and were analysed for nitrate, nitrite, and ammonium concentrations using a Foss FIAstar 5000 twin channel analyser (Foss Tecator AB, Hoganas, Sweden) (Gal et al. Citation2004). The amount of N leached per lysimeter was calculated using the formula: amount of NO3−-N leached (mg N lys−1) = N concentration (mg NO3− L−1) × drainage (L). The herbage was cut periodically (about monthly) to simulate typical grazing practice. All the harvested herbage was removed and dry matter (DM) yields recorded. The analysis of herbage total N was conducted using an Elementar Vario-Max CN Elementar Analyser (Elementar GmbH, Hanau, Germany).
Soil block sampling and analysis
Three soil cores (75 mm depth) were randomly taken, on each sample day, from both the urine and control treatments within each soil block. Samples were collected on day 1, 7, 14, 30, 60 and 90 for DNA extractions, potassium chloride extractions and soil moisture content. The three soil cores were bulked, thoroughly mixed, and sub-samples were taken. Extra soil taken from the soil block collection site was used to backfill the remaining holes. Markers were then used to avoid re-sampling from the same area. Herbage was cut on the same day as the lysimeters and was discarded.
Potassium chloride (KCl) extracts were performed on 5 g of field moist soil using 25 mL of 2M KCl extraction solution with shaking for 1 h on an end over end shaker and then centrifuging at 4000 rpm for 10 min (Keeney & Nelson Citation1982). Once removed, the samples were filtered through 110 mm Avantec 5C filter paper funnels, and frozen at −20°C until analysed. Soil inorganic N concentrations (NO3− and NH4+) were determined using a FOSS FIAstar 5000 twin channel analyser (Foss Tecator AB, Hoganas, Sweden).
AOA and AOB assays
To understand the effect of the different forages on the ammonia oxidising bacteria (AOB) and archaea (AOA), and on the soil mineral N dynamics, soil samples were collected on day 1, 7, 14, 30, 60 and 90 and stored at −80°C until DNA extraction. The DNA extraction and PCR analysis followed methodologies adapted from Di et al. (Citation2009). DNA was extracted from the soil using a NucleoSpin® Soil Kit (Macherey-Nagel, Düren, Germany) as per the manufacturer’s instructions. In brief, a 0.25 g soil sample was weighed into a NucleoSpin® Bead Tube to which 700 µL of Buffer SL2, and 150 µL of Enhancer SX were added. The sample was homogenised for 1 min using a FastPrep®-24 Sample Preparation System (M.P. Biomedicals, California, USA) at a speed of 6 m s−1. The tubes were centrifuged at 11,000 rpm for 2 min (Centrifuge 5424, Eppendorf AG, Hamburg, Germany), and the supernatant transferred into a sterilised 1.7 mL tube. Next 150 µL of Buffer SL3 was added and the samples were shaken for 5 s prior to incubation at 4°C for 5 min. The tubes were centrifuged at 11,000 rpm for 1 min, and up to 700 µL of supernatant was transferred into a NucleoSpin® Inhibitor Removal Column fitted on top of a collection tube. Tubes were again centrifuged at 11,000 rpm for 1 min and the column was discarded. 250 µL of Buffer SB was added to the flow through and mixed with a pipette. A NucleoSpin® Soil Column was placed in a new collection tube and a 550 µL sample of this was loaded onto the column. This was centrifuged at 11,000 rpm for 1 min and the flow through discarded. This step was repeated until no sample remained. 500 µL of Buffer SB was added to the NucleoSpin® Soil Column. This was centrifuged at 11,000 rpm for 30 s and the flow through was again discarded. The column was then washed with 550 µL of Buffer SW1, and twice with 700 µL of Buffer SW2. Once the final flow through was discarded, the column and collection tube was centrifuged at 11,000 rpm for 2 min to remove any residual ethanol. The NucleoSpin® Soil Column was then transferred to a new collection tube and the DNA was eluted using 100 µL of Elution Buffer SE. The sample was incubated at room temperature for 1 min and centrifuged at 11,000 rpm for 30 s. DNA was stored at −20°C for further analysis.
AOA and AOB ammonia monoxygenase gene (amoA) abundance was measured using real time quantitative polymerase chain reaction (qPCR) on a Rotor-GeneTM 6000 (Corbett Research, Australia). All qPCR reactions were prepared using a CAS1200 Robotic liquid handling system (Corbett Robotics, Australia). The AOA and AOB amoA genes were quantified using the primer pairs amoA-1F and amoA R-I (Hornek et al. Citation2006), and Arch-amoAF and Arch-amoAR (Francis et al. Citation2005), respectively (). A reaction mixture of 16 µL contained 8 µL 2x SYBR® Premix Ex TaqTM (Tli RNaseH Plus, Takara Bio Inc., Shiga, Japan), 0.4 µL of each primer, and sterile deionised water to bring up to total volume of 14.5 µL and 1.5 µL of DNA sample. All genomic DNA samples were diluted 10 times with deionised water prior to use. Serial dilutions of standards with a range of 101–107 copies µL−1 were run in duplicate for each gene to produce standard curves. Once the PCR reactions were prepared the RotorDiscTM 100 was sealed using a Gene-DiscTM Heat Sealer (HS-01, Corbett Research, Australia). The qPCR temperature profiles used are given in . A melting curve analysis was performed after amplification to check for nonspecific amplification products. The fluorescence was measured continuously as the temperature increased from 72°C to 99°C. Data were then analysed using the Rotor-GeneTM series software 1.7.
Table 3. qPCR primers and temperature cycles (Francis et al. Citation2005; Hornek et al. Citation2006).
Standard curves for real-time qPCR were developed using the following process. Bacterial and archaeal amoA genes were amplified from the extracted DNA using the aforementioned primers. A qPCR clean up kit (Axygen) was used to purify the PCR products which were cloned into the pGEM-T Easy Vector (Promega, Madison, WI). Following the manufacturer’s instructions, the resulting clones were transformed in Escherichia coli JM109 competent cells (Promega). The transformed E. coli cells were grown on solid LB plates at 37°C overnight. Ten to 15 bacterial colonies from the plate were individually inoculated into a 3 mL LB broth medium and incubated overnight in an orbital incubator-shaker at 37°C and 250 rpm. The plasmids carrying correct gene inserts were then extracted from bacterial cultures using QIA Prep Spin Miniprep Kit (Qiagen, Crawley, UK) and sent for sequencing. The DNA concentration was determined on a QubitTM Fluorometer (InvitrogenTM, New Zealand). The copy numbers of target genes were calculated directly from the concentration of extracted DNA. To generate an external standard curve, tenfold serial dilutions of a known copy number of the extracted plasmid DNA were subjected to a real-time PCR assay in duplicate.
Statistical analysis
Statistical analysis was carried out using analysis of variance (Genstat 16th Edition, VSN International Ltd). Standard errors of the mean were calculated and are presented with the mean values. The total drainage, total NH4+ and NO3− in the leachate and total herbage DM yield and N uptake data were log-transformed to normalise the variance and to determine statistical treatment effects. The soil NO3− and NH4+ concentration data and the AOA and AOB abundance data were log-transformed to normalise the variance and to determine statistical treatment effects.
Results
Temperature
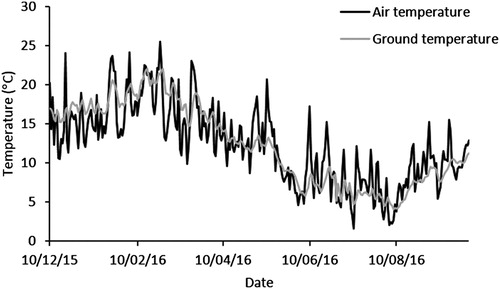
The minimum air and ground temperatures were recorded on 11 July 2016 and 8 August 2016 at 1.6°C and 4.1°C, respectively (). The maximum air and ground temperatures were measured on 26 February 2016 and 17 February 2016 at 25°C and 22°C, respectively ().
Figure 1. Average daily air and ground temperatures from December 2015 to September 2016.
Water inputs
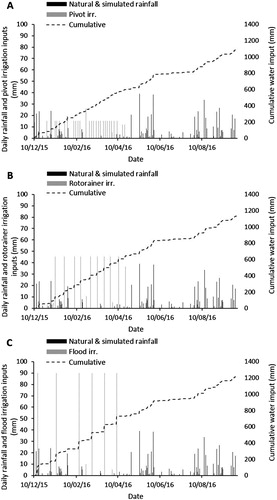
From December 2015 to April 2016, the total amounts of irrigation applied were 422 mm under the pivot irrigation treatment (A), 468 mm under the rotorainer irrigation treatment (B), and 555 mm under the flood irrigation treatment (C). The total rainfall (natural and simulated) for the experimental period was 666 mm, with the majority falling in May, August and September 2016 (). Each irrigation type was scheduled according to the amount of rainfall received (as would occur on farm with good practice irrigation management).
Figure 2. Daily and cumulative water inputs (mm) from December 2015 to September 2016 for pivot irrigation (A), rotorainer irrigation (B), and flood irrigation (C).
Drainage
The total amount of drainage over the summer period tended to be lower under pivot and rotorainer irrigation () but this was not statistically significant (P = .338). Maximum drainage rates were recorded during the autumn and winter period for all irrigation treatments. Due to a lack of rainfall, no drainage was collected during July 2016.
Figure 3. Total amount of drainage (mm) averaged from each treatment following urine application in December (A) and February (B). Note: Error bars are ± SEM.
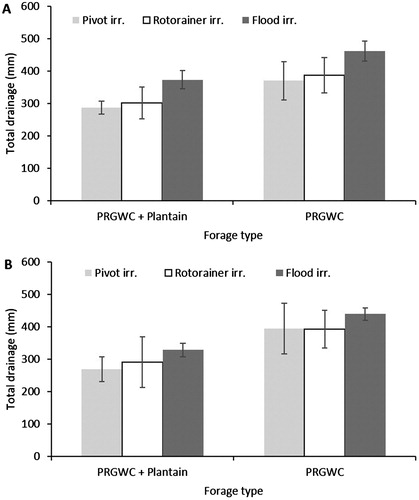
Averaged across all irrigation treatments, the total amount of drainage was significantly affected by forage type (P < .001): drainage from the PRGWC + Plantain forage was 21% less than that from the PRGWC forage when urine was applied in December, and 28% less when urine was applied in February (P < .05).
December urine application
For the December urine application treatments, the greatest amount of drainage occurred from the flood irrigation treatments, with 461 mm of drainage under the PRGWC forage and 373 mm of drainage under the PRGWC + Plantain forage (A). Under the rotorainer irrigation treatment, the amount of drainage from the PRGWC forage (387 mm) was greater (P < .05) than the amount of drainage from the PRGWC + Plantain forage (302 mm) (A).
February urine application
For the February urine application treatments, the greatest amount of drainage occurred from the flood irrigation treatments, with 439 mm of drainage under the PRGWC forage and 328 mm of drainage under the PRGWC + Plantain forage (B). The amount of drainage under the PRGWC forage was greater (P < .05) than the amount of drainage under the PRGWC + Plantain forage for pivot (46%), rotorainer (35%) and flood (34%) irrigation treatments (B).
Nitrate concentration in drainage
December urine application
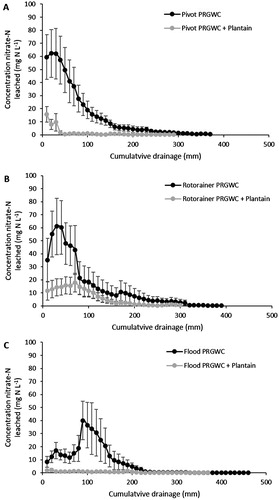
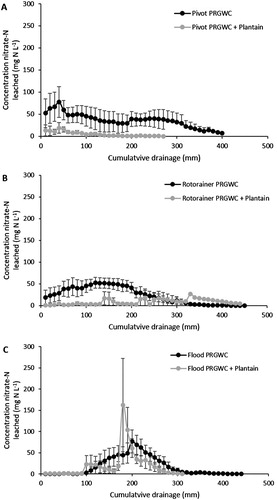
Following the December urine application, the peak NO3−–N concentrations in drainage water occurred under the PRGWC forage at 62 mg NO3−–N L−1 (pivot irrigation), 62 mg NO3−–N L−1 (rotorainer irrigation) and 40 mg NO3−–N L−1 (flood irrigation) (). The peak NO3−–N concentrations in drainage water under the PRGWC + Plantain forage remained below 16 mg NO3−–N L−1 for all irrigation treatments ().
Figure 4. Concentrations of NO3−–N (mg L−1) in drainage following the December urine application as affected by pivot irrigation (A), rotorainer irrigation (B), and flood irrigation (C). Note: Errors bars are ± SEM.
February urine application
Following the February urine application, the peak NO3−–N concentrations in drainage water occurred under the PRGWC forage at 78 mg NO3−–N L−1 (pivot irrigation), 52 mg NO3−–N L−1 (rotorainer irrigation) and 61 mg NO3−–N L−1 (flood irrigation) (). The peak NO3−–N concentrations in drainage water occurred under the PRGWC + Plantain at 16 mg NO3−–N L−1 (pivot irrigation), 27 mg NO3−–N L−1 (rotorainer irrigation) and 162 mg NO3−–N L−1 (flood irrigation) ().
Figure 5. Concentrations of NO3−–N (mg L−1) in drainage following the February urine application as affected by pivot irrigation (A), rotorainer irrigation (B), and flood irrigation (C). Note: Errors bars are ± SEM.
Total nitrate and ammonium leaching losses
Averaged across all treatments, forage type had a highly significant effect (P < .001) on NO3−–N leaching losses. The NO3−–N leaching losses from the PRGWC + Plantain forage were 82% less than the PRGWC forage when urine was applied in December and 74% less when urine was applied in February (P < .05). Averaged across all treatments, NO3−–N leaching losses were significantly (P = .002) affected by urine application month. The NO3−–N leaching losses from urine applied in December were 69% (PRGWC + Plantain forage) lower than NO3−–N leaching losses from urine applied in February (P < .05). The different irrigation types had no significant (P = .338) effect on NO3−–N leaching losses.
December urine application
Following the December urine application, the greatest amount of NO3−–N was leached from the PRGWC forage, and ranged from 37 to 50 kg NO3−–N ha−1 under the three irrigation treatments. Nitrate leaching losses from the PRGWC + Plantain forage were below 20 kg NO3−–N ha−1 for all irrigation treatments (A). Nitrate leaching losses from the PRGWC + Plantain forage treatment were less than (P < .05) from the PRGWC forage treatment. The NO3−–N leaching losses from the PRGWC + Plantain forage were 92% (flood irrigation), 67% (rotorainer irrigation) and 93% (pivot irrigation) lower than the NO3−–N leaching losses from the PRGWC forage (A). Ammonium leaching losses were below 8 kg NH4+–N ha−1 for all irrigation treatments (data not shown).
Figure 6. Total NO3−–N leached (kg ha−1) from lysimeters as affected by forage type (PRGWC vs. PRGWC + Plantain), irrigation (pivot vs. rotorainer vs. flood), and urine application date (December (A) and February (B)). Note: Error bars are ± SEM.
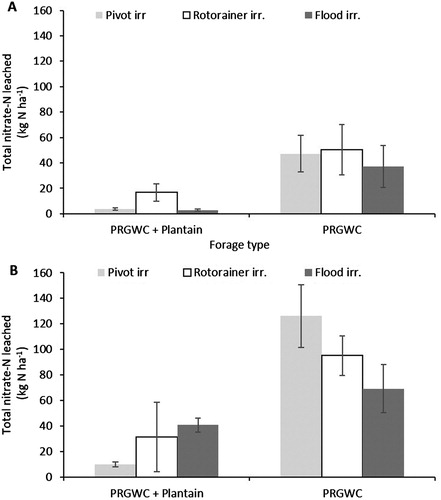
February urine application
Following the February urine application, the greatest amount of NO3−–N was leached from the PRGWC forage, and ranged from 69 to 126 kg NO3−–N ha−1 under the three irrigation treatments. Nitrate leaching losses from the PRGWC + Plantain forage ranged from 10 to 41 kg NO3−–N ha−1 under the three irrigation treatments (B). Nitrate leaching losses from the PRGWC + Plantain forage treatments were significantly (P < .05) lower than those from the PRGWC forage treatments. The NO3−–N leaching losses from the PRGWC + Plantain forage were 40% (flood irrigation), 67% (rotorainer irrigation) and 92% (pivot irrigation) lower than those from the PRGWC forage (B). Ammonium leaching losses were below 9 kg NH4+–N ha−1 for all irrigation treatments.
Total herbage DM yield and N uptake
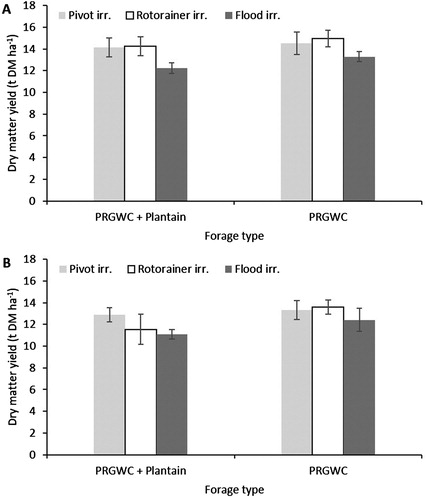
Averaged across all irrigation treatments, the total herbage DM yield (t DM ha−1) was affected (P < .001) by urine application month. The DM yield from urine applied in December was 14% (PRGWC + Plantain forage) and 9% (PRGWC forage) greater than the DM yield from the February applied urine (P < .05) (A,B). Averaged across all treatments, the total herbage DM was affected (P = .010) by forage type. The different irrigation types had no effect (P = .102) on DM yield.
Figure 7. Total DM yield (t DM ha−1) from lysimeters as affected by forage type (PRGWC vs. PRGWC + Plantain), irrigation (pivot vs. rotorainer vs. flood), and urine application date (December (A) and February (B)). Note: Error bars are ± SEM.
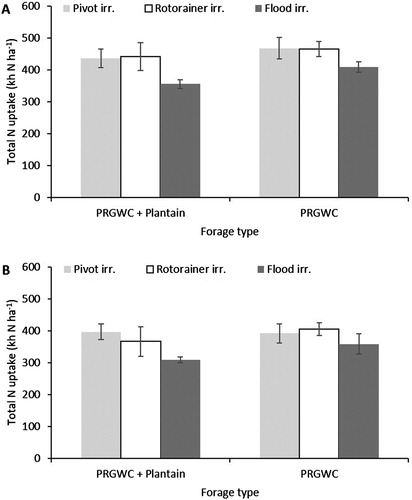
Averaged across all treatments, the total N uptake (kg N ha−1) was affected (P < .001) by urine application month. The N uptake from urine applied in December was 15% (PRGWC + Plantain forage) and 16% (PRGWC forage) greater than from the February applied urine (P < .05) (A,B). Averaged across all treatments, the total herbage N uptake was affected (P = .021) by forage type, but not by irrigation type.
Figure 8. Total N uptake (kg N ha1) from lysimeters as affected by forage type (PRGWC vs. PRGWC + Plantain), irrigation (pivot vs. rotorainer vs. flood), and urine application date (December (A) and February (B)). Note: Error bars are ± SEM.
December urine application
Following the December urine application, the total herbage DM yield and N uptake ranged from 13.3 to 14.9 t DM ha−1 and 408–466 kg N ha−1 (PRGWC forage) compared with 12.2–14.2 t DM ha−1 and 355–441 kg N ha−1 (PRGWC + Plantain forage) (A and A). There was no significant difference in herbage DM yield and N uptake between irrigation treatments.
February urine application
Following the February urine application, the total herbage DM yield and N uptake ranged from 12.4 to 13.6 t DM ha−1 and 358–405 kg N ha−1 (PRGWC forage) compared with 11.1–12.8 t DM ha−1 and 308–397 kg N ha−1 (PRGWC + Plantain forage) (B and B). Under the PRGWC + Plantain forage, N uptake was greater under the pivot irrigation treatment compared with the flood irrigation treatment (P < .05). There was no significant difference in herbage DM yield between irrigation treatments.
Soil ammonium and nitrate concentration
Because there was no effect (P = .338) of irrigation type on NO3−–N leaching losses, the soil data were combined to examine the effect of forage type on soil nitrate, ammonium and AOB/AOA data. The peak soil NH4+–N concentration occurred on day 1 for both the PRGWC + Plantain (354 mg N kg soil−1) and the PRGWC forage (376 mg N kg soil−1), and gradually decreased over time (A). Averaged across all urine treatments, the soil NH4+–N concentration was affected by forage type on days 7 (P = .006), 14 (P = .011) and 30 (P = .042). The soil NH4+–N concentration under the PRGWC forage was 30% (day 7), 39% (day 14) and 57% (day 30) lower than under the PRGWC + Plantain forage (P < .05) (A).
Figure 9. Mean ammonium–N concentrations (mg N kg soil−1) (A), nitrate–N concentrations (mg N kg soil−1) (B), AOB amoA abundance (copy numbers g−1 soil) (C) and AOA amoA abundance (copy numbers g−1 soil) (D) in the soil as affected by forage type for the urine only treatments. Note: Error bars are ± SEM.
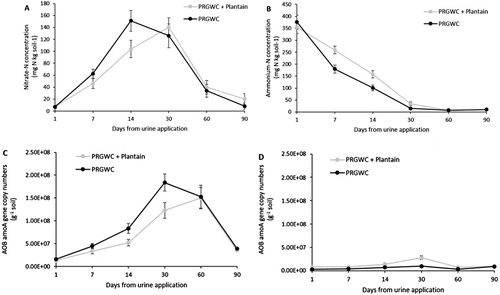
The peak soil NO3−–N concentration occurred on day 14 under the PRGWC forage (151 mg N kg soil−1) but not until day 30 under the PRGWC + Plantain forage (140 mg N kg soil−1) (B). Averaged across all urine treatments, the soil NO3−–N concentration was affected by forage type on days 14 (P = .028) and 90 (P = .030). The soil NO3−–N concentration under the PRGWC + Plantain forage was 32% (day 14) lower than that under the PRGWC forage (P < .05) (B).
Soil AOB and AOA abundance
The peak in AOB amoA gene abundance for all urine treatments occurred on day 30 under the PRGWC forage (1.8 × 10⁸ copies g−1 soil) and day 60 under the PRGWC + Plantain forage (1.5 × 10⁸ copies g−1 soil) (C). Averaged across all urine treatments, the AOB amoA gene abundance was affected by forage type on day 30 (P = .005). The AOB amoA gene abundance under the PRGWC + Plantain forage was 33% (day 30) lower than under the PRGWC forage (P < .05) (C).
The peak in AOA amoA gene abundance for all urine treatments occurred on day 30 under both the PRGWC forage (1.0 × 10⁷ copies g−1 soil) and the PRGWC + Plantain forage (2.8 × 10⁷ copies g−1 soil) (D). The AOA amoA gene abundance under the PRGWC + Plantain forage was greater than under the PRGWC forage on days 1, 7, 14, 30 and 60 (P < .05) (D).
Discussion
The results from this experiment show that NO3− leaching losses from the PRGWC + Plantain forage were 82% less than the PRGWC forage when urine was applied in December (early summer) and 74% less when urine was applied in February (late summer). The type of irrigation system used had no significant effect on NO3− leaching losses from either the PRGWC or PRGWC + Plantain forage types grown on this Paparua fine sandy loam.
The total volume of drainage under the PRGWC + Plantain forage was markedly less than that under the PRGWC forage. The lower drainage volumes under the PRGWC + Plantain forage may be the result of greater water uptake by the plantain. For example, under optimum irrigation, Neal et al. (Citation2011) found that plantain had a higher total water use (1,173 vs. 956 mm) and lower water use efficiency (13.6 vs. 16.3 kg ha−1 mm−1) compared with perennial ryegrass when grown in a monoculture.
Averaged across all treatments, the herbage DM yield and herbage N uptake from the PRGWC + Plantain forage was lower than the PRGWC forage. This contrasts with the results reported by Goh and Bruce (Citation2005), Nobilly et al. (Citation2013), Woodward et al. (Citation2013), and Malcolm et al. (Citation2014) who found no difference or higher DM yields from diverse forages compared with a standard perennial ryegrass and white clover forage. In these earlier studies, the number of different plant species in the diverse forage ranged from 4 to 17 whereas only three plant species (perennial ryegrass, white clover and plantain) were used in this experiment. These results suggest that the type of plant species used, rather than the number of species present in the forage, is more important in reducing NO3− leaching losses. This is because, while the DM yield and N uptake was greater from the PRGWC forage, NO3− leaching losses were also significantly greater from the PRGWC forage than the PRGWC + Plantain forage.
Despite the peak in NO3−-N concentration occurring under flood irrigation (possibly due to macropore flow), the flood irrigation did not result in significantly greater total NO3− leaching than the pivot and rotorainer irrigation. This was unexpected and differed from the findings of Daudén et al. (Citation2004) who observed greater NO3−–N leaching losses under flood irrigation systems. However, in the Daudén et al.’s (Citation2004) study, the total amount of water applied under flood irrigation was double that applied under the spray irrigation treatments. By contrast, in this experiment there was only a small difference in the total amount of irrigation water applied between the pivot (422 mm), rotorainer (468 mm) and flood (555 mm) irrigation treatments.
Irrigation type also had no significant effect on herbage DM yield and N uptake for both forage types. Similar results were reported by Uçan et al. (Citation2007) who found that irrigation frequency (7, 14 or 21 days) had no significant effect on sesame (Sesamum indicum L.) seed yield. These results suggest that if an optimum amount of water is applied over the season, which meets plant requirements, the irrigation system used should have no significant effect on NO3− leaching losses, herbage DM yield and herbage N uptake for both PRGWC and PRGWC + Plantain forages. Furthermore, these results demonstrate that PRGWC + Plantain forages containing plantain are able to perform well under a range of irrigation types used in New Zealand. However, it is important to note that this experiment was carried out on one soil only (a Paparua fine sandy loam soil). It is possible that results would vary depending on soil type.
The December (early summer) urine application resulted in a greater herbage DM yield and herbage N uptake than the February (late summer) urine application date, for both forage types. The amount of NO3− leached from the December urine application was similar to that reported by Decau et al. (Citation2003), Stout (Citation2003) and Decau et al. (Citation2004) for summer deposited urine under irrigation. However, the NO3− leaching losses from both the December and February urine applications were low compared with those typically reported from autumn deposited urine (Selbie et al. Citation2015). Irrigation, when applied at an optimum rate, may therefore be useful in capturing N during the late summer period, by enhanced forage growth, potentially leading to lower NO3− leaching losses over the winter period.
The lower NO3−–N concentrations under the PRGWC + Plantain forage were attributed to the release of biological nitrification inhibitor compounds (BNIs) into the soil by the plantain. Other studies have also observed biological nitrification inhibition in the presence of plantain, or plantain derived compounds such as aucubin; however, these studies were all associated with low N environments (Rauber et al. Citation2008; Dietz et al. Citation2013; Massaccesi et al. Citation2015). The lower NO3− leaching losses observed under the PRGWC + Plantain forage in this experiment may therefore be attributed to an initial reduction in the soil NO3−–N concentration resulting from the release of BNI substances into the soil by plantain. This has been demonstrated in studies using commercial nitrification inhibitors, such as dicyandiamide, where the application of a nitrification inhibitor has resulted in significant reductions in NO3− leaching losses from cow urine (Di & Cameron Citation2002b, Citation2007, Citation2012; Di et al. Citation2010).
It is well known that ammonia oxidising bacteria (AOB) abundance can increase in soils treated with high levels of N (Di et al. Citation2009; Jia & Conrad Citation2009; Verhamme et al. Citation2011; Taylor et al. Citation2012). This experiment found that AOB were also the main mediators of nitrification. Although both AOA and AOB were detected in large numbers, it was only the AOB abundance that increased in response to urine application, and the growth rate was inhibited in the PRGWC + Plantain forage soil compared with that in the PRGWC forage soil. The lack of a major response in AOA abundance following the urine application suggest their minor role in nitrification in this high-N soil environment. This is in agreement with Di et al. (Citation2009) who found that the number of AOB increased 3.2–10.4 fold in response to the application of urinary–N. It was also found that AOA abundance was suppressed when urinary–N was applied. This suggests that AOA and AOB prefer different soil N conditions to grow. Similar results were observed by Di et al. (Citation2009), Di et al. (Citation2010), Di et al. (Citation2014), O’Callaghan et al. (Citation2010) and Parfitt et al. (Citation2012).
The results from this experiment showed that AOB abundance (day 30) under the PRGWC + Plantain forage was 33% lower than the PRGWC forage following urine application. Consequently, the soil NH4+–N concentrations remained higher under the PRGWC + Plantain forage while soil NO3−–N concentrations were initially lower.
It has been suggested that plantain has the ability to release nitrification inhibiting root exudates which has resulted in BNI occurring (Rauber et al. Citation2008; Dietz et al. Citation2013; Massaccesi et al. Citation2015). The results from this experiment support such a hypothesis. Similar trends were observed by Dietz et al. (Citation2013), who found that adding fresh plantain residues to soil resulted in lower NO3−–N accumulation (days 14–28) and higher NH4+–N accumulation (days 1–14) compared with the control treatments.
The results from this experiment also show that nitrification inhibition can occur under PRGWC + Plantain forages when the forage contains 20–30% plantain. Massaccesi et al. (Citation2015) observed significantly lower NO3−–N concentrations, and nitrification rates under plantain compared with two other grassland species (Anthoxanthum odoratum and Lotus corniculatus). Massaccesi et al. (Citation2015) also found that, as the proportion of plantain in the sward increased, the rate of nitrification decreased. This suggests that the proportion of plantain in a PRGWC + Plantain forage is an important factor to consider when evaluating PRGWC + Plantain forages as an option to mitigate N loss in grazed forage systems. Additionally, the age of the forage is reported to affect the rate at which nitrification inhibition occurs, with greater nitrification inhibition occurring under older plants (Zakir et al. Citation2008; Subbarao et al. Citation2012). The PRGWC + Plantain forage used in this experiment had been established for two years at the time of soil block collection. It is therefore possible that, as the plants mature, a greater degree of nitrification inhibition may be observed.
The lower NO3− leaching losses observed under the PRGWC + Plantain forage in this experiment are therefore attributed to a combination of lower drainage volume plus a BNI effect caused by plantain.
Further research is needed to determine the proportion of plantain in the perennial ryegrass and white clover forage where BNI will have a significant effect on NO3− leaching losses. Further research to identify the compounds responsible for BNI in PRGWC + Plantain forages is also required.
Conclusions
The main conclusions from this experiment are:
Nitrate leaching losses were lower under the PRGWC + Plantain forage compared with the PRGWC forage.
Lower NO3− leaching losses under the PRGWC + Plantain forage were attributed to a combination of nitrification inhibition by BNI released from plantain and a lower drainage under the PRGWC + Plantain forage.
AOB abundance was lower under the PRGWC + Plantain forage compared with the PRGWC forage. Consequently, soil NH4+–N concentrations remained greater under the PRGWC + Plantain forage while the soil NO3−–N concentration was lower.
Lower soil NO3−–N concentrations under the PRGWC + Plantain forage were attributed to the potential release of BNI compounds into the soil by the plantain.
Irrigation type had no effect on herbage DM yield, herbage N uptake and NO3− leaching losses under PRGWC + Plantain and PRGWC forage types.
These results demonstrate the potential for PRGWC + Plantain forages to mitigate NO3− leaching losses from cow urine patches.
Acknowledgements
The authors thank Trevor Hendry, Roger Atkinson, Nigel Beale, Neil Smith, and Jie Lei for technical support.
Disclosure statement
No potential conflict of interest was reported by the authors.
Additional information
Funding
References
- Agriseeds Ltd. 2013. Trojan perennial ryegrass technical manual. Canterbury (New Zealand): Agriseeds.
- Bathurst N. 1952. The amino-acids of sheep and cow urine. The Journal of Agricultural Science. 42:476–478. doi: 10.1017/S0021859600057385
- Box LA, Edwards GR, Bryant RH. 2016. Milk production and urinary nitrogen excretion of dairy cows grazing perennial ryegrass-white clover and pure plantain pastures. Proceedings of the New Zealand Society of Animal Production. 76:28–31.
- Cameron K, Di H, Moir J. 2013. Nitrogen losses from the soil/plant system: a review. Annals of Applied Biology. 162:145–173. doi: 10.1111/aab.12014
- Cameron KC, Smith N, McLay C, Fraser PM, McPherson R, Harrison D, Harbottle P. 1992. Lysimeters without edge flow: an improved design and sampling procedure. Soil Science Society of America Journal. 56:1625–1628. doi: 10.2136/sssaj1992.03615995005600050048x
- Daudén A, Quílez D, Vera MV. 2004. Pig slurry application and irrigation effects on nitrate leaching in Mediterranean soil lysimeters. Journal of Environmental Quality. 33:2290–2295. doi: 10.2134/jeq2004.2290
- Decau ML, Simon JC, Jacquet A. 2003. Fate of urine nitrogen in three soils throughout a grazing season. Journal of Environmental Quality. 32:1405–1413. doi: 10.2134/jeq2003.1405
- Decau ML, Simon JC, Jacquet A. 2004. Nitrate leaching under grassland as affected by mineral nitrogen fertilization and cattle urine. Journal of Environmental Quality. 33:637–644. doi: 10.2134/jeq2004.6370
- Di H, Cameron K. 2002a. Nitrate leaching in temperate agroecosystems: sources, factors and mitigating strategies. Nutrient Cycling in Agroecosystems. 64:237–256. doi: 10.1023/A:1021471531188
- Di H, Cameron K. 2002b. The use of a nitrification inhibitor, dicyandiamide (DCD), to decrease nitrate leaching and nitrous oxide emissions in a simulated grazed and irrigated grassland. Soil Use and Management. 18:395–403. doi: 10.1111/j.1475-2743.2002.tb00258.x
- Di H, Cameron K, Shen JP, Winefield C, O’Callaghan M, Bowatte S, He J. 2009. Nitrification driven by bacteria and not archaea in nitrogen-rich grassland soils. Nature Geoscience. 2:621–624. doi: 10.1038/ngeo613
- Di HJ, Cameron KC. 2007. Nitrate leaching losses and pasture yields as affected by different rates of animal urine nitrogen returns and application of a nitrification inhibitor – a lysimeter study. Nutrient Cycling in Agroecosystems. 79:281–290. doi: 10.1007/s10705-007-9115-5
- Di HJ, Cameron KC. 2012. How does the application of different nitrification inhibitors affect nitrous oxide emissions and nitrate leaching from cow urine in grazed pastures? Soil Use and Management. 28:54–61. doi: 10.1111/j.1475-2743.2011.00373.x
- Di HJ, Cameron KC, Podolyan A, Robinson A. 2014. Effect of soil moisture status and a nitrification inhibitor, dicyandiamide, on ammonia oxidizer and denitrifier growth and nitrous oxide emissions in a grassland soil. Soil Biology and Biochemistry. 73:59–68. doi: 10.1016/j.soilbio.2014.02.011
- Di HJ, Cameron KC, Shen JP, Winefield CS, O'Callaghan M, Bowatte S, He JZ. 2010. Ammonia-oxidizing bacteria and archaea grow under contrasting soil nitrogen conditions. FEMS Microbiology Ecology. 72:386–394. doi: 10.1111/j.1574-6941.2010.00861.x
- Dietz M, Machill S, Hoffmann HC, Schmidtke K. 2013. Inhibitory effects of Plantago lanceolata L. on soil N mineralization. Plant and Soil. 368:445–458. doi: 10.1007/s11104-012-1524-9
- Edwards G, Bryant R, Smith N, Hague H, Taylor S, Ferris A, Farrell L. 2015. Milk production and urination behaviour of dairy cows grazing diverse and simple pastures. Proceedings of the New Zealand Society of Animal Production. 75:79–83.
- Francis CA, Roberts KJ, Beman JM, Santoro AE, Oakley BB. 2005. Ubiquity and diversity of ammonia-oxidizing archaea in water columns and sediments of the ocean. Proceedings of the National Academy of Sciences of the United States of America. 102:14683–14688. doi: 10.1073/pnas.0506625102
- Gal C, Frenzel W, Möller J. 2004. Re-examination of the cadmium reduction method and optimisation of conditions for the determination of nitrate by flow injection analysis. Microchimica Acta. 146:155–164. doi: 10.1007/s00604-004-0193-7
- Goh KM, Bruce GE. 2005. Comparison of biomass production and biological nitrogen fixation of multi-species pastures (mixed herb leys) with perennial ryegrass-white clover pasture with and without irrigation in Canterbury, New Zealand. Agriculture, Ecosystems & Environment. 110:230–240. doi: 10.1016/j.agee.2005.04.005
- Hewitt A. 2010. New Zealand soil classification. Lincoln: Manaaki Whenua Press-Landcare Research New Zealand.
- Hornek R, Pommerening-Röser A, Koops H-P, Farnleitner AH, Kreuzinger N, Kirschner A, Mach RL. 2006. Primers containing universal bases reduce multiple amoA gene specific DGGE band patterns when analysing the diversity of beta-ammonia oxidizers in the environment. Journal of Microbiological Methods. 66:147–155. doi: 10.1016/j.mimet.2005.11.001
- Hydroservices Ltd. 2014. Irrigation management & soil and water resource consultants, Davoren A., editor. Christchurch (New Zealand).
- Jia Z, Conrad R. 2009. Bacteria rather than archaea dominate microbial ammonia oxidation in an agricultural soil. Environmental Microbiology. 11:1658–1671. doi: 10.1111/j.1462-2920.2009.01891.x
- Keeney DR, Nelson DW. 1982. Nitrogen-inorganic forms. In: Page AL, Miller RH, Keeney DR, editors. Methods of soil analysis part 2. Chemical and microbiological properties. 2nd ed. Madison, Wisconsin: American Society of Agronomy; p. 643–709.
- Malcolm B, Cameron K, Di H, Edwards G, Moir J. 2014. The effect of four different pasture species compositions on nitrate leaching losses under high N loading. Soil Use and Management. 30:58–68. doi: 10.1111/sum.12101
- Massaccesi L, Bardgett RD, Agnelli A, Ostle N, Wilby A, Orwin KH. 2015. Impact of plant species evenness, dominant species identity and spatial arrangement on the structure and functioning of soil microbial communities in a model grassland. Oecologia. 177:747–759. doi: 10.1007/s00442-014-3135-z
- Neal J, Fulkerson W, Sutton B. 2011. Differences in water-use efficiency among perennial forages used by the dairy industry under optimum and deficit irrigation. Irrigation Science. 29:213–232.
- Nobilly F, Bryant R, McKenzie B, Edwards G. 2013. Productivity of rotationally grazed simple and diverse pasture mixtures under irrigation in Canterbury. Proceedings of the New Zealand Grassland Association. 75:165–172.
- O’Callaghan M, Gerard EM, Carter PE, Lardner R, Sarathchandra U, Burch G, Ghani A, Bell N. 2010. Effect of the nitrification inhibitor dicyandiamide (DCD) on microbial communities in a pasture soil amended with bovine urine. Soil Biology and Biochemistry. 42:1425–1436. doi: 10.1016/j.soilbio.2010.05.003
- Parfitt R, Couper J, Parkinson R, Schon N, Stevenson B. 2012. Effect of nitrogen fertilizer on nitrogen pools and soil communities under grazed pastures. New Zealand Journal of Agricultural Research. 55:217–233. doi: 10.1080/00288233.2012.670118
- Rauber R, Liebenau S, Friedrichs E, Schmidtke K. 2008. Agronomic effects of underseeding ribwort plantain (Plantago lanceolata L.) in organically grown potatoes. Pflanzenbauwiss. 12:32–40.
- Selbie DR, Buckthought LE, Shepherd MA. 2015. Chapter four – the challenge of the urine patch for managing nitrogen in grazed pasture systems. Advances in Agronomy. 129:229–292. doi: 10.1016/bs.agron.2014.09.004
- Soil Survey Staff. 2014. Keys to soil taxonomy. Washington (DC): USDA-Natural Resources Conservation Service.
- Stout WL. 2003. Effect of urine volume on nitrate leaching in the northeast USA. Nutrient Cycling in Agroecosystems. 67:197–203. doi: 10.1023/A:1025565502043
- Subbarao G, Sahrawat K, Nakahara K, Ishikawa T, Kishii M, Rao I, Hash C, George T, Srinivasa Rao P, Nardi P, et al. 2012. Chapter six – Biological nitrification inhibition – a novel strategy to regulate nitrification in agricultural systems. Advances in Agronomy. 114:249–302. doi: 10.1016/B978-0-12-394275-3.00001-8
- Taylor AE, Zeglin LH, Wanzek TA, Myrold DD, Bottomley PJ. 2012. Dynamics of ammonia-oxidizing archaea and bacteria populations and contributions to soil nitrification potentials. The ISME Journal. 6:2024–2032. doi: 10.1038/ismej.2012.51
- Totty VK, Greenwood SL, Bryant RH, Edwards GR. 2013. Nitrogen partitioning and milk production of dairy cows grazing simple and diverse pastures. Journal of Dairy Science. 96:141–149. doi: 10.3168/jds.2012-5504
- Uçan K, Kıllı F, Gençoğlan C, Merdun H. 2007. Effect of irrigation frequency and amount on water use efficiency and yield of sesame (Sesamum indicum L.) under field conditions. Field Crops Research. 101:249–258. doi: 10.1016/j.fcr.2006.11.011
- Verhamme DT, Prosser JI, Nicol GW. 2011. Ammonia concentration determines differential growth of ammonia-oxidising archaea and bacteria in soil microcosms. The ISME Journal. 5:1067–1071. doi: 10.1038/ismej.2010.191
- Woodward SL, Waugh CD, Roach CG, Fynn D, Phillips J. 2013. Are diverse species mixtures better pastures for dairy farming? Proceedings of the New Zealand Grassland Association. 75:79–84.
- Woodward SL, Waghorne GC, Bryant MA, Benton A. 2012. Can diverse pasture mixtures reduce nitrogen losses? Proceedings of the 5th Australasian dairy science symposium. p. 463–464.
- Zakir HAKM, Subbarao GV, Pearse SJ, Gopalakrishnan S, Ito O, Ishikawa T, Kawano N, Nakahara K, Yoshihashi T, Ono H, Yoshida M. 2008. Detection, isolation and characterization of a root-exuded compound, methyl 3-(4-hydroxyphenyl) propionate, responsible for biological nitrification inhibition by sorghum (Sorghum bicolor). New Phytologist. 180:442–451. doi: 10.1111/j.1469-8137.2008.02576.x