
 ?Mathematical formulae have been encoded as MathML and are displayed in this HTML version using MathJax in order to improve their display. Uncheck the box to turn MathJax off. This feature requires Javascript. Click on a formula to zoom.
ABSTRACT
Environment Southland is setting water quality limits in Southland, New Zealand. It has been well-documented that restrictions on nutrient losses from dairy farms are likely to negatively impact on farm profitability. Less understood is the influence of these regulations on rural land values. Dairy land values have traditionally been driven, in part, by changes in profitability expectations, although lags exist. Therefore, there is a risk that the costs of implementing water quality limits will impact on rural land values. Farm systems modelling was used to investigate the cost of reducing nutrient losses. Present valuation methodology was then used to examine the potential impact of this cost on dairy farm land values. Results show that mitigating nutrient losses from dairy farms in Southland reduces operating profit, resulting in a reduction of land value. Modelling suggests a 20% reduction in nitrogen leaching reduced operating profit by 14% and land value by 17%. The 25th and 75th percentile for the reduction in operating profit was −17.2% and −10.5% respectively. The 25th and 75th percentile for the reduction in land value was −21.5% and −13.1% respectively.
Introduction
In New Zealand, the Resource Management Act 1991 (the RMA) is the primary framework for freshwater management. The RMA is intended to manage the effects of human activities on natural and physical resources through developing and implementing national policies that guide or mandate regional and local authority resource management plans (Rouse and Norton Citation2017). The National Policy Statement – Freshwater Management (NPS-FM), requires regional authorities to set objectives, and associated limits to resource use, both for water quantity and quality, including setting limits on nutrient losses from agricultural land. Section 32 of the RMA obliges regional councils to endeavour to understand the costs of regulating nutrient losses for farmers. However, to date these analyses have largely excluded the impact on rural land values.
In the Southland region, the regional council, Environment Southland is currently addressing the NPS-FM through the Proposed Southland Water and Land Plan which provides some rules such as preparing a farm environment plan, fencing cattle out of waterways and winter crop areas. This proposed plan does not yet set regulations on nutrient losses from agricultural land. Therefore, this research uses percentage reductions of nutrient losses based Moran et al. (Citation2017).
In New Zealand, most, non-mountainous water bodies have ‘experienced some degree of negative impact by development, mostly agriculture in origin’ (Gluckman Citation2017, p. 30). Excess nitrogen (N) and phosphorus (P) in many freshwater bodies have contributed to water quality declines (Gluckman, Citation2017). Consequently, reducing or placing limits on these nutrients is seen as a key method to improving the management of cumulative effects of land use in New Zealand catchments. Both N and P losses to water can be mitigated through a range of on-farm, edge of field and catchment scale actions. This research focuses on on-farm management changes, a group of mitigation strategies which will have differing costs and effectiveness based on the farm and underlying typology in which they are applied. Mitigation of nutrient losses is frequently grouped into three main on-farm categories; changes in land management practices, reductions in land use intensity, and land use change. On dairy farms, N leaching mitigation strategies are closely linked to production while P loss mitigations can be considered semi-independent of production (Anastasiadis et al. Citation2012). As mitigation strategies are seldom undertaken in isolation, each must be considered in a whole farm context.
In a financial sense, agricultural land is an asset and its value is linked to its ability to generate a return through agriculture production (Falk Citation1991; Allan and Kerr Citation2014). However, rural land value has been shown to exceed the present value of its ability to generate a return (Pope and Goodwin Citation1984; Borchers et al. Citation2014). Rural land values are also thought to be influenced by the expected performance of the asset in the future, often termed the option or speculative value. This additional value may arise through the ability for conversion to a use which will provide a higher agricultural return (Henderson and Moore Citation2006) or through subdivision to urban use (Plantinga et al. Citation2002). Studies such as Borchers et al. (Citation2014) and Bastian et al. (Citation2002) showed a positive relationship between rural land values and amenity features such as schools, recreational facilities and natural amenities.
Allan and Kerr (Citation2014) examined the effect on rural land uses from a permanent shock to profitability, and found that these shocks are likely to initiate land use change. Shocks to profitability and land use change can be both positive and negative, though over the long-term markets often adjust to a new equilibrium. This supports the hypothesis that a nutrient loss limit imposed on dairy farms that reduces profitability, could have a negative impact on rural land values, particularly in the short-term as the market adjusts.
Studies which examine how environmental legislation has negatively affected rural land values include Holway and Burby (Citation1990) who found that development restrictions reduced the value of land parcels with undesirable development characteristics. Similarly, Henneberry and Barrows (Citation1990) and Vaillancourt and Monty (Citation1985) supported the idea that restrictions are likely to negatively impact land values. However, Henneberry and Barrows (Citation1990) further observed that there could be a spatial effect based on revised preferences and the availability of preferred characteristics.
Jaeger (Citation2006) examines the concept of regulation affecting land values more broadly than a specific policy. He suggests that regulation can be positive or negative to a group of property values depending on how the regulation is enacted. Two effects that are discussed in Jaeger (Citation2006) are the amenity effect and the scarcity effect of regulation. The amenity effect can be explained as having a positive influence on land values through examples such as a property tax which collects money to invest in making a certain locality more attractive, or through controlling pollution, again making some location more desirable for a community. However, this amenity effect could also be negative if, for example, farms had less raw product going to local processors, or less money to spend on local supplies, thereby reducing their contribution to a local economy and possibly making it a less desirable place to live. The scarcity effect implies that is there is less land available for a certain activity it could in fact drive up the price of land where that activity is allowed. This is similar to the spatial effect described in Henneberry and Barrows (Citation1990) whereby land with more positive regulation relative to other properties becomes more desirable. This scarcity effect can be net positive or negative depending on how the regulation is designed.
Journeaux (Citation2015) and TelferYoung (Citation2015) examined the impact of environmental regulation on the land value of dairy farms in New Zealand. Journeaux (Citation2015) used existing studies to illustrate the impact of nutrient regulations on operating profit. He then concluded that there was a high probability that environmental regulations negatively impact rural land values, but this was not quantified. He also concluded that the speculative value of rural land, due to conversion potential (usually to more intensive land use), may be negatively influenced when there is constrained opportunity to intensify or change land use (Journeaux Citation2015). TelferYoung (Citation2015) examined the price differential for dairy farms within the Lake Rotorua catchment, with N loss regulations, compared to those outside of the Lake catchment. They concluded that where regulations were imposed, land values reduced by between 15% and 20%, depending on the land’s economic capacity (TelferYoung Citation2015). However, this study noted that there were limited sales data to use which restricted the confidence of their findings.
This study uses farm system models to estimate the economic and biophysical changes resulting from reducing N and P losses from dairy farms in Southland. It then uses a present valuation methodology to estimate how the economic impact of nutrient loss mitigation will alter the land value for these farms, Ceteris paribus.
Materials and methods
Farm system models
Farm systems modelling is used to examine how a change to one aspect of a farm system may impact the rest of the system, including biophysically, economically and environmentally. Simulation models enable complex farm system changes to be modelled and their outcomes estimated. The aim of this type of farm modelling is the construction of abatement cost curves which describe the relationship between a pollutant and the cost of mitigating it (Doole Citation2012). They have been widely used in the analysis of policies to reduce water pollution (for example, Hart and Brady Citation2002; Beaumont and Tinch Citation2004; Robotyagov et al. Citation2010). Both economic and nutrient loss changes are required to create an abatement curve, and a biophysical model is crucial to ensure feed supply and demand are balanced throughout the curve. A model does not exist in New Zealand that incorporates economic performance of a farm and nutrient pathways while also validating the biological feasibility. This study used FARMAX (version 6.6.5.00) to estimate the economic impacts of farm system management changes, while simultaneously estimating production (pasture and animal) and ensuring biological feasibility of the farm system (Bryant et al. Citation2010). Overseer® (version 6.2.0) was used to estimate nutrient losses. FARMAX was chosen over alternative models, particularly optimisation models, as it allows for consideration of heterogeneity, which is inherent in farm businesses (Doole Citation2012). Overseer® is accepted as the most robust framework for estimating the nutrient losses for New Zealand agricultural industries (Doole Citation2012). In combination, FARMAX and Overseer® have been widely used to create abatement cost curves for pastoral farming in New Zealand (for example, Kaye-Blake et al. Citation2014; Vibart et al. Citation2015).
Mitigation modelling sample
Abatement cost curves were created to examine the cost of reducing N and P loss for case study dairy farms in Southland. A selection of 41 farms were used to capture the variety of soil and rainfall types, as well as a range of farm system types and managerial ability for dairy farms. Farm data was based on the 2013–14 season (June 2013 until May 2014), although it was modified where necessary to represent a reasonably typical season, as Overseer® is designed to model a long term steady state. Overseer® files were created using the Overseer® Best Practice Data Input Standards (MPI et al. Citation2015).
Nutrient mitigation strategies
After the base farm files were created, mitigation strategies (described below) were then applied to each farm. The farms followed the same overall mitigation approach, but there were differences in the specific mitigation strategies applied to each farm due to the individual farm system characteristics. Firstly, N loss was mitigated from a baseline position, with a targeted reduction of 10%, 20%, 30% and 40%. This was repeated separately for P mitigation strategies. This range of percentage reductions was selected in the absence of existing nutrient loss regulation, and were based on the nutrient modelling in Moran et al. (Citation2017). For each mitigation option FARMAX was used to capture the economic implications. For example, when fertiliser was changed, the costs associated also changed, including purchasing and spreading costs.
These mitigation strategies are cumulative steps; each mitigation option builds upon the previous one implemented. While similar sequences of mitigation options were analysed for each farm, the final mitigations implemented on each farm was unique due to differences in the farm system characteristics. For example, the first N mitigation option was only applicable to farms with an off-pasture structure.
At each mitigation point a set of interdependent strategies were used to ensure feed supply and demand were balanced. For example, if N fertiliser is reduced, which then reduces feed supply, this cannot be presented as a mitigation without an associated change in feed demand. This assumption, that a reduction in N use reduces pasture production (to varying degrees based on response rates which varied by rate and month in the model) was based on studies which show that pasture growth and N uptake increases with added N (except in urine patches) up to rates above 400 kg N/ha/year (McGrath et al. Citation1998), It is acknowledged that the timing of N fertiliser can be change from months with low pasture and milk responses and high environmental risk (e.g. June) to months with high pasture and milk responses and low environmental risk (e.g. October), this can lead to a reduction in N loss and an increase in profit (Roberts and Morton Citation1999). However, this was not considered in this study because the case study farms did not utilise N fertiliser in such a way that made this likely. While reductions in N fertiliser are also likely to reduce greenhouse gas emissions, this is beyond the scope of this study.
A reduction in one nutrient was not permitted to increase the loss from the other nutrient because it is unlikely that policy options will include this, given the NPS-FM requires policies to maintain or improve water bodies. Mitigation modelling was stopped at 40% or when surplus pasture was produced, which implies land was not required for dairy production. While in reality pasture could be harvested and sold, the economic return of this was likely to be lower than an alternative land use, and therefore modelling was stopped. The mitigation strategies selected were based on a literature review of mitigation options, discussions with experts and farmers, and the limitations of the models to capture the effects of mitigations.
The nitrogen mitigation strategies were as follows:
Increase the use of an existing off-pasture structure (such as stand-off pads or wintering barns) where one exists.
Alter nitrogen fertiliser, including application rates and volume. The change in feed supply was balanced by reducing feed demand.
Reduce or replace feed with high N content where there are alternatives.
Cropping areas were swapped with alternative crops or reduced in area.
If there was a high risk of N leaching from effluent storage and disposal this was addressed by increasing the effluent disposal area (where suitable paddocks were available).
Stocking rates were reduced further if it did not result in land retirement and targets had not been reached.
Phosphorus mitigation strategies were as follows:
Swap superphosphate to Reactive Rock Phosphate (RPR) where appropriate, as defined from criteria described in Sinclair et al. (Citation1990).
Mine Olsen P levels to an optimum of 30 units, based on requirements described by Roberts and Morton (Citation1999). Because Overseer® models a year within a steady state, it does not capture the time taken to reduce Olsen P levels, and it also does not model any changes in pasture production that may result from reduced Olsen P levels.
Phosphate fertiliser practices were improved where applicable, by modifying application timing, rates and volume.
Cropping areas were swapped with alternative crops or reduced in area.
If there was a high risk of P loss from effluent storage and disposal this was addressed by increasing the effluent disposal area (where suitable paddocks were available).
After this once a day milking for part of the season was adopted.
Stocking rates were reduced further if it did not result in land retirement and targets had not been reached.
The cropping alterations, increases in effluent area and the reduction in stocking rates were the same when reducing nitrogen and phosphorus losses. However, once a day milking was only applied to P losses because it is not an effective N mitigation as the cows spend more time in the paddock and therefore, direct deposition via urine is higher.
Farm system modelling assumptions
The modelling assumed farmers used the least-cost method of reducing nutrient loss which is one of a number of possible methods for determining preferential mitigation options. This study did not attempt to predict or estimate alternative approaches to selecting mitigation options. In addition, it assumed that farms operated at the best of their managerial ability and could not increase profit given their current resources, technology or skills. The mitigation modelling assumed that a farmer’s managerial ability and available technology was held constant. Holding production per cow constant was used as a proxy for this assumption.
Abatement cost curves were constructed for the milking platform and support blocks combined, where they were operated as one business. Non-effective land area was also included for the Overseer® nutrient modelling. Farms who had some (or all) of their herd grazed off the milking platform in winter maintained the proportion of their herd that was grazed off in each mitigation scenario.
Standardised input prices were used which are accessible from FARMAX with a software licence. A milk price of $6.50 was used in the modelling to reflect a long-term average price and long-term expectation. Labour costs are normally a lumpy cost (Hall and Lieberman Citation2007) and, in this study, do not scale proportionately with reductions in cow numbers. Labour was treated as a fixed cost unless the number of cows milked decreased considerably. All farms had an annual cost of $5000 added to their farm expenses to represent the ongoing cost of developing some form of farm environment plan. More detail on the farm systems modelling approach is described in Muller (Citation2017).
Land value data and adjustments
Data on land value can be derived from a variety of sources, each with strengths and limitations. Often there are insufficient sales data for robust analysis. Additionally, detailed farm information for the farms that are sold is difficult to obtain. For this reason, data from DairyBase (Shadbolt Citation2009) were used. DairyBase had rateable valuations (RV) and market valuations (MV) for each farm in Southland recorded, along with detailed financial and physical information. A RV is an indicative value undertaken by district councils every three years using a mass appraisal process. In DairyBase, a MV is the RV adjusted by a factor which represents the market shifts since the last RV was conducted. Because RVs are only updated every three years, they may give an unreliable indication of a property’s current value, and therefore, for this study, the MV from DairyBase was used, with the following adjustments. The DairyBase MV was adjusted to represent only the milking platform (i.e. the support block value was removed), and to reflect the value of owned and leased land that formed the milking platform. This assumed that any land leased for the milking platform had the same value as land owned for the milking platform as these are located adjacent to each other. The MV used in this study was validated against sales data from Quotable value (Citation2015).
Productive value versus amenity value
Dairy farm land value is a function of its productive value and its amenity value. Productive value is defined as the ability of a dairy farm to provide an economic return, based on both current and expected future performance. Amenity values are defined as the features of the parcel of land not directly related to an economic return, and include factors such as houses (number and quality) and distance to urban areas. Amenity values can also include features such as vegetation, which can influence land values and nutrient loss (e.g. if used in riparian margins). While amenity values affect land values, under nutrient regulation many amenity values (e.g. houses, distance to urban areas and views) are unlikely to significantly change and therefore, were not separately considered in this study. Other amenity values that may be affected by nutrient mitigation strategies such as riparian margins were unable to be modelled in the current farm systems software and are very context specific, and therefore were also excluded from this particular study. This is consistent with previous studies, for example, the impact of these factors was not estimated in Journeaux (Citation2015).
Present valuation conceptual model
This research considers dairy farm land value as a function of its productive value (including now and option values) and its amenity value. This is in line with Allan and Kerr (Citation2014) who describe land value as rents from agricultural production as well as rents from the benefits received from the lifestyle amenities the land possesses. Nutrient regulations are likely to have a more significant impact upon the productive value of a land relative to their impact on the often-subjective amenity value of a dairy farm as nutrient loss from a farm is largely due to the use of land as a productive input. Therefore, specific consideration of amenity values was excluded from this analysis. In addition, due to data availability and scope of research, the analysis was limited to dairy farms and as such excluded the potential for land use conversions (option value).
Allan and Kerr (Citation2014) used a conceptual model of rural land values based on the present valuation model (PVM) which stipulates that the value of an asset is equal to the present value of expected future returns from asset ownership; Campbell and Shiller (Citation1987) and Falk (Citation1991) used a similar approach. The PVM was considered most applicable to the question posed in this research. The base theoretical model is presented in Equation (1).(1)
(1)
Where CVTotal,t0 is the present value of the dairy farm land per hectare, opπt0 is the current year’s operating returns from farming, f(profit capitalisation) is the expectation variable which accounts for future returns of owning the asset, a common factor in a PVM, and r is the chosen discount rate. The operating profit and capital values presented in Equation (1) are a function of land, cows and machinery. Therefore, Equation (1) was adjusted to account for the value of cows and machinery and separate the capital value of land. By assumption the total capital value (CVTotal,t0) is the sum of the individual asset classes for cows, machinery (CVCows+Mach,t0) and land (CVLand,t0) (Equation (2)).(2)
(2)
Using the average values from the sample of farms obtained from DairyBase, Equation (2) is calculated as $40,613 = $32,846 + ($6177 + $1590). A Shapiro-Wilk test was used to test the sample data for normality. The null hypothesis was that the population is normally distributed and this could not be rejected at 5% (an alpha level of 0.05). As the data were normally distributed the mean was used for further analysis.
The revised Equation (1), incorporating the assumption shown in Equation (2), is presented in Equation (3). The variables for Equation (3) are derived from the sample and the f(profit capitalisation) is back-calculated using a chosen discount rate. In this case, assumed to be 8% based on the default discount rate from the New Zealand Treasury (New Zealand Treasury Citation2015).(3)
(3)
Using the average values from the sample of farms obtained from DairyBase, and solving Equation (3), gives a capitalisation factor of 1.32.
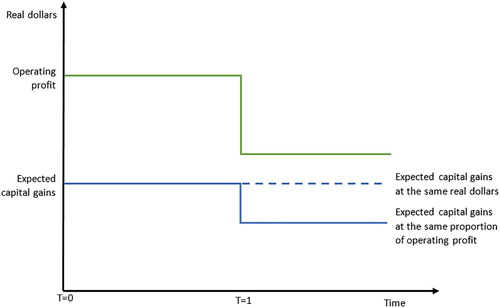
If nutrient regulation reduced operating profit then the formula could be adjusted to illustrate the impact of this nutrient regulation on land values, ceteris paribus. In addition to the assumption in Equation (2), it was assumed that expected capital gains would remain as the same proportion of operating profit. This is illustrated in Equation (4) and . While capital gains as a proportion of operating profit have varied over time, this research makes the assumption that capital gains stay at the same proportion of operating profit because the model is designed to represent pre- and post-shock states with external market drivers held constant.(4)
(4)
Figure 1. Diagrammatic representation of expected capital gains assumptions (blue line) relative to operating profit (green line), with expected capital gains being either at a constant real value (dashed blue line from T = 1) or at the same proportion of operating profit (solid blue line from T = 1).
Therefore, Equation (3) can be adjusted, to include the assumption in Equation (4), as follows:(5)
(5)
In addition to the assumptions in Equations (2) and (4), Equations (6) and (7) illustrate two further assumptions. Equation (6) describes the assumption that the values of cows and machinery will not change because they can be sold to other industries and areas. This presumes that cow values are independent of nutrient regulations and any reduction in cow values will be short lived as the market will adjust over the medium-term to meet the cost of raising young stock. The same assumption is made for the asset value of plant and machinery, with similar reasoning; that the value of machinery is independent of regulatory changes, as it may be transferred between multiple industries and regions.(6)
(6)
Equation (7) shows how nutrient regulations change operating profit in the successive time period, consistent with modelling assumptions.(7)
(7)
The land value post nutrient regulation is therefore equal to Equation (8). The change in land value can then be calculated as a percentage reduction from (CVLand,t0).(8)
(8)
These calculations show the pre and post situation with no transition period. This model also assumes that the expected capital gains are maintained at the same allowance for a proportion of operating profit, rather than at the same value in real dollar terms (). The above calculations do not account for tax of operating profit or expected capital gains. However, because expected capital gains are assumed to be the same proportion of operating profit pre and post regulation, including tax would not affect the results of this simplified capitalisation model. This capitalisation model considers dairy farms in isolation; and does not consider alternative land uses.
The capitalisation model generates point estimates for the percentage change in land values. A Monte Carlo simulation approach using @Risk (Palisade, Citation2017) was then used to provide a confidence interval that represented the likely variability in the results.
Results
While targeted nutrient loss reductions of 10%, 20%, 30% and 40% were intended, the complex nature of the inputs (farm system changes) and outputs (nutrient losses) to the models meant it was not always possible to achieve those targets exactly. Therefore, the results were interpolated where required. Additionally, while 40% was the intended upper limit, some farms were not modelled past the point where land was no longer required for dairy production. Consequently, results for each reduction level varied depending on the number of farms that could reduce nutrient loss to each point. Average results for P stopped at 20% because so few case study farms could reduce P loss by more than this level using mitigations available in Overseer®. The average mitigation costs were likely to underestimate the impact of a reduction in nutrient loss as farms are progressively excluded when they can undertake no further mitigations without creating a surplus of feed. The average curves do not capture the significant variation that exists in the mitigation costs across the case study farms and it is important to consider the range in results as well.
The average land value calculated for dairy farms in Southland for the 2012–13 season was $32,846 per effective hectare ($8233 standard deviation). QVNZ data in 2012–13 included nine dairy farm sales and had a mean of $33,624 per effective hectare. For the 2011–12, 2012–13 and 2013–14 seasons combined, it was $31,358.
shows the impact of N loss regulations on operating profit and land values. All farms could reduce N loss by 10%, which reduced operating profit by 8% per hectare and land values by 10% per hectare. It also indicates what proportion of farms could achieve that level of reduction in N loss and the standard deviations for the changes in operating profit and land values.
Table 1. Effects of modelled N regulations on dairy farm land values in Southland.
shows the impact of P loss regulations on operating profit and land values. Nearly all farms could reduce P loss by 5%, with this P loss reduction reducing operating profit per hectare by 10% and land value per hectare by 12%. Less than half of the case study farms could reduce P loss by 15%. A 15% reduction in P loss reduced operating profit by 25% per hectare and land values by 31% per hectare.
Table 2. Effects of modelled P regulations on dairy farm land values in Southland.
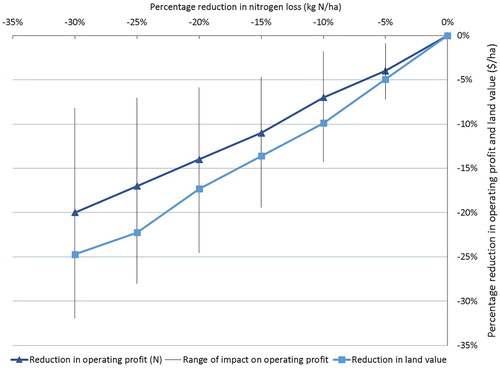
shows the impact of N loss reductions on the average operating profit and land values for the 76% of case study farms who could achieve a 30% N loss reduction. The results are surprisingly linear, while the individual abatement curves show a wide range of responsiveness, it was expected that for the average abatement curve, mitigations used to achieve large reductions in N and P loss would result in a non-linear relationship due to increasing marginal costs. This linear shape is likely due to the nature of the N mitigations used, namely the use of combined fertiliser and production changes; because the response rates to N fertiliser are constant across mitigation strategies the abatement cost is relatively constant. Once fertiliser changes are exhausted as a mitigation option, mitigations are expected to become more expensive, however, this study stopped modelling when land was likely to retired from production and therefore some of these more expensive mitigation strategies are not represented in the abatement curve in . also shows the significant range of impacts that N mitigation strategies had on the operating profit of the case study farms.
Figure 2. Impact of N loss regulation on operating profit and land value, for the 76% of modelled farms that could mitigate to a 30% reduction in N loss. Dark blue data series is the average impact of reducing N loss on operating profit. The light blue data series is the associate average impact on land values. The black bars represent the range of impacts that reducing N loss had on the operating profit of the case study farms.
Discussion
Few studies have attempted to quantify the impact of nutrient regulations on dairy farm land values in New Zealand. TelferYoung (Citation2015) concluded that there was likely to be a 15%–20% decrease on land values for dairy farms located within the Lake Rotorua catchment where N loss reductions were required relative to farms outside of the catchment. Our research found that if the N regulations in Southland reduce N leaching from a dairy farm by approximately 25%, land value was likely to reduce by approximately 22%, slightly higher than the findings in TelferYoung (Citation2015). Our research was completed prior to policy implementation, so there is no empirical evidence with which to compare the modelling for the change in land values as a result of nutrient loss regulations.
The results from the nutrient mitigation modelling part of our study showed that it was more expensive to reduce P loss from a farm system than it was to reduce N leaching using the mitigations options available in Overseer®. Overseer® does not include measures to mitigate the loss of P from many critical source areas. McDowell (Citation2007) concluded that 80% of P loss originates from 20% of the land area, particularly from critical source areas, so it is likely that there are more cost-effective mitigations for P loss that were not available in the modelling approach used in this research.
Variability in outcomes due to farm heterogeneity were estimated using a Monte Carlo simulation. From reducing 35% of N loss (which is the reduction level more than half the sample was able to achieve) the impact on operating profit for the 25th percentile and the 75th percentile were −28% and −18.6%, respectively (an interquartile range of 9.4%). The associated impact on land values from this reduction in N loss for the 25th percentile and the 75th percentile were −35.1% and −25.2%, respectively (an interquartile range of 11.9%). The interquartile ranges for P loss reductions are much larger and reflect the challenges with modelling P losses with the tools used in this research.
There is a wide range of initial farm business and environmental situations. This range means that the same percentage reduction on these farms does not necessarily equate to the same absolute reduction in N and P loss to the catchment, or the same cost. For example, a 10% reduction in N loss on one farm may equate to one 1 kg N/ha/year, and on another this may be 10 kg N/ha/year. Likewise, for the cost, a 15% reduction in operating profit may be $100/ha/year on one farm and $200/ha/year on another.
While this paper presents the economic implications of nutrient regulations on dairy farm land values, it acknowledges that this is only one part of the equation. Water quality is a complex issue and due to the scope of this paper some areas have been excluded from the discussion. It is worth noting that this paper does not discuss the broader positive and negative externalities from dairy farming and the changes in these as a result of nutrient loss mitigation. Nutrient loss mitigation is likely to have positive implications, depending on the mitigation option selected, for greenhouse gas emissions. This, along with the improvements in water quality from reducing nutrient loss, are positive effects for the wider NZ public. Further discussion on externalities from agriculture land uses and how these may change if land management practices or land use change have been considered in PCE (Citation2013, Citation2015), Kerr (Citation2016) and Wilcock et al. (Citation2008).
The nutrient mitigation modelling assumes that farmers will use the lowest cost mitigation option. This assumption does not consider all possible options farmers may adopt, with other options having a different effect on operating profit and therefore land values. For example, a farm may invest in the construction of a wintering barn to use in their farm system in a way that reduced nutrient loss, which may instigate a different relationship between nutrient loss reductions and land values than estimated in this study. For example, Journeaux and Newman (Citation2015) in a case study approach, found that depending on how the barn was integrated into the system, N loss could be reduced, however, the effect on profitability varied. While they found some anecdotal evidence of barns increasing the capital value of the farm business, it was not necessarily equivalent to the capital cost of the barn (Journeaux and Newman Citation2015).
Another assumption in this study is that each farmer operates at the best of their managerial ability. This means a farmer is operating an optimised system at their base scenario, given their level of ability. The implication of this is that farmers cannot achieve win-win scenarios. This assumption has been utilised in other farm systems modelling, including Muller (Citation2017), Neal (Citation2015) and Doole et al. (Citation2013). For example, if a farmer could reduce stocking rate and increase production without increasing inputs, this would lead to a higher return and would be a rational decision. In reality, some farmers will be able to move their production possibility frontier, however, attempting to model the frequency and magnitude of this aspect is beyond the scope of this research. Attempting to estimate how many farmers could move their production possibility frontier is fraught with uncertainty as it is unknown what the barriers are to farmers currently adopting more efficient options (such as reducing stocking rate and increasing production) and the cost to overcome these differing barriers will vary and is unknown. In contrast to this assumption, studies such as Sulzberger et al. (Citation2015) show N leaching mitigations that can increase profitability through increased efficiency of resource use. However, they also note that these were optimised solutions and therefore, may not be achievable given the farmer’s ability, skills, ideology, constraints or resources (Sulzberger et al. Citation2015). This assumption also implies that reducing nutrient loss has an economic cost. Yet while there are some scenarios where research groups are achieving reductions in nitrogen loss without reducing profitability, currently these rely on significant scientific and operational oversight, and therefore cannot be assumed to be applicable to the general population of farmers who do not have access to the same scientific and operational guidance. Changes to this assumption would reduce the impact of mitigating nutrient loss on operating profit, and thereby reduce the potential influence on land values.
The results of this modelling approach, and therefore the impact of nutrient regulations on dairy farm land values, is sensitive to profitability, which in turn is sensitive to milk price (DairyNZ Citation2014). Milk price will not only alter the affordability of mitigating nutrient loss, it will also alter on farm decisions (Shadbolt Citation2012) which may impact the nutrient losses. A farm needs enough earnings before interest and tax after mitigation to meet debt obligations, otherwise it will no longer be viable. The abatement curves developed in this study exclude interest and rent payments as well as debt servicing and drawings. Therefore, the effect of debt on the mitigation selection and associated profitability and land value, is important but unknown.
PVM is a method of valuation based on economic rationality, but farm purchases often include emotive factors. Comparing similar land sales is another way of analysing land values, however this relies on enough comparable sales data being available. This research used MVs from DairyBase to estimate the starting land value, and tested this against sales data from Quotable value to ensure robustness. The challenge with using comparable sales data in this research is twofold; one, there has to be enough sales data to ensure robustness, and two, using sales data only allows the impact of policy to be estimated after implementation. In addition to this, emotive factors and differences in amenity values are likely to be present pre and post regulation and therefore are considered to be outside of the impact of nutrient loss regulation.
Historically, the value and capital gains of dairy farm land has contributed a significant proportion to the equity position of a dairy farmer. However, many dairy farmers also carry high levels of debt. Large reductions in land value could lead to reductions in equity of dairy farmers that in some cases result in debt restructuring, forced sales or bankruptcy. In extreme examples, these flow on impacts are possibilities for some farms, and could have social implications for the wider region. An example of this was in Australia when the banking system was deregulated and many farmers did not survive the changes resulting from this structural reform (Argent Citation2011).
If regulations differ between dairy farms, land with more lenient regulations, or no regulations, could become relatively more desirable. This hypothesis is supported by Henneberry and Barrows (Citation1990) and Jaegar (Citation2006) who observed that the influence of regulation on specific property values could be positive or negative depending on how the regulation varies spatially and the availability land parcels with desirable characteristics. This has implications for the equity of regulations, for example, a particular area could have very strong regulations introduced and therefore land values could reduce more than the adjacent area. If regulation varies spatially it could also impact on the efficiency of the regulation if, for example, particular land uses congregate in low regulation areas and there is a significant and unexpected negative impact on freshwater. Further analysis should be carried out once a policy is announced to gain an understanding of the spatial impact on land values if policy differs throughout the region.
This research considered a static value of the farm in its current state, and how this would change given regulations which reduced profitability. It did not account for the possible ability of a buyer to develop and increase profitability, likewise, it did not consider the ability of new science to reduce the impact of regulations on profit. While these factors are possible, they are subject to significant uncertainty and therefore difficult to model with any confidence. In addition, how the farmer developed and increased profitability would still be constrained by the regulation, and theoretically this would still reduce land value, relative to an identical farm without regulation constraining how they can develop the land.
This study has stopped mitigation modelling when land was surplus to requirements, however, this may lead to a different farmer taking over that farm as discussed in the preceding paragraph, or it may lead to land use change. Land use change can be considered both positively and negatively. For example, land could go into a land use that has higher economic value both to the land owner and the community (e.g. for job provision) and lower environmental impacts. It was beyond the scope of this study to assume what alternative land uses may occupy land that was retired from dairy farms under the farm system modelling assumptions in this research due to the considerable uncertainty.
The impact on land values will differ based on the magnitude of mitigation required by a farm to meet limit-setting policy. This research found that the change in total capital value is smaller than the change in land value, and the reason for this is the buffering effect of cows and machinery, where values are independent of nutrient loss regulation. Asset values of cows have been seen to adjust reasonably rapidly in the short term (DairyNZ Citation2014), while machinery can be used in alternative industries.
The PVM used in this research assumes that capital gains remain at the same proportion of operating profit when operating profit changes. This assumption, in conjunction with no capital gains tax, means the impact of nutrient regulations on land values is the same if tax is included or not. However, what does change is the difference in the land appreciation rate. When tax is not included it is calculated as 2.4% above of the rate of inflation (all values are presented in real terms). If tax is included at a 30% tax rate for operating profit (but not the capital gains), this value is 1.7%.
The model created in this study uses an 8% discount rate which was the recommended discount rate (New Zealand Treasury Citation2015). While a weighted average cost of capital (WACC) would be a preferred alternative to this discount rate, calculating individual or an industry WACC is complex and hence the Treasury recommendation was used as a best proxy. A WACC would also change under the mitigation scenarios proposed due to the reduction of capital (e.g. cows) and changes in tax through changes in profitability. A sensitivity analysis for the discount rate was carried out, but because the factor of profit capitalisation is back-calculated, at different discount rates it adjusts to ensure the equation equals the land value. What does change is the proportion of returns required from capital gains relative to operating profit.
This research suggests that there will be a reduction in land values if nutrient regulations reduce operating profit on a dairy farm. The impact on land values will differ based on the magnitude of mitigation required by a farm, namely, the impact on land values will be proportionally higher at higher levels of nutrient reduction. However, if the underlying increase in land values is expected to continue (in real terms) then land values will eventually return to the same price. This research does not attempt to work out the transition pathway of the impact. If a change, such as new technology or research, increased the rate of growth of dairy farm land values, then the reduced land values will return to the pre-regulation level faster. These changes could include factors which increase expected growth in operating profit (for example, terms of trade) or research that allows farmers to mitigate nutrient loss without a reduction in operating profit (for example, new forages).
Only some areas of New Zealand currently have nutrient limits and there is not yet enough data to analyse how sale prices for dairy farms have changed. There has been anecdotal evidence quoted in media which cited increased uncertainty and cost in accessing and analysing nutrient information as new added complexities to a farm sale or purchase, indicating increased transaction costs (Doudney Citation2015; The Press Citation2015). However, this is hard to isolate as a direct result of nutrient regulation, rather than the wider economic situation.
Conclusion
This research found that, based on the assumptions made, mitigating nutrient losses from dairy farms reduced operating profit, which resulted in a reduction of land value. This percentage reduction in land value was slightly more than the percentage reduction in operating profit, based on the outlined assumptions. There was significant variation in abatement cost for the case study farms, but overall, N leaching was cheaper to reduce than P loss. This research estimates that a 20% reduction in N leaching would reduce operating profit by 14% and land value by 17%.
Dairy farm land values are likely to be negatively influenced if dairy farm profitability falls in order to meet nutrient loss limits. Therefore, it is recommended that policy makers consider the impact of nutrient regulations on land values when assessing proposed policies to meet the NPSFM.
This research contributes to the few studies that consider the impact of environmental regulations on New Zealand rural land values. It provides an initial methodology for quantification of the magnitude of change in dairy land values which might be expected from various nutrient loss restrictions. It is important however, to recognise the assumptions and limitations when extrapolating these results to the wider population.
Biophysical characteristics (soil, climate and location) are the most significant drivers of dairy farm land value and relate directly to the potential productivity capacity of a farm. Policy may need to consider how site-specific nutrient limits may impact differentially on land values.
This research is constrained by the current mitigation strategies which are able to be modelled using current tools. New mitigation strategies will continue to be developed and could present a lower cost option for reducing N and P losses. New mitigation strategies that reduce the impact of nutrient regulation on operating profit will also reduce the impact of this regulation on land values.
ORCID
Carla F. Muller http://orcid.org/0000-0002-9252-3954
Mark B. Neal http://orcid.org/0000-0002-4762-8204
Additional information
Funding
References
- Allan C, Kerr S. 2014. Examining patterns in and drivers of rural land values; [cited 2015 May 12]. Available from: http://www.nzae.org.nz/wp-content/uploads/2015/01/2014-06-19_Allan_and_Kerr_land_values_NZAE_version.pdf.
- Anastasiadis S, Kerr S, MacKay A, Roygard J., Shepherd, M. 2012. The mitigation of nutrient loss from New Zealand agriculture: separating the probable from the possible. Wellington: Motu Economic and Public Policy Research; [cited 2015 May 5] Available from: http://www.motu.org.nz/files/docs/resources/Mitigation_of_Nutrient_Loss_Anastasiadis_et_al_2012.pdf.
- Argent N. 2011. Globalisation, agriculture and development: perspectives from the Asia-Pacific. Cheltenham: Edward Elgar. Chapter 2, Australian agriculture in the global economic mosaic; p. 7–28.
- Bastian C, McLeod D, Germino M, Reiners W, Blasko B. 2002. Environmental amenities and agricultural land values: a hedonic model using geographic information systems data. Ecological Economics. 40:337–349. doi: 10.1016/S0921-8009(01)00278-6
- Beaumont NJ, Tinch R. 2004. Abatement–cost curves: a viable management tool for enabling the achievement of win-win waste reduction strategies?. Journal of Environmental Management. 71:207–215. doi: 10.1016/j.jenvman.2004.03.001
- Borchers A, Ifft J, Kuethe T. 2014. Linking the price of agricultural land to use values and amenities. American Journal of Agricultural Economics. 96:1307–1320. doi: 10.1093/ajae/aau041
- Bryant JR, Ogle G, Marshall PR, Glassey CB, Lancaster JAS, Garcıa SC, Holmes CW. 2010. Description and evaluation of the Farmax Dairy Pro decision support model. New Zealand Journal of Agricultural Research 53:13–28. doi: 10.1080/00288231003606054
- Campbell JY, Shiller RJ. 1987. Cointegration and tests of present value models. Journal of Political Economy. 95:1062–1088. doi: 10.1086/261502
- DairyNZ. 2014. DairyNZ economic survey 2012-13. Hamilton (New Zealand). 68 p. [cited 2015 Jun15]. Available from: https://www.dairynz.co.nz/media/566864/economic_survey_2012-13.pdf.
- Doole GJ. 2012. Cost-effective policies for improving water quality by reducing nitrate emissions from diverse dairy farms: an abatement–cost perspective. Agricultural Water Management. 104:10–20. doi: 10.1016/j.agwat.2011.11.007
- Doole GJ, Marsh D, Ramilan T. 2013. Evaluation of agri-environmental policies for reducing nitrate pollution from New Zealand dairy farms accounting for firm heterogeneity. Land Use Policy. 30(1):57–66. doi: 10.1016/j.landusepol.2012.02.007
- Doudney T. 2015 Sep 8. Water quality rules jeopardise farm sales. Selywn Times; p. 1
- Falk B. 1991. Formally testing the present value model of farmland prices. American Journal of Agricultural Economics. 73:1–10. doi: 10.2307/1242877
- Gluckman PD. 2017. New Zealand’s fresh waters: values, state, trends and human impacts. Auckland (New Zealand): Office of the Prime Minister’s Chief Science Advisor.
- Hall R, Lieberman M. 2007. Microeconomics: principles and applications. 4th ed. Mason (OH): Thomson South-Western.
- Hart R, Brady M. 2002. Nitrogen in the Baltic Sea: policy implications of stock effects. Journal of Environmental Management. 66:91–103. doi: 10.1006/jema.2002.0579
- Henderson J, Moore S. 2006. The capitalization of wildlife recreation income into farmland values. Journal of Agricultural and Applied Economics. 38(3), 597–610. doi: 10.1017/S1074070800022641
- Henneberry D, Barrows R. 1990. Capitalization of exclusive agricultural zoning into farmland prices. Land Economics. 66:249–258. doi: 10.2307/3146727
- Holway J, Burby R. 1990. The effects of floodplain development controls on residential land values. Land Economics. 66:259–271. doi: 10.2307/3146728
- Jaeger W. 2006. The effects of land-use regulations on property values. Environmental Law 36:105–130.
- Journeaux P. 2015. The effects of environmental constraints on land prices. [cited 2015 Jun 2]. Available from: http://www.agfirst.co.nz/images/uploads/The_Effect_of_Environmental_Constraints_on_Land_Prices.pdf.
- Journeaux P, Newman N. 2015. Economic & environmental analysis of dairy farms with barns. [cited 2015 Aug 9]. Available from: https://www.dairynz.co.nz/media/3215212/economic-analysis-wintering-barns-report.pdf.
- Kaye-Blake W, Schilling C, Monaghan R, Vibart R, Dennis S, Post E. 2014. The economic impacts of nutrient policy options in Southland. In: Currie LD, Christensen CL, editors. Nutrient management for the farm, catchment and community. Proceedings of the Fertilizer and Lime Research Centre annual workshop; Feb 2014; Palmerston North (New Zealand): Massey University.
- Kerr S. 2016. Agricultural emissions mitigation in New Zealand: answers to questions from the Parliamentary Commissioner For The Environment. [cited 2018 May 10]. Available from: http://www.pce.parliament.nz/media/1679/agricultural-emissions-mitigation-in-new-zealand_final.pdf.
- McDowell R. 2007. Assessment of altered steel melter slag and P-socks to remove phosphorus from streamflow and runoff from lanes. AgResearch Client report for Environment Bay of Plenty. [cited 2015 May 25]. Available from: http://www.boprc.govt.nz/media/34458/TechReports-070601-AssessmentAlteredSteelmelterslag.pdf.
- McGrath JM, Penno JW, Macdonald KA, Carter WA. 1998. Using nitrogen fertiliser to increase dairy farm profitability. Proceedings of the New Zealand Society of Animal Production 58:117–120.
- Moran E, Pearson L, Couldrey M, Eyre K. 2017. The Southland economic project: agriculture and forestry. Technical report. Publication no. 2017-02. Invercargill (New Zealand): Environment Southland; 340 p.
- MPI (Ministry for Primary Industries), Fertiliser Association of New Zealand, AgResearch. 2015. Overseer best practice data input standards version 6.2.0. [cited 2015 Apr 12]. Available from: https://www.overseer.org.nz/user-guides.
- Muller C. 2017. Modelling dairy farm systems: processes, predicaments and possibilities. In: Currie LD, Hedley MJ, editors. Science and policy: nutrient management challenges for the next generation. Proceedings of the Fertilizer and Lime Research Centre Annual Workshop; Feb 2017; Palmerston North (New Zealand): Massey University.
- Neal MB. 2015. Statement of primary evidence of Mark Neal for Fonterra Co-operative Group Limited and DairyNZ Limited: in the matter of the Proposed Variation 2 to the Proposed Canterbury Land and water regional plan – section 13 Ashburton. Available from: https://api.ecan.govt.nz/TrimPublicAPI/documents/download/2309753.
- New Zealand Treasury. 2015 Mar. Public sector discount rates for cost benefit analysis. New Zealand Government: Wellington. [cited 2015 Jun 20]. Available from: https://treasury.govt.nz/publications/guide/public-sector-discount-rates-cost-benefit-analysis.
- Palisade. 2015. @Risk Software, version 7. Available from: www.palisade.com/risk/.
- PCE (Parliamentary Commissioner for the Environment). 2013. Water quality in New Zealand: land use and nutrient pollution. [cited 2018 May 10]. Available from: http://www.pce.parliament.nz/media/1275/pce-water-quality-land-use-web-amended.pdf.
- PCE (Parliamentary Commissioner for the Environment). 2015. Update report – water quality in New Zealand: land use and nutrient pollution. [cited 2018 May 10]. Available from: http://www.pce.parliament.nz/media/1008/update-report-water-quality-in-new-zealand-web.pdf.
- Plantinga AJ, Lubowski RN, Stavins RN. 2002. The effects of potential land development on agricultural land prices. Journal of Urban Economics. 52(3), 561–581. doi:10.1016/S0094-1190(02)00503-X.
- Pope CA, Goodwin HL. 1984. Impacts of consumptive demand on rural land values. American Journal of Agricultural Economics. 66:750–754. doi: 10.2307/1240991
- The Press. 2015 Sep 11. Nutrient rules knocking down values, agent says. Christchurch: Fairfax Media. Available from: http://www.pressreader.com/new-zealand/the-press/20150911/281767038002262/TextView.
- Quotable value: property trends [Internet]. 2015. [cited 2015 Mar 14]. Available from: https://www.qv.co.nz/property-trends/overview.
- Roberts AHC, Morton JD. 1999. Fertiliser use on New Zealand dairy farms. Auckland: New Zealand Fertiliser Manufacturers’ Association.
- Robotyagov SS, Jha M, Campbell TD. 2010. Nonpoint-source pollution reduction for an Iowa watershed: an application of evolutionary algorithms. Canadian Journal of Agricultural Economics. 58:411–431. doi: 10.1111/j.1744-7976.2010.01198.x
- Rouse HL, Norton N. 2017. Challenges for freshwater science in policy development: reflections from the science-policy interface in New Zealand. New Zealand Journal of Marine and Freshwater Research. 51:7–20. doi: 10.1080/00288330.2016.1264431
- Shadbolt N. 2009. Benchmarking in food and farming: creating sustainable change. Surrey: Gower. Chapter 4, DairyBase: building a best practice benchmarking system; p. 39–49.
- Shadbolt N. 2012. Competitive strategy analysis of NZ pastoral dairy farming systems. International Journal of Agricultural Management. 1(3):19–27.
- Sinclair AG, Dyson CB, Shannon PW. 1990. The long-term effectiveness of reactive phosphate rock as a phosphate fertiliser for New Zealand pastures. In: Proceedings of the New Zealand Grassland Association. 51:101–104.
- Sulzberger T, Phillips T, Shadbolt N, Ridler B, McCallum R. 2015. A whole farm modelling approach to evaluate the economic viability of a dairy farm in a sensitive catchment. In: Currie LD, Burkitt LL, editors. Moving farm systems to improved attenuation. Proceedings of the Fertilizer and Lime Research Centre annual workshop; Feb; Palmerston North (New Zealand): Massey University.
- TelferYoung. 2015. Land values in the Rotorua area and the Lake Rotorua catchment. [cited 2015 Jun 6]. Available from: http://www.rotorualakes.co.nz/vdb/document/1257.
- Vaillancourt F, Monty L. 1985. The effect of agricultural zoning on land prices, Quebec, 1975–1981. Land Economics. 61:36– 42.
- Vibart R, Vogeler I, Dennis S, Kaye-Blake W, Monaghan R, Burggraaf V, Beautrais J, Mackay A. 2015. A regional assessment of the cost and effectiveness of mitigation measures for reducing nutrient losses to water and greenhouse gas emissions to air from pastoral farms. Journal of Environmental Management. 156:276–289. doi: 10.1016/j.jenvman.2015.03.041
- Wilcock B, Elliott S, Hudson N, Parkyn S, Quinn J. 2008. Climate change mitigation measures: water quality benefits and costs. Report prepared by NIWA for MfE. Wellington: Ministry for the Environment. 71 p.