
 ?Mathematical formulae have been encoded as MathML and are displayed in this HTML version using MathJax in order to improve their display. Uncheck the box to turn MathJax off. This feature requires Javascript. Click on a formula to zoom.
ABSTRACT
Elevated coumestrol levels in lucerne (Medicago sativa L.) can reduce the reproductive performance of ewes. A model to predict coumestrol content of lucerne between summer and late autumn was developed to assess the risk of a crop having elevated levels. Data from previous studies have shown fungal damage to be the major contributor to coumestrol levels, but the fungal infestation levels that can cause a risk to reproduction in sheep are difficult to quantify. A number of variables were tested and the sum of rainfall and days where relative humidity was over 95% at 0900 h was found to have the best fit with coumestrol content of lucerne crops. The model was then tested with independent data from the literature and field. A decision tree is proposed as a practical user-friendly guide to predict whether coumestrol content is above or below a risk threshold of 25 mg/kg DM.
Introduction
Lucerne (Medicago sativa L.), also known as alfalfa, is a high quality fodder crop promoted for use in New Zealand dryland pasture systems (Moot et al. Citation2003). A potential impediment to the widespread adoption of lucerne in sheep systems is that it produces a phyto-oestrogen called coumestrol. The coumestrol content of lucerne can range from less than 1 mg/kg DM up to at least 600 mg/kg DM, with levels above 25 mg/kg DM shown to decrease the ovulation rate, and therefore lambing rate, of ewes (Smith et al. Citation1979; Fields et al. Citation2018a). Removal of ewes from lucerne with elevated coumestrol for two weeks prior to the start of the breeding period allows recovery of reproductive performance (Fields et al. Citation2018a). However, it is currently difficult to estimate coumestrol content of lucerne without laboratory testing. This means ewes may be unnecessarily removed from lucerne when coumestrol levels are not elevated or inadvertently fed oestrogenic lucerne that is presumed safe but causes a depression in fecundity.
Coumestrol is elevated in lucerne crops primarily in response to fungal infection (Loper and Hanson Citation1964; Hanson et al. Citation1965; Sherwood et al. Citation1970; Fields et al. Citation2018b). However, scoring the severity of fungal damage in a lucerne crop is subjective, based on the perspective of the assessor, and in practice, many of the leaf spot diseases in lucerne do not appear visually severe. They are often out of sight on the lower leaves, and the majority of an infected leaf can remain green and healthy. It is also difficult to quantify the boundary between negligible and problematic levels of fungal disease (Fields et al. Citation2018b). At present, choice of cultivar does not appear to be an effective way to reduce coumestrol accumulation (Fields et al. Citation2018b) as resistance to many of the more common fungal diseases, such as Stemphylium leaf spot (Stemphylium spp. Wallr), spring black stem (Phoma medicaginis Malbr. & Roum), and common leaf spot (Pseudopeziza medicaginis (Lib.) Sacc.), are not included in lucerne breeding programmes unless the disease affects persistence or yield substantially. In addition, fungicide application is not considered economic for most dryland systems, especially as past research has used frequent, weekly applications (Hanson et al. Citation1965; Purves et al. Citation1981).
A model with its development based on quantifiable environmental factors, such as temperature, rainfall, humidity, and sunlight, rather than a visual fungal damage score could provide a reliable method to estimate coumestrol content. This may allow farmers to predict the coumestrol content of lucerne during and two weeks prior to mating, and therefore make an informed management decision to move ewes to a non-oestrogenic pasture if levels are predicted to be elevated. To develop a coumestrol prediction model, multiple quantifiable agronomic and environmental factors were related to the coumestrol content of lucerne sampled across three years of field experiments. The model was then validated with independent data from historic studies and additional local field samples.
Methods
Experimental sites
Between 2014 and 2016, lucerne samples (n = 301) were collected from Lincoln (43° 38′ 53.29″ S, 172° 27′ 54.92″ E) and Springston (43° 39′ 24″ S, 172° 19′ 32″ E), both in Canterbury, New Zealand. The Lincoln site had a ‘Wakanui silt loam’ soil with 0.3 m of topsoil overlaying a silt to loamy sand horizon of 2–3 m depth (Cox Citation1978). The paddock was sown into lucerne (‘Stamina 5’) in November 2010 following a pasture of annual ryegrass (Lolium multiflorum Lam.) from 2009 to 2010. The site is flat, with a line of trees 200 m west and irrigation 40 m west of the nearest experimental plots. To account for these factors treatments were blocked east to west. As described in , lucerne samples of known regrowth duration were sampled in autumn 2014, and from another section of the paddock in summer and autumn 2015. These samples were simultaneously at different development stages due to variable cutting frequency of plots (Fields et al. Citation2018b), with three replicates per cutting treatment. Lucerne samples were also collected from a different part of the paddock on eight dates from 2 November 2015 to 25 May 2016 (). These were from a lucerne stand mown every eight weeks compared with a normal regrowth length for Canterbury of six weeks.
Table 1. The timing of lucerne sample collection from stands at Lincoln and Springston.
The Springston site comprised of ‘Lowcliffe moderately deep’ and ‘Lowcliffe stony’ silt loams (Webb and Bennett Citation1986; Hewitt Citation2010). The site is flat, with a hedge ca. 150 m east and a line of trees 50 m north of the experimental plots. The paddock was subdivided into six sections and each was sown with five lucerne cultivars (‘Stamina 5’, ‘Stamina 6GT’, ‘Kaituna’, ‘Runner’ and ‘Rhino’) in November 2008. These sections were rotationally grazed by sheep between sowing and the spring prior to sample collection in summer and autumn 2015 (). Further details on the management and experimental designs for the Lincoln and Springston sites are provided in Fields et al. (Citation2018b).
Ewes are predominantly mated in the late summer to mid-autumn period, making this timeframe of greatest interest for the crop model. In addition, lucerne was not sampled in winter, nor during the first regrowth of the spring, as many of the environmental factors experienced during the ‘growing period’ of the shoots occurred while the plants were dormant. Lucerne samples with a regrowth age of less than two weeks were excluded as a large proportion of the leafy material was residual from before mowing, and therefore older than two weeks, particularly in the samples cut at two-week intervals in 2014 (Fields et al. Citation2018b).
At sampling, height of lucerne was recorded and samples were cut just above crown height (∼40 mm above ground) from 0.2 m2 quadrats. Fungal damage score was assessed using the criteria based on Harvey and Martin (Citation1980) and plant assessment keys from James (Citation1971). The categories of the scoring system are outlined in . Lucerne was oven dried at 60°C and weighed to determine dry matter yield. The material was ground to a powder from which coumestrol was extracted and measured by HPLC with the method described in Fields et al. (Citation2018b). Coumestrol content of the lucerne ranged from 0.38 to 250 mg/kg DM with a median level of 29 mg/kg DM.
Table 2. Damage severity score categories for fungal and insect damage (from James Citation1971; Harvey & Martin Citation1980).
Predictors
Weather data were retrieved using the CliFlo database (National Institute of Water and Atmosphere Research, NZ). For Lincoln sites Broadfield EWS (2.5 km away; 43° 37′ 34.392″ S, 172° 28′ 13.44″ E) was used for temperature (°C), rainfall (mm), relative humidity (RH) (%), and solar radiation (MJ/m2) data. Broadfield EWS data were also used for the Springston site (12 km away), with the exception of rainfall which was measured at Burnham Sewage Plant (43° 37′ 20.1″ S, 172° 18′ 33.3″ E), 4 km away. Total sunlight hours were measured at the Christchurch Aero Station (Christchurch Airport; 43° 29′ 34.8″ S, 172° 32′ 13.2″ E), located 18 km from the Lincoln site and 25 km from the Springston site.
A range of calculations for each lucerne sample was made, using the weather data for the entire regrowth period and for the range of different two week and month-long periods prior to sampling date:
For rainfall, total rainfall (mm) was calculated.
For temperature, the mean daily temperature (°C) was used.
For RH data, the number of days when RH was over 70%, 80%, 90% and 95% at 0900 h was calculated.
Daily soil moisture deficit (SMD) was simulated, beginning at a time when the soil was known to be fully recharged, by adding daily water use and subtracting daily rainfall from the previous day’s SMD. When SMD was less than 0, additional rainfall was attributed to runoff or drainage. When the SMD was less than half of the known available water capacity (AWC) of the soil, daily water use was equal to the daily potential evapotranspiration (PET) values measured at the climate station, Broadfield EWS. When SMD was greater than half of the AWC the daily water use was calculated as: (AWC−SMD)/(0.5 × AWC) × PET (Moot et al. Citation2012). For this model, the average deficit during a growth period was expressed as a percentage of the maximum potential SMD for the site.
For radiation, average solar radiation (MJ/m2) and average daily sunshine hours were used.
Initial regression model
An initial regression model using all of the predictors was then performed to select, for further modelling, the predictors that were not highly correlated with each other, whilst also providing a representative range. Collinear predictors were compared using the F-statistics of the regression model, and the R2 value of coumestrol content versus individual predictors, with the poorer performing predictors removed.
Prediction of coumestrol content of a lucerne crop
A best subset regression model was used to account for the effect of each of the selected predictors on coumestrol content. Models containing 1, 2, 3 and 4 predictors were produced and the two best models for each number of predictors reported. Models were compared with the adjusted R2 to account for the number of predictors in the model.
Testing the prediction model
Independent coumestrol data were sourced from the literature and additional coumestrol measurements from Oamaru, North Otago, NZ in 2015 (Fields et al. Citation2016), and Lincoln, Canterbury, NZ in 2016. Climate data for the regrowth period of the lucerne were sourced from nearby weather stations.
Logan, Utah
Coumestrol data for ‘Lahontan’ and ‘Ranger’ lucerne grown in Logan, Utah, USA during summer 1961 were obtained from Hanson (Citation1965). The first harvest occurred at ‘pre-bud’ on 30 June 1961. The final harvest date, of ‘full bloom plus 25 days’ occurred on 21 August 1961, allowing determination of harvest dates for ‘full bloom plus 10 days’ (6 August 1961) and ‘full bloom’ (27 July 1961). A regrowth start date of 16 June 1961, two weeks prior to the first harvest was assumed. Due to a lack of rainfall in June 1961, there was no change in coumestrol prediction from setting the regrowth start date one week or three weeks before the first harvest.
Climate data were sourced from Utah Climate Center (Citation2017) for the period between 16 June and 21 August 1961. Rainfall data for Logan, Utah were from Logan Radio KVNU (41° 43′ 43.416″ N, 111° 56′ 10.334″ W). During this period there was 25.5 mm rainfall. The RH data were sourced from Hill Airforce Base (Hill AFB; 41° 7′ 2.604″ N, 111° 57′ 11.308″ W) approximately 80 km away from Logan. When RH was not provided it was calculated from the dew point (TD) and temperature (T) data at 0900 h:
There were no dates with humidity above 95% at 0900 h at Hill AFB. Recent humidity data (1999–2016) from Logan-Cache Airport (41° 46′ 58.678″ N, 111° 51′ 17.302″ W) and Hill AFB were correlated (r = 0.819) for the June to August months. Furthermore, during this 17-year interval the RH at Logan-Cache was above 95% on only one occasion. It is therefore extremely unlikely that an RH value over 95% occurred during the experimental period.
Brookings, South Dakota
Coumestrol data for untreated ‘Ranger’ lucerne grown in Brookings, South Dakota, USA during summer 1963 were obtained from Hanson (Citation1965). Lucerne was reported to be 15 cm high on 29 July 1963. Therefore a regrowth start date two weeks earlier on 15 July 1963 was assumed. There was little effect of setting the start date three weeks prior as there was only 4 mm rainfall in this extra week, and no days over 95% RH. Lucerne was reported to be at ‘full bloom plus nine days’ on 12 September 1963. Thus, coumestrol content of ‘full bloom’ lucerne was from 3 September and ‘full bloom plus 10 days’ was on 13 September.
Rainfall data for Brookings, South Dakota were sourced from Brookings 2 NE (44° 19′ 0.012″ N, 96° 46′ 0.012″ W) between 15 July and 13 September 1963 (Utah Climate Center Citation2017). The humidity data for Brookings, South Dakota were sourced from Sioux Falls (43° 33′ 41.695″ N, 96° 43′ 57.004″ W) approximately 90 km away from Brookings. Recent humidity data for the July, August and September months between 1 July 2006 and 30 September 2016 were compared from Sioux Falls and Brookings 2 NE. The correlation was not as strong (r = 0.679) as that for Utah and therefore RH may be under or overestimated in the prediction model.
Lincoln, New Zealand
Data from Lincoln were obtained from Purves (1981) for regrowth between 12 February and 17 April 1980. Coumestrol levels of untreated lucerne from plots were estimated from the figures. Meteorological data were from the nearby (<1 km) Lincoln weather station (43° 38′ 50.654″ S, 172° 27′ 49.182″ E; CliFlo, NIWA).
Coumestrol data from lucerne at Lincoln between 7 March and 22 April 2016 were also used. Meteorological data for these sites were from Broadfield EWS.
Oamaru, New Zealand
Lucerne samples from Oamaru, North Otago, NZ were included in the validation of the prediction model, with meteorological data from Windsor station (45° 0′ 29.844″ S, 170° 49′ 22.116″ E) 22 km away (CliFlo, NIWA).
Statistical analysis
The climate data were used to predict coumestrol content using Equation (3) of the prediction model ().
A regression line between predicted and reported values was produced to determine whether they correlated.
In addition, linear regression with categories for the independent and original data sets was used to determine whether the parameters for each data set, derived from coumestrol content, rainfall and RH data, differed. The independent data were then added to the main data set to provide a final prediction equation.
Decision tree
Recursive partitioning (R (version 3.3.3) with package ‘rpart’) was used to create a tree model to classify coumestrol content by the rainfall and days over 95% RH variables. The tree was pruned to five terminal nodes. RandomForest was used (R package: ‘randomForest’) to create 1000 different trees from random samples with replacement from the original data and random samples without replacement from predictors. The standard error of the mean (SEM) is presented where mean data are reported in the format: mean ± SEM.
Results
Selection of predictors
An initial regression analysis of the coumestrol contents of 301 lucerne samples with all predictor terms included had high multicollinearity, with variance inflation factor (VIF) of range 12–4500. The main collinear terms were between RH thresholds, and between whole regrowth period and partial regrowth period (i.e. two week and month-long portions of the whole regrowth period) weather data terms. The weather data for the whole growth period were stronger predictors of coumestrol, with higher F values and R2 values, than the partial growth period data and therefore only whole growth period weather terms were included.
To further address collinearity the days above 70%, 80%, 85% and 90% RH, height and sunlight radiation predictors were removed. Removal of these terms resulted in all predictors with a VIF between 3 and 8.5 (); with levels above 5 indicating that some multicollinearity was still present. The remaining variables also represented a range of the agronomic and environmental factors present.
Table 3. The refined list of variables used to predict coumestrol content of a lucerne crop, following removal of obsolete, collinear parameters.
Prediction model
Best subsets regression analysis () predicted a moderate relationship between coumestrol and the number of days above 95% RH over the growing period that a lucerne stand had experienced (). A weaker relationship
was predicted between coumestrol and the sum of rainfall. Inclusion of sum of rainfall over the growing period, which was correlated with days above 95% humidity in the model, increased the adjusted R2 to 0.754. The VIF for these predictors was 3.3. Inclusion of additional predictors did not increase the
sufficiently (<1%) to warrant their inclusion.
Figure 1. The relationship between coumestrol content (mg/kg DM) of lucerne and days above 95% RH that the lucerne crop had been exposed to with 95% confidence interval (long-dashed lines) and prediction interval (short-dashed lines). Dotted line is the critical level (25 mg/kg DM) above which lucerne is reported to be a risk for ewe reproductive performance. Data from Lincoln, Canterbury, NZ in 2014 (◇), 2015 (○) and 2016 (×), and from Springston, Canterbury, NZ in 2015 (◆).
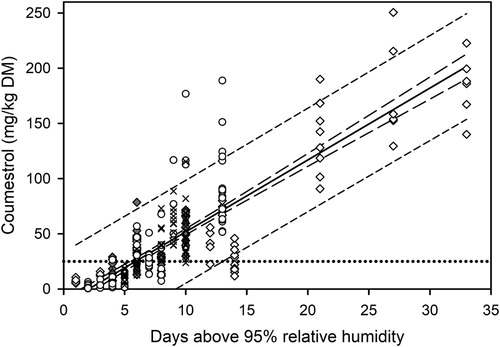
Table 4. The variables identified via best subsets regression as best relating to coumestrol content of lucerne.
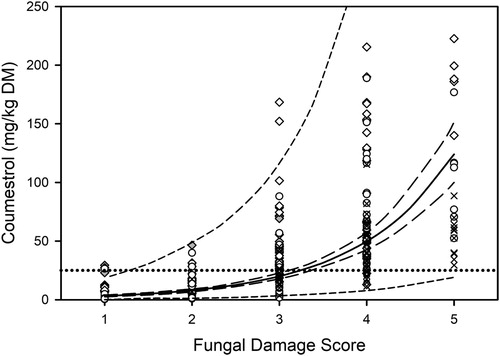
Coumestrol content was exponentially related (R2 = 0.578) to fungal damage score (). It was not as strong a predictor as rainfall and days above 95% RH. In addition, the variation in coumestrol content increased with fungal damage score. At a damage score of 1, the mean was 10.2 mg/kg DM and the standard deviation was 8.5 mg/kg DM. At a score of 3 the mean was 35.0 mg/kg DM and the standard deviation was 30.2 mg/kg DM, and at a score of 5, the mean was 82.0 mg/kg DM and the standard deviation was 55.0 mg/kg DM.
Figure 2. Coumestrol content (mg/kg DM) against fungal damage score of lucerne at Lincoln, Canterbury, NZ in 2014 (◇), 2015 (○) and 2016 (×), and from Springston, Canterbury, NZ in 2015 (◆). The relationship (R2 = 0.578) is described by the equation: y = 100.40x + 0.11 with 95% confidence interval (long-dashed lines) and prediction interval (short-dashed lines). Dotted line is the critical level (25 mg/kg DM) above which lucerne is reported to be a risk for ewe reproductive performance.
The first three equations in are based on the results from the best subsets regression analysis. Equation (1) describes the relationship
between coumestrol content and the number of days above 95% RH during the growing period. Equation (2) describes the relationship
between coumestrol content and the sum of rainfall over the growing period. Finally, Equation (3) describes the relationship between coumestrol content and days above 95% RH plus the sum of rainfall during the growing period. These equations could be applied to determine whether a particular lucerne crop has high or low coumestrol content.
Table 5. Equations for the prediction of coumestrol content of lucerne (mg/kg DM) from the days above 95% RH and/or the sum of rainfall (mm) during the growing period.
Prediction model validation
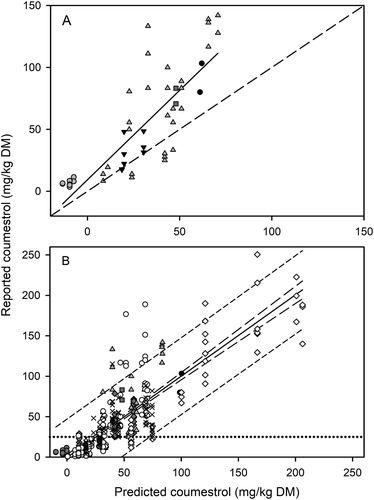
When the prediction model (Equation (3), ) using the RH and rainfall predictors was used for independent data there was a linear correlation (r = 0.813) between the reported and predicted coumestrol levels (A) and a root mean square deviation of 24.9. The prediction model tended to underestimate coumestrol content of the independent data set by a factor of 1.4. Most of this variation was from the results reported in Purves et al. (Citation1981) which had higher than expected coumestrol contents.
Figure 3. Reported (y) versus predicted (x) coumestrol content (mg/kg DM) of independent data using Equation (3) (Graph A; r = 0.813) and all data using Equation (4) (Graph B; ). The solid regression line in Graph A is described by the equation y = 1.44x + 9.27 and the dashed line is the identity line. For Graph B long-dashed lines are the 95% confidence interval and short-dashed lines are the prediction interval. Dotted line is the level (25 mg/kg DM) above which lucerne is a risk for ewe reproductive performance. Independent data in Graphs A and B are sourced from Logan, Utah, USA in 1961 (●); Brookings, South Dakota, USA in 1963 (▪); Lincoln, Canterbury, NZ in 1980 (▴) and 2016 (▾); and Oamaru, North Otago, NZ in 2015 (▪). Original data in Graph B sourced from Lincoln, Canterbury, NZ in 2014 (◇), 2015 (○) and 2016 (×), and from Springston, Canterbury, NZ in 2015 (◆).
Rainfall and RH of the independent data set were used to produce an independent regression relationship. The R2 was lower than in the original model, indicating a higher variance of coumestrol content. There was no significant difference in the coefficients and constants of the independent equation compared with the original equation. The constant of the original model was −13.8 which was not significantly different (P = 0.678) from the independent constant of −10.9. The original coefficient of days above 95% RH was 4.8 compared with 7.3 in the independent model (P = 0.055). The original coefficient of rainfall was 0.252 compared with the independent value of 0.346 (P = 0.231).
The data set was added to the initial prediction model producing a model as described in Equation (4) of .
This new equation requires validation with a further independent data set, however, a figure is provided (B) of predicted versus actual coumestrol using the data set which created the model.
Decision tree
A decision tree () was created in R using the original and independent data sets (n = 353) and the variables identified as predictors of coumestrol content (total rainfall during the growing period and days above 95% RH).
Figure 4. A decision tree to estimate mean coumestrol content of lucerne based on rainfall (mm) and the days above 95% RH that the stand was exposed to during its regrowth period. The regrowth period was the interval between the day forage was removed and the time of sampling, which ranged from four to eight weeks later.
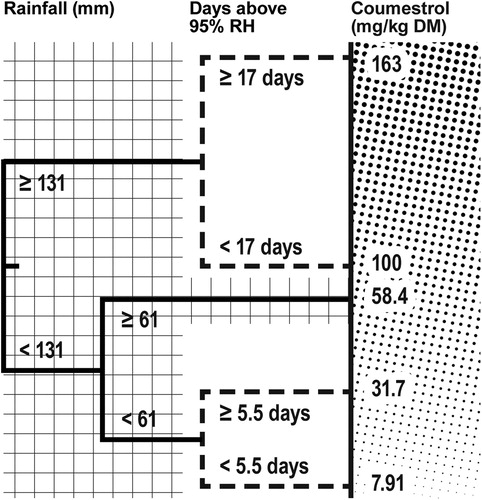
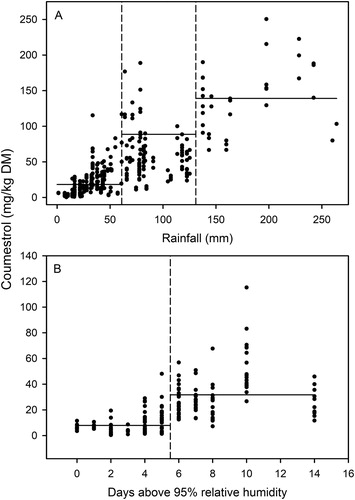
The decision tree showed that when total rainfall was greater than 131 mm during the regrowth period, mean coumestrol content would likely be high (139 ± 8.1 mg/kg DM, n = 34). This was further subdivided by the days above 95% RH. When there were fewer than 17 days above 95% RH mean coumestrol content was 100 ± 7.9 mg/kg DM (n = 13), when there were more than 17 days above 95% RH, mean coumestrol content was 163 ± 8.7 mg/kg DM (n = 21). A moderately high coumestrol content could be expected if rainfall was between 61 and 131 mm, with a mean of 58.4 ± 2.98 mg/kg DM (n = 116) using this model. However, when rainfall was below 61 mm coumestrol content was low to moderate depending on the number of days above 95% RH. When there were fewer than 5.5 days above 95% RH the mean coumestrol content was 7.91 ± 0.749 mg/kg DM (n = 115), when there were more than 5.5 days above 95% RH, the mean coumestrol content was 31.7 ± 1.93 mg/kg DM (n = 88).
The mean coumestrol contents for the different rainfall thresholds are shown in A. The data for the ‘days above 95% RH’ thresholds, where rainfall was less than 61 mm are shown in B. RandomForest with 1000 trees showed 83.9% of variance explained by the model.
Figure 5. Graph A. Coumestrol content of lucerne plotted against the sum of rainfall (mm) during the regrowth period of plant samples. From left: horizontal lines are mean coumestrol contents for rainfall less than 61 mm, between 61 and 131 mm, and above 131 mm. Graph B. Coumestrol content of lucerne against days above 95% RH for samples with rainfall less than 61 mm during the regrowth period. From left: horizontal lines are mean coumestrol contents for fewer than 5.5 days over 95% RH and more than 5.5 days over 95% RH.
Discussion
Best subsets regression showed days above 95% RH and the sum of rainfall to be the strongest predictors of coumestrol content in lucerne over three weeks old during the late spring to autumn period. They were able to predict coumestrol content with greater precision than the fungal damage score. The equation for coumestrol content using days above 95% RH and sum of rainfall (Equation (3)) was further validated by the independent data set to produce Equation (4).
When using these models care should be taken that if one predictor occurs without the other a significant coumestrol content response may still occur. It is also possible that in situations with days of humidity between 90% and 95% RH, but not above 95%, coumestrol contents may be underestimated. This may have been the case with the data from Purves et al. (Citation1981). By the final sampling date of their experiment, only 10 days had been recorded with humidity over 95% yet there were 25 days with over 90% RH. This may contribute to the underestimation of coumestrol for these data with the original prediction model.
Rainfall and humidity do not directly cause the coumestrol levels to increase in lucerne. Instead they create the environmental conditions suitable for fungal pathogens, and fungal pathogens are the main drivers of coumestrol content in lucerne (Hanson et al. Citation1965; Fields et al. Citation2018b). The main fungal pathogens observed in the lucerne samples were common leafspot, the cool biotype of Stemphylium spp., and spring black stem. Fungal pathogen species that were not observed or were uncommon in the samples, such as rust (Uromyces striatus Schröt.), the warm biotype of Stemphylium spp., anthracnose (Colletotrichum trifolii Bain) and lepto leaf spot (Leptosphaerulina trifolii (Rostovzev) Petr.), could have different requirements for infecting lucerne plants. For example rust, anthracnose and the warm biotype of Stemphylium spp. generally require a warm climate whereas lepto leaf spot, common leaf spot and spring black stem grow in cool climates (Stuteville & Erwin Citation1990). These models should therefore be used in conjunction with monitoring for fungal infection on the leaves and stem of the plants. The presence of shelter should also be taken into consideration, as windbreaks can increase RH. This means that in sheltered lucerne paddocks the use of humidity measurements from meteorological stations may result in an underestimation of coumestrol content. Further research, to test the ability of the model to predict coumestrol in sheltered versus unsheltered paddocks, would be useful.
Ideally, more independent data from the literature would have been used but this was limited by a requirement to know the mean coumestrol content, the sampling date, and the age of the lucerne regrowth. Many prior experiments reported in the literature give only development stage at sampling, with no sampling date or regrowth duration, or they provide the range of coumestrol contents over a month or period of interest. Furthermore, RH (or dew point) is not a common measurement at meteorological stations, especially over 30 years ago, which further limited the availability of suitable coumestrol data. This also meant that the humidity data were often measured at sites some considerable distance from the field sites, which may contribute to error in the predictions. For this reason, recent humidity data now available at nearby meteorological stations were correlated with recent data from the further afield stations. Correlations were not strong (r = 0.777 for Logan and Hill AFB, Utah; r = 0.679 for Brookings and Sioux Falls, South Dakota), indicating some error was contributed. This was unlikely to be a problem for Logan, Utah which had a low 0900 h average RH (45.7 ± 0.39%) between June and August over the last 17 years, and was above 95% RH on only one occasion. On the other hand, it may have produced some error at Brookings, South Dakota which from July to September over the last 10 years had an average 0900 h RH closer to the 95% threshold (71.8 ± 0.42%) and 12 occasions with RH over 95%. For prediction in regions without access to humidity data it is possible to use the single variable of rainfall to predict coumestrol content (Equation (2) of ), however the reliability will be reduced.
These models may not be practical or intuitive for on-farm use, and therefore the decision tree model was created to indicate whether coumestrol content of lucerne crops was low, medium or high based on rainfall and RH data (). This tree model showed that when rainfall during the regrowth period was less than ∼60 mm and there were five or fewer days above 95% RH, a low coumestrol content could be predicted, with a mean value of 7.9 mg/kg DM. In contrast, when there were six or more days above 95% RH, a moderate coumestrol content could be expected, with a mean of 31 mg/kg DM. This is in line with levels previously shown to reduce ewe reproductive performance (Smith et al. Citation1979; Ramòn et al. Citation1993; Fields et al. Citation2018a). When rainfall during the growing period is above 60 mm, a moderately high to high coumestrol content would be predicted by the model. Farmers could utilise this decision tree along with their local weather data to predict coumestrol levels, and with further research and development there is potential for this type of model to be used to send automated alerts to farmers regarding the coumestrol status of their crop. If the levels of coumestrol are predicted to be elevated, removal of ewes from the lucerne to a non-oestrogenic feed for two weeks prior to mating will mitigate the risk of decreased lambing rates (Fields et al. Citation2018a). If mating is in progress, ewes should be removed as soon as the heightened coumestrol levels are predicted to be present. It is important to remove ewes only if there is a suitable quantity of an alternative feed source as live weight has a direct positive effect on ovulation rate (Thompson et al. Citation1990; Fields et al. Citation2016). However, as rainfall is a major component in the model, in dry years where only drought tolerant species such as lucerne are available, it is likely that the coumestrol levels will be low. In contrast, during wet years with a lot of rainfall causing coumestrol elevation to be predicted, the rain should have enabled the growth of other pasture species suitable for mating.
Supplementary Data
Download MS Excel (15.3 MB)Acknowledgements
We thank Dr Annamaria Mills, Jenny Zhao, and Lincoln University Field Research Centre technicians for their contributions to this research.
Disclosure statement
The authors declare no conflicts of interest.
ORCID
Rachel Lilian Fields http://orcid.org/0000-0002-7709-0505
Graham Barrell http://orcid.org/0000-0001-7644-6816
Additional information
Funding
Related Research Data
References
- Cox JE. 1978. Soils and agriculture of Part Paparua County, Canterbury, New Zealand. Wellington: New Zealand Soil Bureau.
- Fields RL, Barrell GK, Gash AFJ, Zhao J, Moot DJ. 2018b. Alfalfa coumestrol content in response to development stage, fungi, aphids, and cultivar. Agronomy Journal. 110(3):910–921. doi: 10.2134/agronj2017.09.0535
- Fields RL, Barrell GK, Moot DJ. 2016. Premature mammary development in ewe lambs exposed to an oestrogenic lucerne pasture. Journal of New Zealand Grasslands. 78:41–44.
- Fields RL, Moot DJ, Sedcole JR, Barrell GK. 2018a. Recovery of ovulation rate in ewes following their removal from an oestrogenic lucerne forage. Animal Production Science Online Early.
- Hanson CH, Loper GM, Kohler GO, Bickoff EM, Taylor KW, Kehr WR, Stanford EH, Dudley JW, Pedersen MW, Sorenson EL and others. 1965. Variation in coumestrol content of alfalfa as related to location, variety, cutting, year, stage of growth, and disease. Technical Bulletin. 1333:1–43.
- Harvey IC, Martin RJ. 1980. Leaf spot diseases on lucerne cultivars. New Zealand Journal of Experimental Agriculture. 8(3–4):295–296. doi: 10.1080/03015521.1980.10426276
- Hewitt AE. 2010. New Zealand soil classification. 3rd ed. Manaaki Whenua-Landcare Research New Zealand L ed. Lincoln, N.Z.: Manaaki Whenua Press.
- James WC. 1971. An illustrated series of assessment keys for plant diseases, their preparation and usage. Canadian Plant Disease Survey. 51(2):39–65.
- Kalu BA, Fick GW. 1981. Quantifying morphological development of alfalfa for studies of herbage quality. Crop Science. 21(2):267–271. doi: 10.2135/cropsci1981.0011183X002100020016x
- Loper GM, Hanson CH. 1964. Influence of controlled environmental factors and two foliar pathogens on coumestrol in alfalfa. Crop Science. 4(5):480–482. doi: 10.2135/cropsci1964.0011183X000400050013x
- Moot DJ, Brown HE, Teixeira EI, Pollock KM. 2003. Crop growth and development affect seasonal priorities for lucerne management. In: Moot DJ ed. Legumes for dryland pastures. Christchurch: New Zealand Grassland Association, Research and Practice Series 11. p. 201–208.
- Moot DJ, Pollock KM, Lewis B. 2012. Plant population, yield and water use of lucerne sown in autumn at four sowing rates. Proceedings of the New Zealand Grassland Association. 74:97–102.
- Purves RG, Hood ND, Dunbier MW. 1981. The effect of cutting management and fungicide application on coumestrol levels in three lucerne cultivars. Proceedings of the NZ Weed and Pest Control Conference. 34:25–28.
- Ramòn JP, Valderràbano J, Folch J. 1993. Reproductive performance of Rasa Aragonesa ewes mated on lucerne (Medicago sativa cv. Aragon) pastures. Small Ruminant Research. 11(4):323–329. doi: 10.1016/0921-4488(93)90003-Z
- Sherwood RT, Olah AF, Oleson WH, Jones EE. 1970. Effect of disease and injury on accumulation of a flavonoid estrogen, coumestrol, in alfalfa. Phytopathology. 60(4):684–688. doi: 10.1094/Phyto-60-684
- Smith JF, Jagusch KT, Brunswick LFC, Kelly RW. 1979. Coumestans in lucerne and ovulation in ewes. New Zealand Journal of Agricultural Research. 22(3):411–416. doi: 10.1080/00288233.1979.10430768
- Stuteville DL, Erwin DC, ed. 1990. Compendium of alfalfa diseases. St. Paul, Minnesota, The American Phytopathological Society.
- Thompson KF, Sedcole JR, O’Connell D, Geenty KG, Sykes AR. 1990. Spring and summer pasture feeding and ewe reproduction and wool growth. Proceedings of the New Zealand Grassland Association. 52:123–127.
- Utah Climate Center. 2017. [accessed 2017 February 23]. https://climate.usu.edu/
- Webb TH, Bennett CM. 1986. Soils of Ashley Dene., Department of Scientific and Industrial Research Soil Bureau Report CH17.