
 ?Mathematical formulae have been encoded as MathML and are displayed in this HTML version using MathJax in order to improve their display. Uncheck the box to turn MathJax off. This feature requires Javascript. Click on a formula to zoom.
ABSTRACT
I summarised cadmium concentrations from soil samples collected by the fertiliser industry between 2006 and 2015, and from soil samples collected by regional councils. Using these data, a statistical model was used to estimate soil cadmium concentrations on agricultural land within each territorial authority. Across New Zealand, most territorial authorities (56 of 66), including all the South Island, had mean soil cadmium concentrations below 0.6 mg Cd/kg. The highest mean soil cadmium values on agricultural land were in the Otorohanga and Matamata-Piako districts (0.90 and 0.89 mg Cd/kg, respectively). In these districts, around 1% of properties were estimated to have mean soil cadmium in excess of 1.8 mg Cd/kg. The fertiliser industry requires that cadmium concentrations in phosphate fertiliser are below a voluntary limit of 280 mg/kg P. The mean cadmium concentration in fertiliser samples taken between 2003 and 2015 was 184 mg Cd/kg P, 66% of the voluntary limit.
Introduction
Cadmium (Cd) is a heavy-metal contaminant of phosphate (P) fertiliser. Where there is sustained application of fertiliser, cadmium may accumulate in topsoil (e.g. Taylor Citation1997; Loganathan et al. Citation2003). From there, cadmium may be taken up into agricultural produce (e.g. Roberts et al. Citation1994), and enter the food chain. Cadmium concentrations in typical New Zealand diets are below thresholds established by the World Health Organisation (Vannoort and Thomson Citation2009). In New Zealand, management of cadmium concentration in agricultural soils is carried out through the Tiered Fertiliser Management System (TFMS; Warne Citation2011; Sneath Citation2015; Fertiliser Association of New Zealand Citation2016). The TFMS is a voluntary system managed by the fertiliser industry. It is part of the Cadmium Management Strategy, approved by the Cadmium Management Group (a nationally representative group of stakeholders with representation from the fertiliser industry, primary sector organisations, regional councils, and central government agencies). The intent of the TFMS is to ensure that cadmium concentrations in agricultural soils remain within an acceptable range that allows for protection of human health and the environment, as well as long-term sustainable agricultural production. The TFMS establishes concentrations of soil cadmium at which management actions should occur (). No accumulation of soil cadmium is allowed by the TFMS beyond 1.8 mg Cd/kg (Tier 4), without a detailed site-specific investigation to identify risks and pathways for potential harm.
Table 1. Soil cadmium concentrations specified by the voluntary Tiered Fertiliser Management System (Fertiliser Association of New Zealand Citation2016).
As part of the application of the TFMS, the New Zealand fertiliser industry has carried out sampling for soil cadmium concentrations (Cavanagh Citation2014; Sneath Citation2015). The sampling is focused on farms that are currently applying an average of phosphorus at 30 kg/ha/yr or more. The system is voluntary, and farmers applying fertiliser at a high rate are encouraged to have soil samples analysed for cadmium concentrations, as part of routine soil fertility tests. The cadmium tests are expected to be undertaken at least once every five years. These data provide a basis for analysing cadmium concentrations in New Zealand’s agricultural soils, providing information about soil cadmium concentrations in agricultural land by territorial authority; and investigating the association between available factors and soil cadmium concentration. The analysis of earlier data led to the recommendation to collect about 30 samples from each land use that makes up a significant proportion of land area within a region to increase the sampling representation for each land use in each region (Cavanagh Citation2014). This recommendation was followed by the fertiliser industry, providing a broad spread of samples across New Zealand.
Soil cadmium sampling is also carried out by some regional councils as part of their State of the Environment reporting (e.g. Land Monitoring Forum Citation2009; Drewry Citation2017). This monitoring includes soil quality to provide information of the functioning of soil in the context of biological productivity, environmental quality, and plant and animal health (Hill and Sparling Citation2009). Within this monitoring framework, phosphate fertilisers have been identified as a significant anthropogenic source of additional cadmium to New Zealand agricultural soils.
In order to reduce the rate of accumulation of soil cadmium, the fertiliser industry manages the concentration of cadmium in phosphate fertiliser. Until the 1990s, most of New Zealand’s phosphate fertiliser was derived from Nauru rock phosphate, which had high cadmium concentrations of around 600 mg Cd/kg P (Syers et al. Citation1986). Since the 1990s, rock phosphate with lower cadmium concentrations has been sourced from elsewhere. In 1995, the fertiliser industry established voluntary limits for cadmium concentrations in fertiliser. The initial proposal was for a limit of 420 mg Cd/kg P with a planned phased reduction in the limit. From July 1995, the cadmium concentration in fertiliser was restricted to be below 340 mg Cd/kg P. Fertiliser companies were rapidly able to manufacture fertiliser within this range, further reducing the upper limit to 280 mg Cd/kg P from January 1997. Since 2001, this limit on cadmium concentrations in fertiliser has been monitored and audited through the Fertmark programme, a New Zealand fertiliser quality assurance scheme. The fertiliser companies have carried out routine sampling of cadmium concentration in fertiliser, with the sampling programme being audited by Quality Consultants of New Zealand (QCONZ).
This study used New Zealand soil cadmium data to develop a statistical model that allowed the estimation of cadmium soil concentrations across a broad spatial scale, combining different data sources. The concentration of soil cadmium varies widely between regions, and this analysis allowed concentrations to be estimated at the scale of Territorial Authorities, potentially allowing management at a finer spatial scale. Data included here were derived from earlier summaries of soil cadmium data (Cavanagh Citation2014; Abraham et al. Citation2016). These data were used in the statistical modelling to assess the influence of covariates on soil cadmium concentrations. The covariates included in the analysis were sample source and protocol, soil type, land use, sample depth and year. Outcomes from this study will support the Cadmium Management Group’s continuing risk management of cadmium in New Zealand’s agriculture and food systems.
Methods
Cadmium in soil
Cadmium concentrations in soil were measured by the fertiliser industry, as part of on-farm nutrient sampling. The samples were typically from composite samples collected along a transect or grid that is representative of the size of monitoring paddocks, and typically includes around 15 cores taken to a depth of either 7.5 cm or 15 cm (from pastoral and arable land, respectively) (Fertiliser Association of New Zealand Citation2016). For each soil sample, the total cadmium concentration (mg Cd/kg) was analysed by accredited (IANZ, International Accreditation New Zealand) laboratories following standardised methods benchmarked against those specified by the Fertiliser Quality Control Council (Cavanagh Citation2014; Fertiliser Quality Council Citation2015). Variability was measured using the coefficient of variation (CV, defined as the ratio of the standard deviation to the mean value of the samples). Metadata associated with each sample included a customer code, a soil type, a land use, the date of the sample, and a locality. Due to customer confidentiality requirements, the precise location of the samples was not made available, and the localities were standardised by identifying the associated territorial authority. The fertiliser companies Ballance and Ravensdown provided data from 6839 soil samples that were taken in 2007 and over the period 2012–2015 (in the presentation of results, the two companies are anonymised by referring to them as Company A and Company B). Of the industry samples, 3492 samples (51%) were from 2014.
In addition to the industry data, soil cadmium data from regional councils were provided by Landcare Research (with permission of the councils; as described by Cavanagh Citation2014). The regional council data included 1020 samples collected following State of the Environment methods (e.g. samples taken to 10 cm depth; Hill and Sparling Citation2009), as well as 443 other soil cadmium samples collected by Environment Canterbury as part of an arable and pastoral regional monitoring programme (Lawrence-Smith and Tregurtha Citation2013).
The land use and soil type categories were standardised, with soil types of sedimentary, ash, pumice, or peat/organic, and land use categories of dairy, sheep and beef, cropping, orchard, background, or other. Due to variable reporting, the data did not consistently distinguish between arable and horticultural cropping, so these categories were merged. A land use of ‘background’ was used for conservation land (conservation areas and indigenous forest), while a land use of ‘other’ included forestry (exotic plantations), turf, and urban land (see also Cavanagh Citation2014).
In preparation for the analysis, samples with incomplete metadata were removed from the dataset. Of all the samples, 2026 had no location information (the territorial authority was unknown); of the remaining samples, 623 samples had no sample depth information, 192 samples had no soil type indicated, and one sample had no sampling protocol information. Excluding these samples left a final dataset of 5459 samples with complete metadata (4210 samples from Ballance and Ravensdown, 928 samples from regional council State of the Environment monitoring, and 321 samples from other Environment Canterbury sampling). In the model dataset, 1404 (33.3%) of the industry samples were from sedimentary soils on dairy land (), with no data from background land, while the regional council data was spread more evenly across land use types. In the data since 2012, 89.8% of the fertiliser industry samples in the final dataset had a customer code (this code gave no address or other location information, but was a code that allowed samples from the same farm to be identified). No farm information is available for regional council samples, or for industry samples before 2012. Across the final dataset, 3708 samples had a customer code, with the samples being taken from 1905 unique farms.
Table 2. Number of samples in the model dataset, summarised by soil type and by land use, for data (a) from the fertiliser industry and (b) from regional councils.
Statistical modelling of soil cadmium
Statistical modelling was undertaken to analyse the influence of the covariates on the soil cadmium concentration, including investigating whether there was any linear temporal trend evident in the data, and whether the concentrations reported by the fertiliser companies and the regional councils were consistent. The analysis also allowed for standardisation of the sample depth. The effect of covariates on the concentration of soil cadmium was estimated using a hierarchical Generalised Linear Model (GLM). The parameters of the GLM were inferred from the data by using Bayesian Markov chain Monte Carlo (MCMC) methods. These methods allow the uncertainty in the soil cadmium within Territorial Authorities to be estimated, while accounting for the variability associated with covariates such as land use and soil type.
Cadmium concentration is a positive quantity, and the cadmium concentration in each sample was represented as a draw from a gamma distribution, , where
is the shape and
is the rate. The shape and rate were parameterised in terms of the mean,
, and the coefficient of variation,
(the coefficient of variation is the standard deviation divided by the mean). In terms of these parameters, the shape is
, the rate is
, and the cadmium concentration,
, of a sample,
, was estimated as:
(1)
(1) The coefficient of variation was assumed to be the same for all samples (so the distribution had the same shape, irrespective of the covariates). The mean concentration was represented as a linear function of the covariates:
(2)
(2) where the model had
covariates, including an intercept, with covariate
having the value
for sample
. District and farm effects were included as random effects,
and
, respectively. The farm effect was drawn from a normal distribution, independently for each unique customer code. Two approaches were used for handling samples without a customer code–in the first approach, samples with missing codes were each given a unique code, and in the second approach samples with missing codes were given a code that was a composite of the district, year, and land use values. The first approach would overestimate the number of farms and second approach would underestimate it. The district random effect was drawn from a conditional auto-regression (CAR) model (Gelfand and Vounatsou Citation2003), to account for any spatial correlation in the district data. Districts with any common boundaries were considered to be neighbours. The CAR model included a parameter
, specifying the degree of correlation between neighbouring districts. A low value of α would imply that there is only a weak association between the cadmium concentration in neighbouring districts, while a high value of α would allow for a high association.
This model structure was chosen as there is a wide range in the number of samples between districts. The spatial model for the district effect allows an estimate to be made of the mean cadmium concentration within each district, even for districts where there are few samples. The farm random effect is included as there are often multiple samples per property, and this inclusion allowed within-farm variation in soil cadmium concentrations to be represented. The Bayesian modelling is flexible enough for these sources of variation to be represented.
Different combinations of the fixed-level covariates were tested, to determine the effects that best explained variation in the cadmium concentration data. Potential fixed effects included a combination of source and protocol, protocol, soil type, land use, sample depth and year. Sample depth and year were included in the models as scaled continuous variables, while the other covariates were included as factors (variables with discrete categorical values). The model selection was based on minimising the leave-one-out information criterion (LOOIC; Vehtari et al. Citation2016, Citation2017), with the lowest LOOIC value indicating the closest model fit. The model selection process allows for a balance to be found between improving the model fit, and increasing model complexity, guarding against overfitting the model.
The Bayesian statistical model was fitted using the software Stan (Carpenter et al. Citation2017), with the priors given in . The priors were only weakly informative. Cauchy priors were chosen for the scale parameters, following recommendations by Gelman and Hill (Citation2006). For the positive scale parameters, the a positive half-Cauchy prior was used. The model was run for a warm up period of 1000 iterations, and then run for a further 20,000 iterations. The model was run with 3 chains, with a thinning interval of 10 iterations, keeping a total of 6000 samples.
Table 3. Priors used for fitting the statistical model of soil cadmium.
Using the posterior samples from the fitted model, a standardised cadmium concentration was estimated for agricultural land from each district. This value was calculated 6000 times, randomly sampling rows of original data from the same district to provide soil type and land use values, drawing from the distribution of farm-level random effects, and randomly assigning to each of the fertiliser industry companies. For districts that had less than 10 original cadmium samples, the random sampling of land use and soil type was taken across the region. The depth of the standardised estimate was set to 15 cm, reflecting the sample depth of the TFMS, and the year was set to 2015. From these estimates, a mean concentration could be calculated and the number of estimates within each TFMS level. The standardised values represented estimates of the mean soil cadmium concentrations on farms within each district, to 15 cm, and in 2015. This standardisation assumed that the farms sampled by the fertiliser industry were representative of the farms in each district (or region, if fewer than 10 samples were taken).
Cadmium in fertiliser
The cadmium concentration in superphosphate fertiliser (measured in mg Cd/kg P) is monitored using samples from the main manufacturing sites of the fertiliser companies Ballance and Ravensdown (currently at Mount Maunganui, Awarua, Ravensbourne, Awatoto, and Hornby). The two fertiliser companies carry out weekly composite sampling of fertiliser that is ready for dispatch, at each manufacturing site, with data available since January 2003 (3188 samples). Samples are taken of each of the main superphosphate fertiliser products, and an average cadmium concentration for each manufacturing site is calculated, weighted by the production of each sampled product. The sampling is carried out as part of the Fertmark fertiliser quality assurance programme, which specifies the sampling and analytical methods (Fertiliser Quality Council Citation2015). The industry sampling programme is audited by Quality Consultants of New Zealand (QCONZ), who also collate the data in a spreadsheet. In the present study, the weekly data were averaged to determine the monthly mean concentration of cadmium between January 2003 and July 2015. The average was an unweighted average across the manufacturing sites, as data on relative production volumes were not available. The 5th and 95th percentiles of the data were calculated to indicate the range of variation in the spot samples.
Results
Soil cadmium sample data
Across all samples in the final dataset from agricultural land, the mean cadmium concentration was 0.45 mg kg−1 (median value of 0.32 mg kg−1), compared with the mean concentration of the 178 background samples of 0.09 mg kg−1 (median value of 0.06 mg kg−1). The maximum soil cadmium concentration in the final dataset was 2.93 mg kg−1 (a sample with a soil cadmium value of 3.05 mg kg−1 was removed due to incomplete metadata). There were strong regional patterns in the concentration of cadmium (A). The highest mean cadmium concentrations in agricultural land were in the Waikato and Taranaki regions–in these regions the mean soil cadmium concentration was in the TFMS Tier 1 range. For all other regions, the mean soil cadmium concentration was within the Tier 0 range. Over all the data, there were 16 samples from Waikato, one sample from Auckland and four samples from Tasman that were in the TFMS Tier 4 range (with a soil cadmium concentration above 1.8 mg Cd/kg).
Figure 1. Summary of raw cadmium concentration in soil samples from (A) agricultural land in each region, (B) all samples by land use and (C) agricultural land by soil type. The lines indicate the 5% and 95% quantiles of the sample soil cadmium concentration, with the thinner whiskers extending to the full range. The dot marks the mean cadmium value of the samples in each group. The number of samples in each region is indicated at the bottom of each graph. The dashed orange lines indicate the thresholds of the Tiered Fertiliser Management System (Fertiliser Association of New Zealand Citation2016).
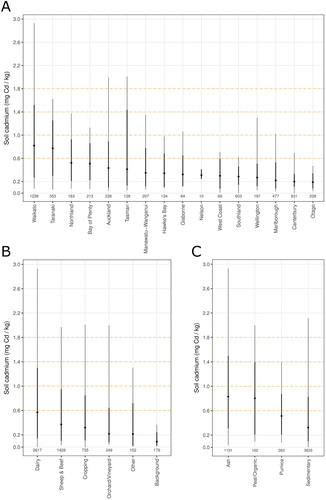
It is worth noting that the Tier 4 Tasman samples all came from the same farm. There were 19 samples taken at this property, with four of these samples recording soil cadmium concentrations exceeding 1.8 mg Cd/kg. The mean soil cadmium value across all the samples from this property was 0.93 mg Cd/kg. In general, there was considerable variability in the cadmium concentrations of repeated samples from individual farms. The mean CV of the cadmium concentration of soil samples from the same farm was 0.30 (across the 95 farms that had five or more samples). When calculated for the 61 territorial authorities with five or more soil samples, the mean CV was 0.56. By this measure, variation in cadmium concentration within farms was over half the variation within territorial authorities.
Dairy was the land use with the highest cadmium concentration (B), followed by sheep and beef, and cropping. The agricultural land use with the lowest mean soil cadmium concentration was orchard/vineyard. There was high variability in the data however, and in a previous analysis of a subset of the industry data the mean soil cadmium on 65 samples from orchard/vineyard samples was similar to dairy (Cavanagh Citation2014). All agricultural land uses had some samples that were within the Tier 4 range (16 samples from dairy, four samples from cropping, one sample from sheep and beef, and one sample from orchard/vineyard). The dataset includes 178 samples collected by regional councils on background land (land that has never been used for agriculture). The mean soil cadmium on these samples was 0.087 mg Cd/kg (with 95% of the samples having a concentration less than 0.24 mg Cd/kg). Mean cadmium concentrations in samples from agricultural land were highest in volcanic ash or peat/organic soils, and lowest in sedimentary soils.
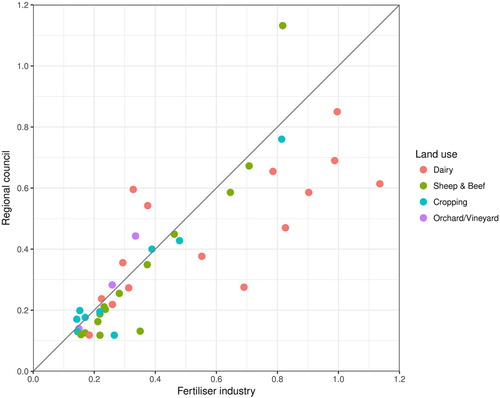
The mean soil cadmium values, averaged by territorial authority and land use, were typically lower when based on measurements made by regional councils than when based on the industry data (). Across the 41 territorial authorities and agricultural land use groups that had five samples or more taken by both regional councils and industry, the mean soil cadmium concentration from the regional council data was less than the mean soil cadmium concentration from the industry data in 73% of the groups. There was high variability in these data (a Pearson r2 of 0.83), reflecting both the low number of samples in many of the territorial authority and land use groups, and the variability in soil cadmium concentrations between samples. The raw data were collected from different sampling depths by the industry and the regional councils, with lower cadmium concentrations for deeper samples. Some differences in the raw data may be attributed to this difference in sampling depth.
Figure 2. Comparison of mean soil cadmium concentrations from data collected by regional councils and by the fertiliser industry. Points are shown for each territorial authority and land use that had five or more samples. The colour indicates the land use, and the diagonal line is the one-to-one line.
Statistical modelling of soil cadmium
Selection of the best model of soil cadmium concentrations involved testing whether source, protocol, or year should be included as effects. The structure of the farm random effect was also investigated. The model with the smallest LOOIC value was chosen (), and all models that included the farm random effect had markedly smaller LOOIC values than the model without this effect; models that represented missing property codes through the interaction of the main effects also had comparatively small LOOIC values. The latter meant that samples without a customer code, from the same territorial authority, the same land use and soil type and taken in the same year were treated as being from the same property. The model selection also indicated a closer fit for the model that included source and year effects, but the difference to a model that only included depth, soil and land use effects was not significant.
Table 4. Summary of model selection, listing the models in order of decreasing leave-one-out information criterion (LOOIC).
The model effects showed increased soil cadmium concentrations in volcanic ash, peat, and pumice soils (relative to sedimentary soils) with no significant difference between the effects associated with these soil types (). Soil cadmium concentrations were lower on land used for cropping, sheep and beef, and orchards than on dairy. The soil cadmium concentration on background land use was estimated at 27.5% (95% c.i.: 24.3%–31.1%) of the concentration on land used for dairy. These effects followed the patterns seen in the raw data (see ). The strength of these effects ranged from a mean of 0.745 (for orchard/vineyard land relative to dairy land), to a mean of 1.473 for peat/organic (relative to sedimentary soil). In contrast, the mean territorial authority effects ranged from 0.42 to 2.29, even after differences in soil, current land use, and the other model effects were accounted for. There was more variation associated with the territorial authority of the sample than with the other predictors included in the model.
Table 5. Posterior distributions of the model parameters, showing the mean and 95% credible interval of the estimated effects.
There was no significant difference between the soil cadmium values measured by the two different companies, or by the Environment Canterbury regional monitoring samples. Soil cadmium values measured by the regional councils following the State of the Environment (SOE) protocol was 83.6% (95% c.i.: 76.8%–90.8%) of the soil cadmium values reported by the industry (Company A). Differences between the industry and regional council data may be due to differences in the choice of properties that were included in the sampling. Samples collected to a deeper sampling depth had lower soil cadmium concentrations: the concentration in 15-cm samples was 87.9% (95% c.i.: 82.8%–93.2%) of the soil cadmium concentration in samples collected to 7.5 cm depth. There was no significant change in soil cadmium over the period of the study, with the year effect implying an annual change of −0.5% (95 c.i.: −2.2%– 1.2%).
The model allowed a standardised soil cadmium concentration to be estimated (as described in the methods), primarily adjusting for the variation in sampling depth. The standardisation also allowed the mean concentration to be estimated in territorial authorities that only had a small number of samples. There are broad scale variations in soil cadmium concentration across New Zealand. The territorial authorities with the highest mean soil cadmium were in the Waikato and Taranaki regions (, ), with the highest mean standardised soil cadmium of 0.90 mg Cd/kg being in Otorohanga District. In Otorohanga District, 32.7% of farms were estimated to be in Tier 1 or above (a mean soil concentration of 1.0 mg Cd/kg or over). It was estimated that 1.0% or more of the farms in the Otorohanga and Matamata-Piako districts had a mean standardised soil cadmium concentration over 1.8 mg Cd/kg, and so were in Tier 4 of the TFMS. In the South Island, in contrast, all territorial authorities were estimated to have most farms (at least 98%) in Tier 0 of the TFMS (a soil cadmium concentration less than 0.6 mg Cd/kg) (see Appendix A, Table A1). Soil cadmium concentrations were also lower on the East Coast of the North Island, with all territorial authorities (other than Napier City) estimated to have at least 97% of farms in Tier 0 (of the 29 samples taken on farms in the Napier City territorial authority, 33% had soil cadmium in the Tier 1 range, between 0.6 and 1.0 mg Cd/kg).
Figure 3. Mean standardised soil cadmium concentrations in agricultural land by territorial authority, and the estimated percentage of farms within each tier of the Tiered Fertiliser Management System (see detailed data in Appendix A, Table A1).
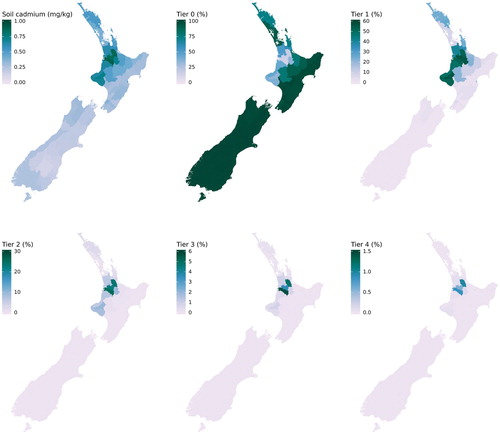
Table 6. The ten Territorial Authorities (TAs) with the highest mean standardised soil cadmium concentration.
The spread of standardised values is influenced by uncertainty in the territorial authority effect, and this uncertainty is larger in territorial authorities that had low numbers of samples. While the uncertainty will only have a minor effect on the mean value across farms in a territorial authority, the uncertainty will influence the proportion of farms that are estimated to have soil cadmium in the higher tiers. The proportion will increase as the spread of the farm-level estimates increases. This effect is seen in Kawerau District–Kawerau is a small area that is wholly within Whakatane District, and there were no soil samples taken within Kawerau. Despite this, it was estimated that 0.3% of the farms might be in Tier 4 (see Appendix A, Table A1).
Cadmium in fertiliser
Across all weekly samples from the main manufacturing sites, the average cadmium concentration between January 2003 and July 2015 was 184 mg Cd/kg P (). Ninety-five percent of the samples had cadmium concentrations less than 246 mg Cd/kg P, while five percent of the samples had concentrations less than 108 mg Cd/kg P. The monthly mean values fluctuated within this range, falling below 108 mg Cd/kg P in the last two months of the series (June and July 2015). The maximum monthly mean concentration over the period from 2003 to 2015 was 243.5 mg Cd/kg P.
Figure 4. Cadmium concentration in fertiliser samples from the main manufacturing sites (based on data from Quality Consultants of New Zealand Limited). The line shows the monthly mean concentration, the straight line shows the mean value over the period, and the shading marks the 90th percentile interval of the sample data.
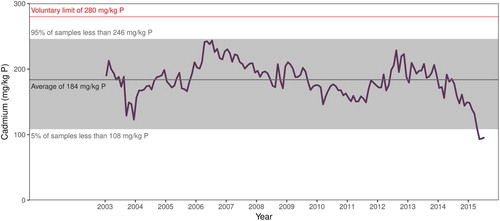
Since 2003, there have been two individual samples declared as exceeding the voluntary limit of 280 mg Cd/kg P. These were slight exceedances at 285 and 299 mg Cd/kg P. Two additional exceedances were recorded (with concentrations of 282 and 293 mg Cd/kg P), but they were from samples mistakenly taken from rock phosphate prior to blending (Peter Wood, QCONZ, pers. comm.).
The monthly-averaged concentration of cadmium in phosphate fertiliser was consistently below the voluntary limits established by the fertiliser industry. There were some exceedances reported in individual samples. The long-term sample average of cadmium in phosphate fertiliser was 184 mg Cd/kg P. This average is 66% of the voluntary limit of 280 mg Cd/kg P assumed for sulphuric acid- derived products, such as superphosphate in developing the TFMS (Sneath Citation2015). Changes in the source of rock drive the variability of the cadmium concentration in the fertiliser (Cadmium Working Group Citation2008). In the last two available months of data, the monthly average sample concentration fell below 100 mg Cd/kg P for the first time.
Discussion
In New Zealand, large areas, including most of the South Island, have soil cadmium concentrations below levels requiring any immediate active management. Elevated soil cadmium concentrations were primarily found in the Waikato and Taranaki regions, which have previously been identified as regions with higher soil cadmium concentrations (Kim Citation2005; Taylor et al. Citation2007; Cavanagh Citation2014; Stafford et al. Citation2014). Within those regions, the analysis identified the territorial authorities with higher soil cadmium concentrations. In the Otorohanga and Matamata-Piako districts, the mean standardised soil cadmium concentration on agricultural land is within Tier 1 of the Tiered Fertiliser Management System, with around one percent of properties estimated to have soil cadmium concentrations in Tier 4 (over 1.8 mg Cd/kg).
The statistical modelling identified factors that were related to soil cadmium concentrations, and these factors aligned with previous analyses of soil cadmium data (e.g. Stafford et al. Citation2014): dairy farming was associated with higher cadmium concentrations, and sedimentary soils were associated with lower soil cadmium concentrations. There was, however, more variability associated with the territorial authority of a sample than with either soil type or land use factors. It is expected that the variation in mean cadmium concentrations between territorial authorities reflects differences in fertiliser history, with high historical fertiliser use on dairy land in the Waikato and Taranaki regions. Soil cadmium concentration has been found to be associated with total phosphorus (Roberts et al. Citation1994; Schipper et al. Citation2011; McDowell et al. Citation2013; Stafford et al. Citation2015; Salmanzadeh et al. Citation2016), suggesting that soil cadmium concentrations primarily reflect phosphate fertiliser history. A similar relationship between phosphorus and cadmium has been found in freshwater sediments (Kim Citation2005). No information on fertiliser history, or on associated elements such as total phosphorus, was available that could have been used to test the relationship between fertiliser history and the current soil cadmium concentrations.
The statistical model used a conditional auto-regression (CAR) approach to identify correlation between neighbouring territorial authorities, which helped estimate soil cadmium concentrations in areas of territorial authorities that a low number of samples. The model only considered the main effects, without considering the interactions between the variables. This analysis was determined by the nature of the data. A key limitation was that the spatial location of the samples was not made available, but data were reported to the territorial authority level. This limitation prevented linking the dataset of external sources of information, such as geological maps, slope, land use, or climatic data that would have allowed estimation of cadmium concentrations across the landscape (Marchant et al. Citation2010). It was also not possible to link the datasets from the two companies and the regional councils, as different identifiers prevented the matching of properties. If it was possible to overcome the anonymity concerns, by developing an appropriate protocol to manage the data, this improvement would greatly increase the long-term value of the data. Soil cadmium may vary with paddock-scale variation in soil type, fertiliser history or topography (Schipper et al. Citation2011; Stafford et al. Citation2015), and location data would allow large-scale analysis of the influence of these factors. Precise locations would also allow the model to identify areas within districts that have higher soil cadmium concentrations. While Otorohanga and Matamata-Piako were identified as the districts with the highest mean estimated soil cadmium concentrations, it is likely that there will be areas within these districts that have generally higher soil cadmium concentrations, compared with other areas with lower soil cadmium concentrations. If precise location information cannot be provided to assess soil cadmium concentrations at a high spatial resolution, there may be value in dividing the territorial authorities with high cadmium concentrations into smaller reporting areas.
A recent study has shown that soil cadmium concentrations may vary within a single property (Stafford et al. Citation2015), with values ranging between 0.48 and 1.64 mg Cd/kg on a Waikato property that had been used for dairy farming since the 1950s. This variation was associated with variation in the total phosphorus concentration, in land slope, and in the soil type. Strong variation (of around 0.6–1.3 mg Cd/kg) was encountered within a single paddock. This variation was consistent with the statistical modelling that found, for example, that if a farm had a mean soil cadmium value of 1.0 mg Cd/kg, the values of soil cadmium in a single sample would have a 90% probability of being in the range 0.51–1.69 mg Cd/kg. Single samples may be over the TFMS tier 4 soil cadmium concentration threshold of 1.8 mg Cd/kg, but further sampling may show that the average values across the whole property are in a lower tier.
The data weakly constrained the overall rate of change of cadmium concentrations to be between the 95% c.i. of −2.2% to +1.2% per year (for the period between 2007 and 2015 included in the analysis). Analysis of long-term soil cadmium data from the Whatawhata Research Station, from between 1980 and 2010, found that cadmium has been either decreasing or increasing, depending on the rates of fertiliser application and hill slope (Schipper et al. Citation2011). Annual rates of change were between around −1% and +3%, with a decrease in cadmium concentration on the steeper slopes and at low fertiliser application rates. Schipper et al. (Citation2011) fitted a broken-stick model to their data, with higher slopes before the late 1980s, when the switch to lower-cadmium fertiliser occurred. Long-term data from the irrigation trials at Winchmore Research Station suggest that cadmium accumulation at this Canterbury site has continued since the early 1950s, with a close relationship between the total phosphorus fertiliser applied and the soil cadmium (McDowell Citation2012; Kelliher et al. Citation2017). The current analysis did not attempt to estimate variation in accumulation rate with region or land use, but estimated a single rate of increase across all the data. Out of the 1905 identifiable properties in the data, only 27 could be identified as having been sampled at different times. The TFMS recommends sampling every five years. When the industry data have been collected over a longer period, it would be appropriate to investigate the rate of change in soil cadmium in more detail.
The company data showed that fertiliser cadmium concentration has remained below the 280 mg Cd/kg P voluntary limit (apart from four slight exceedances, as discussed). Between 2003 and 2015, the mean concentration was 184 mg Cd/kg P. There will continue to be changes in the source rock used for manufacturing fertiliser, which will affect this ratio. Data from the Whatawhata Research Station (Schipper et al. Citation2011), shows that over the period when fertiliser cadmium concentrations have been lower, accumulation rates of soil cadmium concentrations at this site have decreased. Depending on fertiliser application rates and factors such as irrigation or local topography, soil cadmium concentrations may still be increasing (Schipper et al. Citation2011; McDowell Citation2012; Kelliher et al. Citation2017).
Based on an analysis of the industry soil data between 2006 and 2013, and by Cavanagh (Citation2014), several recommendations were made to improve the quality of the data. Some of these recommendations, such as collecting a customer code and improving the coverage of the sampling across New Zealand regions and main land use were followed. Cavanagh (Citation2014) recommended the collection of precise location information; however, to date this information has not been made available by the fertiliser companies, due to concerns for the anonymity of the participating farmers. In lieu of precise location, a more detailed land use and soil classification was proposed, but this information has not been collected. Collection of precise location would reduce the need for this metadata as it could then be consistently derived from external sources. Cavanagh (Citation2014) also recommended recording of longer-term farming practice. This recommendation could be addressed by collecting total phosphorus data, which is directly related to long-term fertiliser use. Collection of total phosphorus data is not necessary for the TFMS monitoring; however, these data would be valuable for any study that aims to understand variation in soil cadmium across the New Zealand landscape. I would also recommend that details of the sampling (such as number of cores and number of paddocks included) were recorded in the industry dataset. These records would allow clear identification of which samples were from single paddocks and which were combined composite samples from multiple paddocks, following TFMS guidelines.
The industry data, which is collected to support the application of the TFMS, is a unique large-scale dataset. It is the only dataset that is available for evaluating soil cadmium concentrations across the New Zealand agricultural landscape. As time passes, the value of these data will increase. With some improvements to the data collection, particularly collection of precise location information, collection of metadata describing the sampling protocol followed for each sample, and collection of ancillary information on total phosphorus to allow fertiliser history to be quantified, the long-term value of these data could be improved. I recommend that the industry revisit the recommendations raised by Cavanagh (Citation2014), in light of the information presented here, to keep developing this unique data collection programme.
Supplemental Material
Download MS Word (18.7 KB)Acknowledgements
Thanks to Greg Sneath of the Fertiliser Association of New Zealand (FANZ) for providing the industry soil cadmium data; to Jo Cavanagh (Landcare Research) for providing the soil cadmium data from the regional councils; and to Peter Wood (Quality Consultants of New Zealand) for the fertiliser cadmium data. I am also grateful to Philipp Neubauer (Dragonfly Data Science) for an introduction to using STAN for CAR modelling. An earlier analysis of this dataset was presented to the 2016 Fertilizer and Lime Research Centre workshop, and I am grateful to the many people who gave feedback following and during the preparation and presentation of the workshop paper. Thanks to Greg Sneath (Fertiliser Association) and Ants Roberts (Ravensdown) for comments on the draft manuscript.
Disclosure statement
No potential conflict of interest was reported by the author.
Additional information
Funding
Related Research Data
References
- Abraham E, Cavanagh J, Wood P, Pearson A, Mladenov P. 2016. Cadmium in New Zealand’s agriculture and food systems. In: Currie LD, Singh R, editors. Integrated nutrient and water management for sustainable farming. Occasional Report No. 29. Palmerston North, New Zealand: Massey University, Fertilizer and Lime Research Centre; p. 13.
- Cadmium Working Group. 2008. Report one: cadmium in New Zealand agriculture. Wellington: Ministry for Primary Industries. [accessed 2016 Mar 14]. https://www.mpi.govt.nz/document-vault/10079.
- Carpenter B, Gelman A, Hoffman MD, Lee D, Goodrich B, Betancourt M, Brubaker M, Guo J, Li P, Riddell A. 2017. Stan: a probabilistic programming language. Journal of Statistical Software. 76(1). Web. doi:10.18637/jss.v076.i01.
- Cavanagh J. 2014. Status of cadmium in New Zealand soils: 2014. Wellington: Fertiliser Association of New Zealand. [accessed 2016 Apr 1]. http://www.fertiliser.org.nz/includes/download.aspx?ID=134299.
- Drewry J. 2017. Soil quality state of the environment monitoring programme: annual data report 2016/17. Wellington: Greater Wellington Regional Council. Publication No GW/ESCI-T-17/101.
- Fertiliser Association of New Zealand. 2016. Tiered Fertiliser Management System – for the management of soil cadmium accumulation from phosphate fertiliser applications. Wellington: Fertiliser Association of New Zealand. [accessed 2018 Oct 24]. http://www.fertiliser.org.nz/tools/search.aspx?sect=Site.
- Fertiliser Quality Council. 2015. Code of practice for the sale of fertiliser in New Zealand. Wellington: Fertiliser Quality Council. [accessed 2016 Mar 14]. http://fertqual.co.nz/?ddownload=81
- Gelfand AE, Vounatsou P. 2003. Proper multivariate conditional autoregressive models for spatial data analysis. Biostatistics. 4(1):11–15.
- Gelman A, Hill J. 2006. Data analysis using regression and multilevel/hierarchical models. Cambridge: Cambridge University Press.
- Hill RB, Sparling GP. 2009. Land and soil monitoring: a guide for SoE and regional council reporting. In: New Zealand: land monitoring forum chapter 3, soil quality monitoring. New Zealand: Land Monitoring Forum. p. 28–89. https://www.mfe.govt.nz/sites/default/files/Land%20and%20soil%20monitoring__A_guide_for_SoE%20and%20regional%20council%20reporting.PDF
- Kelliher FM, Gray CW, Noble ADL. 2017. Superphosphate fertiliser application and cadmium accumulation in a pastoral soil. New Zealand Journal of Agricultural Research. 60:404–422. doi: 10.1080/00288233.2017.1363058
- Kim N. 2005. Cadmium accumulation in Waikato soils. Environment Waikato Technical Report 2005/51. Hamilton: Environment Waikato. 129 p. https://www.waikatoregion.govt.nz/assets/PageFiles/11184/TR2005-51.pdf.
- Land Monitoring Forum. 2009. Land and soil monitoring: a guide for SoE and regional council reporting. New Zealand: Land Monitoring Forum. [accessed 2018 October 24]. http://www.mfe.govt.nz/publications/land/land-and-soil-monitoring-guide-soe-and-regional-council%C2%A0reporting.
- Lawrence-Smith EJ, Tregurtha CS. 2013. Regional environmental monitoring programme for soil quality 2012–13: Arable & pastoral project – Final report. A report prepared for Environment Canterbury. Plant & Food Milestone No. 51731. Plant & Food Research Contract No. 29222. SPTS No. 9007.
- Loganathan P, Hedley MJ, Grace ND, Lee J, Cronin SJ, Bolan NS, Zanders JM. 2003. Fertiliser contaminants in New Zealand grazed pasture with special reference to cadmium and fluorine—a review. Soil Research. 41(3):501–532. doi: 10.1071/SR02126
- Marchant BP, Saby NPA, Lark RM, Bellamy PH, Jolivet CC, Arrouays D. 2010. Robust analysis of soil properties at the national scale: cadmium content of French soils. European Journal of Soil Science. 61(1):144–152. doi: 10.1111/j.1365-2389.2009.01212.x
- McDowell RW. 2012. The rate of accumulation of cadmium and uranium in a long-term grazed pasture: implications for soil quality. New Zealand Journal of Agricultural Research. 55:133–146. doi:10.1080/00288233.2012.662901.
- McDowell RW, Taylor MD, Stevenson BA. 2013. Natural background and anthropogenic contributions of cadmium to New Zealand soils. Agriculture, Ecosystems & Environment. 165:80–87. doi: 10.1016/j.agee.2012.12.011
- Roberts AHC, Longhurst RD, Brown MW. 1994. Cadmium status of soils, plants, and grazing animals in New Zealand. New Zealand Journal of Agricultural Research. 37:119–129. doi:10.1080/00288233.1994.9513048.
- Salmanzadeh M, Balks MR, Hartland A, Schipper LA. 2016. Cadmium accumulation in three contrasting New Zealand soils with the same phosphate fertilizer history. Geoderma Regional. 7(3):271–278. doi: 10.1016/j.geodrs.2016.05.001
- Schipper LA, Sparling GP, Fisk LM, Dodd MB, Power IL, Littler RA. 2011. Rates of accumulation of cadmium and uranium in a New Zealand hill farm soil as a result of long-term use of phosphate fertilizer. Agriculture, Ecosystems and Environment. 144(1):95–101. doi: 10.1016/j.agee.2011.08.002
- Sneath G. 2015. The Tiered Fertiliser Management System for managing soil cadmium in agricultural soils in New Zealand. In: Currie LD, Burkitt LL, editors. Moving farm systems to improved attenuation. Occasional Report No. 28. Palmerston North, New Zealand: Fertilizer and Lime Research Centre, Massey University; p. 13. http://flrc.massey.ac.nz/publications.html.
- Stafford A, Anderson CW, Hedley MJ. 2015. Spatial distribution of soil cadmium in a long-term waikato dairy farm. In: Currie LD, Burkitt LL, editors. Moving farm systems to improved attenuation. Occasional Report No. 28. Palmerston North, New Zealand: Fertilizer and Lime Research Centre, Massey University; p. 9. http://flrc.massey.ac.nz/publications.html.
- Stafford A, Cavanagh J, Roberts A. 2014. Soil cadmium – review of recent data in relation to the Tiered Fertiliser Management System. In: Currie LD, Christensen CLC, editors. Nutrient management for the farm, catchment and community. Occasional Report No. 27. Palmerston North, New Zealand: Fertiliser and Lime Research Center. Fertilizer and Lime Research Centre, Massey University; p. 8. http://flrc.massey.ac.nz/publications.html.
- Syers JK, Mackay AD, Brown MW, Currie LD. 1986. Chemical and physical characteristics of phosphate rock materials of varying reactivity. Journal of the Science of Food and Agriculture. 37(11):1057–1064. doi: 10.1002/jsfa.2740371102
- Taylor M, Gibb R, Willoughby J, Hewitt A, Arnold G. 2007. Soil maps of cadmium in New Zealand. Wellington: Ministry for Primary Industries. [accessed 2016 Mar 14]. https://www.mpi.govt.nz/document-vault/10082.
- Taylor MD. 1997. Accumulation of cadmium derived from fertilisers in New Zealand soils. Science of the Total Environment. 208(1-2):123–126. doi: 10.1016/S0048-9697(97)00273-8
- Vannoort RW, Thomson BM. 2009. New Zealand Total Diet Study: agricultural compound residues, selected contaminant and nutrient elements. Wellington: Ministry for Primary Industries. [accessed 2016 Mar 14]. http://www.foodsafety.govt.nz/elibrary/industry/total-diet-study.pdf.
- Vehtari A, Gelman A, Gabry J. 2016. LOO: efficient leave-one-out cross-validation and WAIC for bayesian models. R package version 0.1.6. https://github.com/jgabry/loo.
- Vehtari A, Gelman A, Gabry J. 2017. Practical Bayesian model evaluation using leave-one-out cross-validation and WAIC. Statistics and Computing. 27(5):1413–1432. doi: 10.1007/s11222-016-9696-4
- Warne MJ. 2011. Review of, and recommendations for, the proposed New Zealand Cadmium Management Strategy and Tiered Fertiliser Management System, MAF Technical Paper No: 2011/03, Prepared for the Cadmium Working Group. Wellington: Ministry for Primary Industries. [accessed 2016 Mar 14]. https://www.mpi.govt.nz/document-vault/3659.