
 ?Mathematical formulae have been encoded as MathML and are displayed in this HTML version using MathJax in order to improve their display. Uncheck the box to turn MathJax off. This feature requires Javascript. Click on a formula to zoom.
ABSTRACT
A lysimeter experiment was carried out to investigate the effects of applying readily available carbon (12 or 24 t sucrose ha−1) to soil on nitrogen (N) losses from cattle urine patches. The carbon (C) was readily available to microbes and was applied onto intact soil monolith lysimeters, containing stony silt loam soil, beneath either ryegrass (Lolium perenne)/white clover (Trifolium repens) pasture (RG/WC) or lucerne (Medicago sativa). Cow urine (700 kg N ha−1) was applied in early July 2017, two days after C application. The application of readily available C increased the immobilisation of N in the soil which reduced the amount of soil mineral N. The C-induced immobilisation of N reduced the ammonia oxidising bacteria population growth rate and the amount of nitrate leached by 51–89%. The addition of readily available C had no significant effect on nitrous oxide emissions. These findings were consistent under both RG/WC and lucerne.
Introduction
In traditional New Zealand dairy farming systems, cattle graze outside year round, depositing urine onto the soil. These urine patches have high loading rates of nitrogen (N) (700–1000 kg N ha−1) (Haynes and Williams Citation1993; Selbie et al. Citation2015). Nitrogen is a key nutrient needed for plant growth. However, the high rate of N deposited in urine often exceeds plant requirements. The excess N can be lost to the wider environment through nitrate () leaching and nitrous oxide (N2O) emissions (Selbie et al. Citation2015). The lost N can have serious negative environmental, health and economic impacts. The leached
can enter into waterways and ground water and causes eutrophication (Smith et al. Citation1999). Eutrophication leads to increased growth of algae and other aquatic plants, which can be unsightly and create problems for freshwater recreational activities. There is also a health risk from increased
concentrations (i.e. >11.3 ppm
) in drinking water (Grizzetti et al. Citation2011). The ingested
is converted into
in the stomach and this can be absorbed into the bloodstream reducing the blood’s oxygen carrying capacity, which can potentially cause death from cellular anoxia. The lost N must also be replaced by farmers through fertilisers adding an extra economic cost. Farm N2O emissions are also of great significance, as N2O is a potent greenhouse gas. The long term global warming potential of N2O is 265 times that of carbon dioxide (CO2) (Myhre et al. Citation2013; Pachauri et al. Citation2014). It has also been shown that N2O has become, and will remain, the biggest threat to the ozone layer in the twenty-first century (Ravishankara et al. Citation2009). It is therefore necessary to improve understanding of the factors that affect these N losses and develop potential strategies to reduce them.
In the past two decades there has been increasing intensification of agriculture in Canterbury, with large numbers of sheep farms converted to dairy farms (Dynes et al. Citation2010). However, in Canterbury the soil is predominately free draining, shallow and stony and therefore highly susceptible to N leaching (Carrick et al. Citation2013). A potential strategy for reducing N losses from agriculture is through the addition of carbon (C). Carbon interacts with the N cycle through immobilisation/mineralisation, nitrification, and denitrification. These interactions have the potential to be manipulated in ways that could reduce N losses from agricultural systems. Carbon can be added to the soil through plant root exudates. Plants can release nearly 25% of the C fixed photosynthetically into the rhizosphere (Marschner Citation1995; Walker et al. Citation2003; Stockmann et al. Citation2013). Carbon can also be added to the soil through artificial inputs. The application of artificial C inputs (e.g. sawdust, sucrose, glucose) have been used in some studies to increase the rate of N immobilisation and subsequently to reduce N leaching (Kanal Citation1995; Sarrantonio Citation2003; Chaves et al. Citation2005; Szili-Kovács et al. Citation2007; Chaves et al. Citation2008; Shepherd et al. Citation2010). Few studies have examined the combined effects of C addition on key soil processes (e.g. immobilisation, nitrification), soil microbial communities and N losses (e.g. leaching, N2O emissions) under animal urine patches.
This study therefore will determine the effect of adding C that is readily available to microbes on N losses ( leaching and N2O emissions) from urine treated soil and the effect of the C on the key soil processes of immobilisation and nitrification (including ammonia oxidising bacteria abundance) in urine patches. Sucrose was used as the source of C because it was readily available to microbes and allowed the trial results to be compared to other data reported in the literature (e.g. Shepherd et al. (Citation2010)). This study was carried out using monolith lysimeters and soil blocks, under two different crops: ryegrass/white clover (RG/WC) and lucerne. These two common crops have varying plant characteristics including different root depths, root exudates and winter growth rates (Baars et al. Citation1975; Evans Citation1978; McKenzie et al. Citation1990; Neumann and Römheld Citation2007).
Materials and methods
Lysimeter and soil block collection and installation
The experiment was conducted at the Lincoln University’s Ashley Dene Research and Development Station (ADRDS), near Lincoln, Canterbury (43°38′51.2″S 172°20′45.5″E; 17 m above sea level). For this experiment, 25 undisturbed soil monolith lysimeters, 500 mm in diameter and 700 mm deep, were used. Fifteen were collected from a perennial ryegrass (Lolium perenne) cv. ‘Prospect’/white clover (Trifolium repens) cv. ‘Legacy’ pasture (RG/WC) paddock (43°38′37.7″S 172°20′38.8″E), while the remaining 10 were collected from a lucerne (Medicago sativa) cv. ‘Stamina 5’ paddock (43°38′51.8″S 172°21′01.0″E). The lysimeters were collected in the summer of 2016/2017 following well-established protocols and procedures (Cameron et al. Citation1992). Between their collection and installation, the plants on the lysimeters were maintained to ensure they replicated typical paddock conditions. This was done through harvesting the pasture/lucerne with electric shears to simulate grazing, and watering of the lysimeters to simulate farm irrigation practices. Each lysimeter also had a corresponding soil block, 500 mm in diameter and 200 mm deep to allow periodic removal of soil samples. These soil blocks were collected in June 2017 from the same location as their corresponding lysimeters. The lysimeters/soil blocks were installed into a lysimeter trench facility at the ADRDS in June 2017. Once the lysimeters were installed, the area around them was back filled with sand at the lower depths and top soil around the top layer. The soil blocks sat on a bed of sand and were surrounded with top soil. The top soil was levelled to the same height as the soil in the lysimeters/soil blocks.
The soil in the lysimeters/soil blocks was a Lismore/Balmoral stony silt loam (Pallic Firm Brown soil) (Landcare Research Citation2016a, Citation2016b). This soil is very stony, shallow, free draining and typical of soils used for dairying in the Canterbury region of New Zealand. Soil samples were taken at depths of 0–100, 100–200, 200–300, 300–450 and 450–700 mm at both collection sites. The samples were placed in clear plastic bags, sealed, labelled and sent for a basic soil analysis at Analytical Research Laboratories (Ravensdown, New Zealand) ().
Table 1. Results of the basic soil analysis performed at the two lysimeter collection sites, at varying depths.
Fertiliser was applied to the RG/WC lysimeters and soil blocks on the 30 June 2017. Fertiliser was applied because the Olsen P value (15) and the pH (6) of the RG/WC soil (0–75 mm depth) test were lower than typical dairy farm fertility levels. Superphosphate (11 g lysimeter−1 equivalent to 555 kg ha−1) and hydrated lime (20 g lysimeter−1 equivalent to 1 t ha−1) was applied to each RG/WC lysimeter and soil block. The fertiliser was sprinkled evenly over the lysimeters/soil blocks. The fertiliser was washed in to the soil by applying 4 L of water per lysimeter or soil block. All the lucerne lysimeters/soil blocks had 4 L of water applied, to ensure identical moisture inputs.
A second application of hydrated lime (20 g lysimeter−1 equivalent to 1 t ha−1) was applied to the RG/WC lysimeters/soil blocks on the 18 September 2017. This lime was applied evenly over the lysimeters/soil blocks. The lime was applied during a rainfall event to ensure it was washed into the soil profile.
Experimental design
The experiment consisted of five treatments, with five replicates of each treatment (). There were two crop types; RG/WC and lucerne. The C source that was readily available to microbes was sucrose, applied at two different rates (rate 1 = 12 t sucrose ha−1 and rate 2 = 24 t sucrose ha−1) along with a no C treatment. C rate 2 was applied only to RG/WC. All lysimeters/soil blocks received urine at a rate of 700 kg N ha−1. The treatments were arranged in the trench facility at ADRDS using a randomised complete block design.
Table 2. Treatments applied to the lysimeters and soil blocks.
Treatments
Simulated grazing
On the 30 June, the RG/WC lysimeters/soil blocks were trimmed to a residual mass equivalent of 1500 kg DM/ha using electric shears, to simulate winter grazing. The lucerne lysimeters/soil blocks did not need to undergo harvesting as they had very little late autumn/winter growth.
Simulated trampling of the lysimeters/soil blocks was performed on the 3rd of July 2017. The soil in all lysimeters/soil blocks was trampled using cow hoof simulation equipment designed to provide approximately 200 kPa – similar to the pressure exerted by an adult cow hoof (Di et al. Citation2001). Each lysimeter/soil block received 6 stomps from the cow hoof.
Sucrose
The two rates of readily available C, 12 t sucrose ha−1 (equivalent to 5.1 t C ha−1) and 24 t sucrose ha−1 (equivalent to 10.1 t C ha−1), were applied according to the treatment design (). The sucrose was applied on the 2 July 2017; this allowed the microbial population time to consume the C (Johnson and Edwards Citation1979; Dalenberg and Jager Citation1981; Shepherd et al. Citation2010), before the urine was applied on the 4 July 2017. To apply the sucrose two master solutions were made. These solutions were made to concentrations (C rate 1 = 221.7 g sucrose L−1. C rate 2 = 443.4 g sucrose L−1) that allowed the intended rate of sucrose to be applied through the application of 1 L of solution to each lysimeter/soil block. This solution was applied using 2 × 500 mL bottles with rose head lids. Every lysimeter/soil block not receiving sucrose had 1 L of water applied, using an identical application method. This was performed to ensure the lysimeters/soil blocks received identical moisture inputs.
Urine collection and application
On the 3 June, urine was collected from 100 lactating Friesian/Jersey cross cows at the ADRDS. The cows’ diet consisted of RG/WC pasture (11 kg DM cow−1 d−1) and RG/WC baleage (4.5 kg cow−1 DM day−1). Samples of the urine (50 mL) were taken and analysed for N concentration, using an Elementar Vario-Max CN Elemental Analyser (Elementar GmbH, Hanau, Germany). The urine was stored overnight, in clean plastic barrels in a cool dark shed at the ADRDS. On the 4th of June, after receiving the results from the urine N concentration analyses, the urine was standardised to 6.9 g N L−1 using 703.1 g of urea in 125 L of urine. Each lysimeter/soil block had 2 L of the urine applied on the 4th of July 2017, at a rate equivalent to 700 kg N ha−1 using a rose head watering can, allowing an even spread of urine over the lysimeter/soil block.
Irrigation
A total of 470 mm of irrigation was applied to each lysimeter/soil block between the 4th of October 2017 and 3rd of April 2018. Irrigation was applied using a small scale pivot irrigation system at a rate of 5–10 mm per application. The irrigation scheduling simulated on farm practices to replace evapotranspiration losses.
Measurement methods
Leachate was collected from each lysimeter through plastic tubing attached to an outlet nozzle at the bottom of the lysimeters, leading to 10 L collection containers. Leachate was collected after each drainage event. Leachate volumes were measured and 50 mL samples were taken for chemical analysis. Samples were kept frozen at −20°C until they were analysed for ammonium () and
using a FOSS FIAstar 5000 twin channel analyser with SoFIA software version 2.00 (Gal et al. Citation2004). Leachate samples were also analysed for C content (Organic and Inorganic) using a Shimadzu Total Organic C analyser (TOC-5000A) fitted with a Shimadzu ASI-5000A autosampler.
Gas samples were collected using a closed chamber method similar to that described in Hutchinson and Mosier (Citation1981). The gas chambers were constructed from a metal cylinder insulated with 25 mm thick polystyrene foam to avoid heating of the atmosphere in the chamber during sampling. The chamber was placed inside a small water trough which was mounted around the top of each lysimeter casing. The chamber was placed there for 40 min during which time three 20 mL gas samples were collected, 20 min apart. The gas samples were collected using a syringe through a rubber septum on top of the gas chamber. Samples were collected twice weekly for the first three months after urine application and then once weekly for the fourth month after urine application. The N2O concentration of the gas samples was measured using a gas chromatograph (Model 8610C, SRI Instruments, California, USA) linked to a Gilson GX-271 autosampler (Gilson Inc, MI, USA).
The RG/WC lysimeters were harvested once plant development had reached the 2–3 leaf stage and yields were on average 3000 kg DM ha−1. The herbage was cut to a residual height of approximately 50 mm (1500 kg DM ha−1). The lucerne was harvested according to seasonal management information in Moot et al. (Citation2003), which resulted in six harvests. The pasture/lucerne was collected into paper bags. Dry matter production was determined gravimetrically after drying at 70°C for 72 h. The dry pasture/lucerne samples were then ground using a Retsch Ultra Centrifugal Mill ZM 200, with a 1 mm sieve and running at a speed of 18,000 rpm. The samples were stored in sealed 70 mL containers at room temperature in the dark, until analysis for their total N content using an Elementar Vario-Max CN Elemental Analyser (Elementar GmbH, Hanau, Germany).
Soil samples were taken from the soil blocks to elucidate the mechanisms involved in the transformation of soil mineral N. Samples were taken using a soil corer (100 mm depth, 75 mm diameter) on days 0, 1, 7, 14, 28, 56 and 112 after urine application. Holes remaining after core removal were immediately back-filled with a soil-sand mix and identified using plastic markers to prevent subsequent samplings occurring from that same position. The samples were stored at −80°C until analysis. To determine the soil mineral N ( and
) a potassium chloride (KCl) extract was performed on 5 g of field moist soil. This was performed by adding 25 mL of 2M KCL extraction solution to the sample. The sample was then shaken for 1 h on an end over end shaker, centrifuged at 4000 rpm for 3 min and then filtered through 110 mm Munktell Grade 393 filter paper funnels. The sample was frozen at −18°C until the concentration of
,
could be determined on a Lachat QuikChem 8500 Series 2 Flow Injection Analysis System (Lachat Instruments, Loveland, CO, USA).
In agricultural soil, nitrification is largely driven by soil ammonia oxidising bacteria (AOB) and ammonia oxidising archaea are not involved (Di et al. Citation2009). Therefore, DNA extraction and soil AOB ammonia monooxygenase (amoA) gene abundance was measured using quantitative polymerase chain reaction (qPCR), following methodologies adapted from Di et al. (Citation2009). DNA was extracted from the soil using a NucleoSpin® Soil kit (Macherey-Nagel, Düren, Germany) as per the manufacturer’s instructions. In brief, a 0.25 g soil sample was taken and placed in a NucleoSpin® Bead tube. To this, 700 µL of Buffer SL2 and 250 µL of Enhancer SX were added. The sample was then homogenised for 1 min using a FastPrep®-24 Sample Preparation System (M.P. Biomedicals, California, USA) at a speed of 6 m s−1. The sample was then centrifuged at 11,000 rpm for 2 min (Centrifuge 5424, Eppendorf AG, Hamburg, Germany). The supernatant was transferred into a sterilised 1.7 mL tube, to which a 150 µL of Buffer SL3 was added. The samples were then shaken for 5 s, incubated at 4°C for 5 min, then centrifuged at 11,000 rpm for 1 min. Up to 700 µL of supernatant was then transferred into a NucleoSpin® Inhibitor Removal Column fitted on top of a collection tube, and then centrifuged at 11,000 rpm for 1 min. The column was then discarded and 250 µL of Buffer SB was added to the flow through and mixed with a pipette. A 550 µL sample of this was pipetted onto a NucleoSpin® Soil Column on top of a clean collection tube. This was then centrifuged at 11,000 rpm for 1 min and the flow through was discarded. This step was repeated until no sample remained. Next, 500 µL of Buffer SB was added to the NuceloSpin® Soil Column and centrifuged for 30 s, with the flow through discarded. This process was then repeated with 550 µL of Buffer SW2, and then twice with 700 µL of Buffer SW2. After the final flow through was discarded, the column and collection tubes were then centrifuged at 11,000 rpm for 2 min, to ensure any residual ethanol was removed. The NuceloSpin® Soil Column was transferred to a new collection tube, to which 100 µL of Elution Buffer SE was added. The DNA was then eluted by incubating the samples at room temperature for 1 min and then centrifuging at 11,000 rpm for 30 s. DNA was then stored at −80°C for further analysis.
AOB amoA gene abundance was measured using real time qPCR on a Rotor-GeneTM 6000 (Corbett Research, Australia). All qPCR reactions were prepared using a CAS1200 Robotic liquid handling system (Corbett Robotics, Australia). The AOB amoA genes were quantified using the primer pairs amoA-1F (5′-GGGGHTTYTACTGGTGGT-3′) and amoA R-i (5′-CCCCTCNGNAAANCCTTCTTC-3′) (Hornek et al. Citation2006). A 16 µL reaction mixture contained 8 µL 2x SYBR® Premix Ex TaqTM (Tli RNaseH Plus, Takara Bio Inc., Shiga, Japan), 0.4 µL of each prime, and sterile deionised water to bring up to a total of 14.5 and 1.5 µL of DNA sample. The DNA samples were diluted 10 times with deionised water prior to use. Serial dilutions of standards with a range of 101–107 copies µL−1 were run in duplicate to produce standard curves. Once the PCR reactions were prepared the RotorDiscTM 100 was sealed using a Gene-DiscTM Heat Sealer (HS-01, Corbett Research, Australia). The qPCR temperature profiles used are given in . After amplification a melting curve analysis was performed to check for nonspecific amplification products. The florescence was measured continuously as the temperature gradually increased from 72°C to 99°C. Data were then analysed using the Rotor-GeneTM series software 1.7.
Table 3. Cycling conditions for PCR reactions (Di et al. Citation2009)
Standard curves for real time qPCR were created using the following process: Bacterial amoA gene was amplified from the extracted DNA using the previously mentioned primers. A PCR clean up kit (Axygen) was then used to purify the PCR products which were then cloned into the pGEM-T Easy Vector (Promega, Madison, WI). Following the manufacturers’ instructions, the resulting clones were transformed in Escherichia coli JM109 competent cells (Promega). The transformed E.coli cells were grown on solid LB plates at 37°C overnight. Ten to fifteen bacterial colonies from the plate were then individually inoculated into a 3 mL LB broth medium and incubated overnight in an orbital incubator – shaker at 37°C and 250 rpm. Using a QIA Prep spin Miniprep Kit (Qiagen, Crawley, UK) the plasmids carrying correct the gene inserts were execrated. The DNA concentration was determined on a QubitTM Fluorometer (InvitrogenTM, New Zealand). The copy number of target genes were then calculated directly from the concentration of purified DNA. To produce an external standard curve, tenfold serial dilutions of a known copy number of the PCR amplifications were then subjected to real-time PCR assay in duplicate.
Statistical analysis
The data sets were subject to analysis of variance (ANOVA) using Genstat (18th edition, VSN International Ltd.). The C leaching data set was log transformed to ensure homogeneity of residual errors. For each ANOVA, orthogonal contrasts (2 × 2 factorial) were used to determine the significance of the main effect of crop type (lucerne vs RG/WC) and of C application (no C input vs C rate 1) and their interaction (crop x C application). An additional contrast was used to determine if there was an effect of increasing the C rate for RG/WC, from C rate 1 to C rate 2.
Results
Climate conditions and water inputs
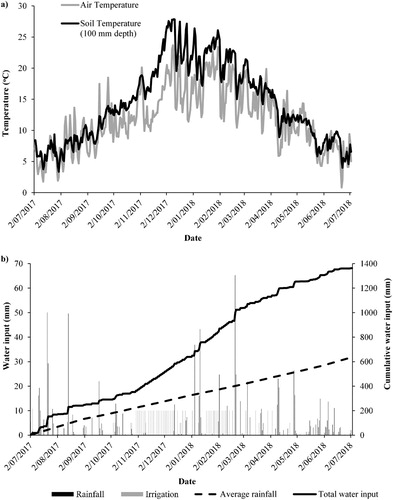
Over the experimental period (4 July 2017–3 July 2018), the average daily air temperature ranged from a high of 23.7°C in December 2017 to a low of 0.8°C in June 2018 (A). Daily average soil temperature (100 mm depth) ranged from a low of 3.4°C in July 2017 to a high of 27.9°C in December 2017 (A). Water inputs over the 12 month experimental period totalled 1363 mm, comprising 877 mm of rainfall, 470 mm of irrigation and 16 mm of water input from treatments (B). The 12 month period had higher rainfall than the average (618 mm), due to a very wet winter in 2017 (Macara Citation2016).
Figure 1. A, Average daily air temperature and soil temperature (at 100 mm), and B, daily rainfall, irrigation water inputs and cumulative water input over the experimental period (4 July 2017–3 July 2018), and long-term average rainfall data (1971–2000, Lincoln weather station 4881).
Leaching losses
Nitrate leaching losses
The effect of applying readily available C on the concentration in the leachate and the total amount of
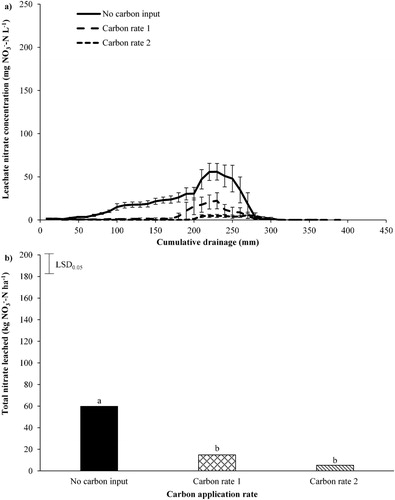
leached, under RG/WC pasture with urine applied is shown in . A complete
leaching breakthrough curve under the RG/WC is shown in A, with
concentrations peaking at 55.9, 22.3 and 5.5 mg
under the no C input, C rate 1 (12 t sucrose ha−1) and C rate 2 (24 t sucrose ha−1) treatments, respectively. These
concentration peaks occur between 230−270 mm of cumulative drainage. The application of C rate 1 (12 t sucrose ha−1) and C rate 2 (24 t sucrose ha−1) significantly reduced the amount of
leaching by 75% and 91%, respectively (B).
Figure 2. A, The average nitrate concentration in leachate plotted against cumulative drainage (mm) and B, total nitrate leached over the sampling period (4 July 2017–17 May 2018), under ryegrass/white clover pasture. A, Error bars are standard error of the mean (n = 5). B, Least significant difference (LSD) is at the 5% level (n = 5). LSD = 18.9. Bars with a letter in common are not significantly different at the 5% level.
The effect of C application on concentration and total
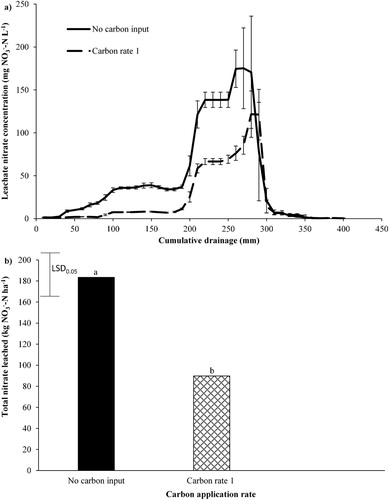
leached under lucerne with urine applied, is shown in . A complete
leaching breakthrough curve under the lucerne is shown in A, with
concentrations peaking at 175.2 and 121.6
for no C input and C rate 1 treatments, respectively. These
concentration peaks occur at 270 mm of cumulative drainage. The application of C rate 1 significantly decreased (51%) total
leaching (B).
Figure 3. A, The average nitrate concentration in leachate plotted against cumulative drainage (mm) and B, total nitrate leached over the sampling period (4 July 2017–17 May 2018) under lucerne. A, Error bars are standard error of the mean (n = 5). B, Least significant difference (LSD) is at the 5% level (n = 5). LSD = 46.2. Bars with a letter in common are not significantly different at the 5% level.
Total leaching losses
The effects of each treatment on total ,
, mineral N, log transformed carbon leached over the sampling period (4 July 2017–17 May 2018) and the total amount of annual drainage (4 July 2017–3 July 2018) are shown in . There was a significant effect of crop type (P < 0.001) and C rate 1 (P = 0.039) on
leaching. Lucerne had greater
leaching loss compared with RG/WC and the application of C rate 1 decreased
leaching. However, the total amount of
leached under the C rate 2 treatment was not significantly different from the other two RG/WC treatments (no C input and C rate 1). There was a significant effect of crop type (P < 0.001) and C rate 1 (P < 0.001) on mineral N leaching. Lucerne had greater mineral N leaching loss compared with RG/WC and the application of C at rate 1 decreased mineral N leaching. The application of C was shown to significantly increase the amount of total C leached (P < 0.001). Crop type had no significant effect on total C leached (P = 0.098). There was no significant difference in total annual drainage among the treatments.
Table 4. The effect each treatment had on total nitrate, ammonium, mineral N and log transformed total carbon leached (brackets contain back transformed means) over the sampling period (4 July 2017–17 May 2018) and the total amount of annual drainage (4 July 2017–3 July 2018).
Nitrous oxide emissions
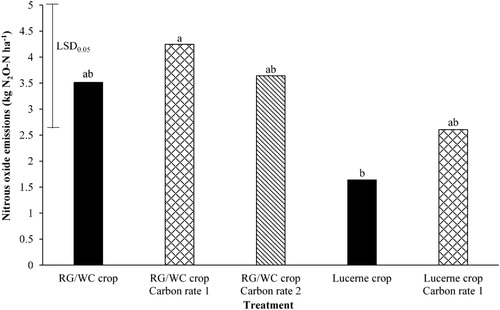
The effect of each treatment on total N2O-N emissions over the sampling period are shown in . There was a significant (P = 0.04) main effect of crop type (RG/WC vs lucerne), with the RG/WC having significantly higher N2O emissions than lucerne. The application of sucrose appears to have slightly increased N2O emissions, however, there was no significant main effect of C application (no C input vs C rate 1) (P = 0.205) on N2O-N emissions. There was no significant interaction between crop x C application (P = 0.297). For RG/WC, there was no significant difference in N2O-N emissions between C rate 1 and 2 (P = 0.596).
Figure 4. The effect of different treatments on nitrous oxide emissions over the sampling period (4 July–31 October. Least significant difference (LSD) is at the 5% level (n = 5). LSD = 2.36. Bars with a letter in common are not significantly different at the 5% level.
Herbage yield and nitrogen uptake
Yield
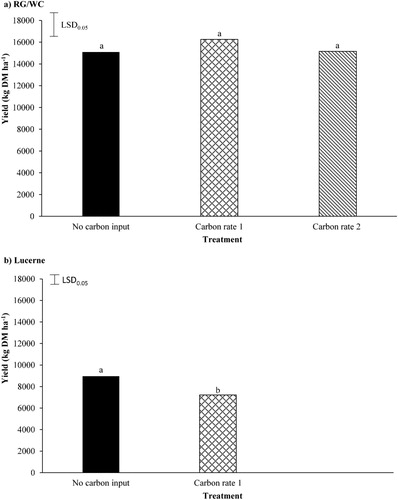
The application of C had no signifcant effect on RG/WC yield (A), with the RG/WC pasture treatments producing annual DM yields between 15,095 and 16,253 kg DM ha−1. However, the application of C signifcantly (P = 0.008) reduced lucerne yield by 19% (B). The lucerne yeild dropped from 8,961 kg DM ha−1 under the no C input, to 7,222 kg DM ha−1 under the C rate 1 treatment.
Figure 5. A, The effect carbon application (Carbon rate 1 = 12 t sucrose ha−1; Carbon rate 2 = 24 t sucrose ha−1) had on annual ryegrass/white clover (RG/WC) yield and B, the effect carbon application had on annual lucerne yield. Least significant difference (LSD) is at the 5% level (n = 5). RG/WC LSD = 2130. Lucerne LSD = 974. Bars with a letter in common are not significantly different at the 5% level.
Plant nitrogen uptake
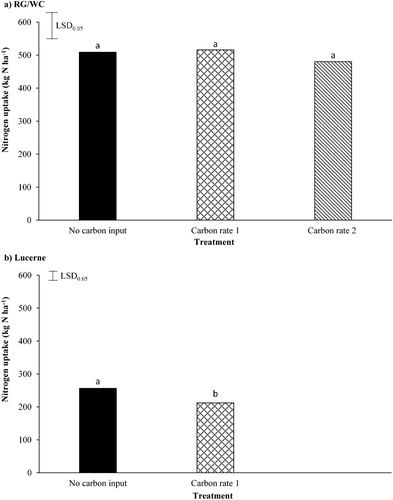
The application of C had no signifcant effect on total N uptake by the RG/WC (A), with the RG/WC pasture treatments having an annual plant N uptake of between 480.3 and 515.9 kg N ha−1. However, the application of C signifcantly (P = 0.011) reduced total N uptake by the lucerne N by 17% (B). The lucerne plant N uptake dropped from 256.2 kg N ha−1 under the no C input, to 212.1 kg N ha−1 under the C rate 1 treatment.
Figure 6. A, The effect carbon application (Carbon rate 1 = 12 t sucrose ha−1; Carbon rate 2 = 24 t sucrose ha−1) had on ryegrass/white clover (RG/WC) total annual nitrogen (N) uptake and B, the effect sucrose application had on lucerne total annual N uptake. Least significant difference (LSD) is at the 5% level (n = 5). RG/WC LSD = 79.1. Lucerne LSD = 26.8. Bars with a letter in common are not significantly different at the 5% level.
Soils
Mineral N
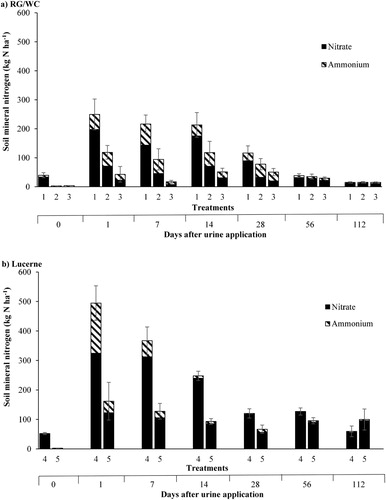
The effect of the C applications on total soil mineral N (), over the first 112 days of the sampling period, under RG/WC and lucerne crops is shown in A and B. The large increase in soil mineral N from day 0 to day 1 is due to the application of urinary-N. Thereafter, a continual decrease in soil mineral N was observed, under both RG/WC and lucerne. Averaging over the period from day 1–28 after urine application using the trapezoid rule to calculate the area under the curve (AUC), the application of C significantly reduced the total amount of soil mineral N under both RG/WC (P = 0.002) and lucerne (P = 0.001).
Figure 7. The effect different rates of carbon application (Carbon rate 1 = 12 t sucrose ha−1; Carbon rate 2 = 24 t sucrose ha−1) had on the soil mineral nitrogen () over the sampling period (4 July 2017–24 October 2017), under B, Ryegrass/white clover (RG/WC) and B, Lucerne. Soil samples were taken from 0–100 mm depth. Treatments: 1 = RG/WC crop, no carbon input. 2 = RG/WC crop, carbon rate 1. 3 = RG/WC crop, carbon rate 2. 4 = Lucerne crop, no carbon input. 5 = Lucerne crop, carbon rate 1. Error bars are standard error of the mean for total mineral nitrogen (n = 5).
AOB gene abundance
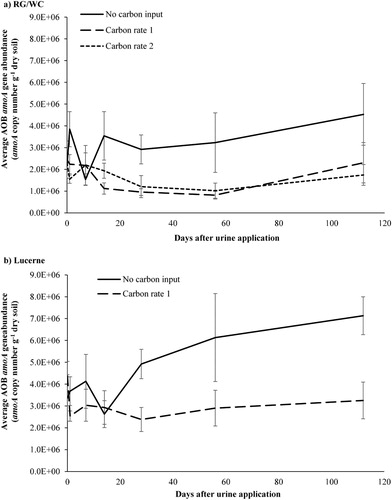
The effect of different rates of C application on soil AOB amoA gene abundance under RG/WC and lucerne, over the first 112 days after urine application is shown in A and B. After day 14, the AOB population was consistently lower for the C treatments compared to the control treatment for both RG/WC and lucerne. However, the AOB population was not affected by the rate of C addition (A). Using the AUC for the first 112 days after urine application, the C treatments had significantly lower AOB amoA gene abundance, under both RG/WC (P = 0.001) and lucerne (P = 0.009).
Figure 8. The effect carbon application (Carbon rate 1 = 12 t sucrose ha−1; Carbon rate 2 = 24 t sucrose ha−1) had on soil AOB amoA gene copies in A, ryegrass/white clover (RG/WC) soil and B, lucerne soil, over the first 112 days after urine application. Samples were taken from 0–100 mm depth in the soil profile. Error bars are standard error of the mean (n = 5).
Discussion
In this experiment the application of C (sucrose) was shown to reduce the amount of soil mineral N (both and
) under both RG/WC and lucerne (A and B). This is attributed to immobilisation of N, especially in the C treated soil. This is consistent with literature that suggests that adding a C source that is readily available to microbes, increases immobilisation of mineral N (Johnson and Edwards Citation1979; Vinten et al. Citation2002; Rahn et al. Citation2003; De Neve et al. Citation2004; Eschen et al. Citation2007; Szili-Kovács et al. Citation2007; Rahn et al. Citation2009; Shepherd et al. Citation2010). The results of this experiment also showed that there was an inhibition of the AOB population growth when C was applied, under both RG/WC and lucerne crops, compared with the no C input treatments (A and B). The inhibition of AOB population growth was likely due to the decrease in the amount of soil mineral
available to the microbes, under the C applied treatments (A and B). AOB are autotrophic bacteria and obtain their energy from the oxidation of
(Kowalchuk and Stephen Citation2001; Norton et al. Citation2002). The reduction in the amount of
due to immobilisation, the AOB’s energy source, would likely have limited the AOB’s population growth in the C treated soil. This lower amount of
and the limitation of AOB population growth reduced the amount of
produced, compared with the non C treatments.
The addition of readily available C to soil reduced the amount of leaching under the urine treatments ( and ). This reduction in
leaching loss was observed under both lucerne and RG/WC treatments. There was a 51% decrease in
leaching loss when C was applied at rate 1 under lucerne (). Under the RG/WC pasture, C rate 1 (12 t sucrose ha−1) and C rate 2 (24 t sucrose ha−1) reduced
leaching by 75% and 91%, respectively (). These reductions in
leaching loss are slightly higher than those reported by Shepherd et al. (Citation2010), who reported reductions of 44% and 82% under C application rates of 12 t sucrose ha−1 and 24 t sucrose ha−1, respectively. The greater reductions in
leaching losses from this study compared with Shepherd et al. (Citation2010) may be due to the timing of C application relative to the urine application. In this study, the C was applied 2 days before urine application, allowing the microbial population time to consume some of the C before urine application. In contrast, in Shepherd et al. (Citation2010) the C was applied immediately after urine application.
The application of C rate 1 to soil also reduced the amount of leached under the urine treated soil (P = 0.039), with the application of C rate 1 reducing
leaching by 22% and 27% under RG/WC and lucerne, respectively. However, the total amount of
leached under the C rate 2 treatment was not significantly different from the other two RG/WC treatments (no C input and C rate 1). The relatively large amounts of
leached in this experiment were attributed to the shallow stony soil type and the high levels of rainfall and drainage occurring after urine application (Carey et al. Citation2017).
The reductions in the amounts of and
leached under the C applications were attributed to the increased biological immobilisation of N in the soil. This decrease in
and
availability (A and B), due to increased immobilisation, removed mineral N from the soil solution resulting in less mineral N being susceptible to leaching (Rahn et al. Citation2009; Shepherd et al. Citation2010).
The application of C significantly reduced total annual dry matter yield (B) and N uptake (B) by the lucerne. This reduction in growth and N uptake was attributed to the reduction in the amount of soil mineral N as a result of immobilisation (A and B). However, under the RG/WC crop there was no significant difference in total annual dry matter yield (A) and N uptake (A) among the C treatments. This lack of an effect of added C in the RG/WC compared with the lucerne was attributed to different plant characteristics such as: greater autumn and winter activity of the RG/WC which captured more N from the urine treatment than the lucerne, and a more fibrous root system (Baars et al. Citation1975; Evans Citation1978; McKenzie et al. Citation1990).
The RG/WC treatments leached significantly less mineral N (both and
) than the lucerne treatments (P < 0.001). This is attributed to higher autumn and winter plant growth rates of the RG/WC compared to lucerne (Baars et al. Citation1975; Woods et al. Citation2016), with lucerne having negligible winter growth (Teixeira Citation2006). This is again consistent with literature which highlights the importance of winter growth on reducing N leaching (Crush et al. Citation2005; Teixeira Citation2006; Nichols and Crush Citation2007; Popay and Crush Citation2010; Moir et al. Citation2013; Malcolm et al. Citation2014; Malcolm et al. Citation2015; Carey et al. Citation2017).
The main factor affecting N2O-N emissions in this trial was the crop type, with the RG/WC treatments emitting more N2O-N than the lucerne treatments (P = 0.04). The lower N2O-N emission under the lucerne is attributed to the smaller amount of mineral N in the top soil under lucerne because of the large leaching loss that occurred. This increase in N leaching reduced the N available in the soil that can undergo denitrification and subsequently be lost as N2O-N.
In contrast to previous studies (Bremner and Shaw Citation1958; Burford and Bremner Citation1975), the application of C was found to have no significant effect on N2O-N emissions (P = 0.205). The addition of C to soil is thought to provide the organic C needed by soil denitrifiers for growth and respiration. However, due to the high rates of immobilisation of N under the C applied treatments in this study, there was less soil available to denitrify (). However, the lower N2O-N emissions in the C treatments might also be due to enhanced complete denitrification to N2.
This study has established that the application of readily available C can have significant effects on N transformations and consequently reduce N leaching losses from soil under urine patches, while not significantly increasing N2O emissions. With plants potentially releasing nearly 25% of the C they fix photosynthetically into the rhizosphere (Marschner Citation1995; Walker et al. Citation2003; Stockmann et al. Citation2013), there is an opportunity for further work to be done on using C inputs from plants to reduce N losses. Identifying plants that sequester C or release important C based compounds (e.g. biological nitrification inhibitors) could be a viable area of research that could result in the tightening of the N cycling in farm systems.
Conclusions
The main conclusion of the research was that adding readily available C to soil can significantly reduce N leaching losses without causing an increase in N2O emissions. This was attributed to the added carbon increasing immobilisation of N in the soil.
Acknowledgements
This research was completed as a part of the ‘Reducing Nitrogen Losses from Farms’ programme with principal funding from the New Zealand Ministry of Business, Innovation and Employment (MBIE, contract C09X1610). The programme is in a partnership between Manaaki Whenua – Landcare Research, Lincoln University, Plant & Food Research and Scion. The authors also wish to thank the technical staff involved in this experiment; Trevor Hendry, Roger Atkinson, Jeneth Hendry, Shelagh Bassett (Lincoln University), Carina Davis (Manaaki Whenua – Landcare Research), Steven Dellow (Plant & Food Research), the Ashley Dene Research and Development Station staff, and Dave Saville (Saville Statistical Consulting Ltd) for advice and guidance with statistical analysis.
Disclosure statement
No potential conflict of interest was reported by the authors.
Additional information
Funding
References
- Baars J, Radcliffe J, Brunswick L. 1975. VI. Wairakei, pasture and lucerne production. New Zealand Journal of Experimental Agriculture. 3(3):253–258.
- Bremner J, Shaw K. 1958. Denitrification in soil. II. Factors affecting denitrification. The Journal of Agricultural Science. 51(01):40–52.
- Burford J, Bremner J. 1975. Relationships between the denitrification capacities of soils and total, water-soluble and readily decomposable soil organic matter. Soil Biology and Biochemistry. 7(6):389–394.
- Cameron KC, Smith N, McLay C, Fraser PM, McPherson R, Harrison D, Harbottle P. 1992. Lysimeters without edge flow: an improved design and sampling procedure. Soil Science Society of America Journal. 56(5):1625–1628.
- Carey P, Cameron K, Di H, Edwards G. 2017. Comparison of nitrate leaching from oats and Italian ryegrass catch crops following simulated winter forage grazing: a field lysimeter study. New Zealand Journal of Agricultural Research. 60(3):298–318.
- Carrick S, Palmer D, Webb T, Scott J, Lilburne L. 2013. Stony soils are a major challenge for nutrient management under irrigation development. In: Currie LD, Christensen CL, editors. Accurate and efficient use of nutrients on farms. http://flrc.massey.ac.nz/publications.html. Occasional Report 26. Palmerston North: New ZealandFertilizer & Lime Research Centre, Massey University; 8 p.
- Chaves B, De Neve S, Boeckx P, Dupont R, Van Cleemput O, Hofman G. 2008. Manipulating the N release from 15 N-labelled celery residues by using straw and vinasses in Flanders (Belgium). Agriculture, Ecosystems & Environment. 123(1):151–160.
- Chaves B, De Neve S, Boeckx P, Van Cleemput O, Hofman G. 2005. Screening organic biological wastes for their potential to manipulate the N release from N-rich vegetable crop residues in soil. Agriculture, Ecosystems & Environment. 111(1–4):81–92.
- Crush J, Waller J, Care D. 2005. Root distribution and nitrate interception in eleven temperate forage grasses. Grass and Forage Science. 60(4):385–392.
- Dalenberg J, Jager G. 1981. Priming effect of small glucose additions to 14C-labelled soil. Soil Biology and Biochemistry. 13(3):219–223.
- De Neve S, Sáez SG, Daguilar BC, Sleutel S, Hofman G. 2004. Manipulating N mineralization from high N crop residues using on-and off-farm organic materials. Soil Biology and Biochemistry. 36(1):127–134.
- Di H, Cameron K, Milne J, Drewry J, Smith N, Hendry T, Moore S, Reijnen B. 2001. A mechanical hoof for simulating animal treading under controlled conditions. New Zealand Journal of Agricultural Research. 44(1):111–116.
- Di H, Cameron K, Shen JP, Winefield C, O’Callaghan M, Bowatte S, He J. 2009. Nitrification driven by bacteria and not archaea in nitrogen-rich grassland soils. Nature Geoscience. 2(9):621–624.
- Dynes R, Burggraaf V, Goulter C, Dalley D. 2010. Canterbury farming: production, processing and farming systems. Proceedings of the New Zealand Grassland Association; p 1–8.
- Eschen R, Mortimer SR, Lawson CS, Edwards AR, Brook AJ, Igual JM, Hedlund K, Schaffner U. 2007. Carbon addition alters vegetation composition on ex-arable fields. Journal of Applied Ecology. 44(1):95–104.
- Evans PS. 1978. Plant root distribution and water use patterns of some pasture and crop species. New Zealand Journal of Agricultural Research. 21(2):261–265.
- Gal C, Frenzel W, Möller J. 2004. Re-examination of the cadmium reduction method and optimisation of conditions for the determination of nitrate by flow injection analysis. Microchimica Acta. 146(2):155–164.
- Grizzetti B, Bouraoui F, Billen G, van Grinsven H, Cardoso AC, Thieu V, Garnier J, Curtis C, Howarth R, Johnes P. 2011. Nitrogen as a threat to European water quality. In: Sutton MA, Howard CM, Erisman JW, Billen G, Bleeker A, Grennfelt P, van Grinsven H, Grizzetti B, editors. European Nitrogen assessment. Cambridge: Cambridge University Press; p. 379–404.
- Haynes R, Williams P. 1993. Nutrient cycling and soil fertility in the grazed pasture ecosystem. Advances in Agronomy. 49:119–199.
- Hornek R, Pommerening-Röser A, Koops H-P, Farnleitner AH, Kreuzinger N, Kirschner A, Mach RL. 2006. Primers containing universal bases reduce multiple amoA gene specific DGGE band patterns when analysing the diversity of beta-ammonia oxidizers in the environment. Journal of Microbiological Methods. 66(1):147–155.
- Hutchinson G, Mosier A. 1981. Improved soil cover method for field measurement of nitrous oxide fluxes. Soil Science Society of America Journal. 45(2):311–316.
- Johnson D, Edwards N. 1979. The effects of stem girdling on biogeochemical cycles within a mixed deciduous forest in eastern Tennessee. Oecologia. 40(3):259–271.
- Kanal A. 1995. Effect of incorporation depth and soil climate on straw decomposition rate in a loamy Podzoluvisol. Biology and Fertility of Soils. 20(3):190–196.
- Kowalchuk GA, Stephen JR. 2001. Ammonia-oxidizing bacteria: a model for molecular microbial ecology. Annual Reviews in Microbiology. 55(1):485–529.
- Landcare Research. 2016a. S-map Soil Report. Balmoralf. https://smap.landcareresearch.co.nz/report.aspx?access=Spatial&type=smap&report=S-map%20customised%20report&gis=PandD&rank=2&mapunitsymbol=a27c&confidence=M&xcoord=5167668.5575589&ycoord=1546335.3371147.
- Landcare Research. 2016b. S-map Soil Report. Lismoref. http://smap.landcareresearch.co.nz/report.aspx?access=Spatial&type=smap&report=S-map%20customised%20report&gis=PandD&rank=1&mapunitsymbol=a27c&confidence=M&xcoord=5167297.6109825&ycoord=1547273.0223237.
- Macara GR. 2016. The Climate and Weather of Canterbury. NIWA Science and Technology Series Number 68. NIWA.
- Malcolm B, Cameron K, Di H, Edwards G, Moir J. 2014. The effect of four different pasture species compositions on nitrate leaching losses under high N loading. Soil Use and Management. 30(1):58–68.
- Malcolm B, Moir J, Cameron K, Di H, Edwards G. 2015. Influence of plant growth and root architecture of Italian ryegrass (Lolium multiflorum) and tall fescue (Festuca arundinacea) on N recovery during winter. Grass and Forage Science. 70(4):600–610.
- Marschner H. 1995. 15 - The soil-root interface (rhizosphere) in relation to mineral nutrition. mineral nutrition of higher plants, 2nd ed. London: Academic Press; p. 537–595.
- McKenzie BA, Gyamtsho P, Lucas RJ. 1990. Productivity and water use of lucerne and two lucerne-grass mixtures in Canterbury. Proceedings of the New Zealand Grassland Association. 52:35–39.
- Moir J, Edwards G, Berry L. 2013. Nitrogen uptake and leaching loss of thirteen temperate grass species under high N loading. Grass and Forage Science. 68(2):313–325.
- Moot D, Brown HE, Teixeira E, Pollock K. 2003. Crop growth and development affect seasonal priorities for lucerne management. In: Moot DJ, editor. Legumes for dryland pastures. Lincoln: New Zealand Grassland Association, Research and Practice Series 11; p. 201–208.
- Myhre G, Shindell D, Bréon F-M, Collins W, Fuglestvedt J, Huang J, Koch D, Lamarque J-F, Lee D, Mendoza B. 2013. Anthropogenic and natural radiative forcing. Climate Change. 423:658–740.
- Neumann G, Römheld V. 2007. The release of root exudates as affected by the plant physiological status. The Rhizosphere: Biochemistry and Organic Substances at the Soil-Plant Interface. 2:23–72.
- Nichols S, Crush J. 2007. Selecting forage grasses for improved nitrate retention-a progress report. Proceedings of the Conference-New Zealand Grassland Association. 69:207–211.
- Norton JM, Alzerreca JJ, Suwa Y, Klotz MG. 2002. Diversity of ammonia monooxygenase operon in autotrophic ammonia-oxidizing bacteria. Archives of Microbiology. 177(2):139–149.
- Pachauri RK, Allen MR, Barros VR, Broome J, Cramer W, Christ R, Church JA, Clarke L, Dahe Q, Dasgupta P. 2014. Climate change 2014: synthesis report. Contribution of Working Groups I, II and III to the fifth assessment report of the Intergovernmental Panel on Climate Change, IPCC.
- Popay A, Crush J. 2010. Influence of different forage grasses on nitrate capture and leaching loss from a pumice soil. Grass and Forage Science. 65(1):28–37.
- Rahn C, Bending GD, Lillywhite R, Turner MK. 2009. Co-incorporation of biodegradable wastes with crop residues to reduce nitrate pollution of groundwater and decrease waste disposal to landfill. Soil Use and Management. 25(2):113–123.
- Rahn C, Bending GD, Turner M, Lillywhite R. 2003. Management of N mineralization from crop residues of high N content using amendment materials of varying quality. Soil Use and Management. 19(3):193–200.
- Ravishankara A, Daniel JS, Portmann RW. 2009. Nitrous oxide (N2O): the dominant ozone-depleting substance emitted in the 21st century. Science. 326(5949):123–125.
- Sarrantonio M. 2003. Soil response to surface-applied residues of varying carbon-nitrogen ratios. Biology and Fertility of Soils. 37(3):175–183.
- Selbie DR, Buckthought LE, Shepherd MA. 2015. Chapter four - the challenge of the urine patch for managing nitrogen in grazed pasture systems. In: Donald LS, editor. Advances in Agronomy. New York: Academic Press; p. 229–292.
- Shepherd M, Menneer J, Ledgard S, Sarathchandra U. 2010. Application of carbon additives to reduce nitrogen leaching from cattle urine patches on pasture. New Zealand Journal of Agricultural Research. 53(3):263–280.
- Smith VH, Tilman GD, Nekola JC. 1999. Eutrophication: impacts of excess nutrient inputs on freshwater, marine, and terrestrial ecosystems. Environmental Pollution. 100(1–3):179–196.
- Stockmann U, Adams MA, Crawford JW, Field DJ, Henakaarchchi N, Jenkins M, Minasny B, McBratney AB, De Courcelles V, Singh K. 2013. The knowns, known unknowns and unknowns of sequestration of soil organic carbon. Agriculture, Ecosystems & Environment. 164:80–99.
- Szili-Kovács T, Török K, Tilston EL, Hopkins DW. 2007. Promoting microbial immobilization of soil nitrogen during restoration of abandoned agricultural fields by organic additions. Biology and Fertility of Soils. 43(6):823–828.
- Teixeira EI. 2006. Understanding growth and development of lucerne crops (Medicago sativa L.) with contrasting levels of perennial reserves [unpublished thesis]. Lincoln University.
- Vinten AJ, Whitmore A, Bloem J, Howard R, Wright F. 2002. Factors affecting N immobilisation/mineralisation kinetics for cellulose-, glucose-and straw-amended sandy soils. Biology and Fertility of Soils. 36(3):190–199.
- Walker TS, Bais HP, Grotewold E, Vivanco JM. 2003. Root exudation and rhizosphere biology. Plant Physiology. 132(1):44–51.
- Woods R, Cameron K, Edwards G, Di H, Clough T. 2016. Effects of forage type and gibberellic acid on nitrate leaching losses. Soil Use and Management. 32(4):565–572.