ABSTRACT
Herbicide resistance has repeatedly developed under intensive herbicidal weed management regimes globally with 255 species having resistant biotypes. In New Zealand, since 1979, resistance was found in 13 taxa, with >25 herbicides in 8 chemical classes showing reduced effectiveness (i.e. HRAC groups A, B, C, D, F, G, H, N and O). Cases included weeds in turf, pastures, orchards, vineyards, forage and arable crops. Surprisingly little is known about the spatial extent or frequency of this problem in New Zealand. We estimate that 14,000 farms have land-use histories like those favouring herbicide resistance historically. Sampling simulations of ≥10% farms provided good estimates of resistance prevalence for most regions and crop types. Acceptable sampling rates varied with target population size, actual resistance prevalence, and detection certainty. Our simulations provide a sobering caution regarding our ability to delimit the problem cheaply or accurately. Detection rates lower than 75% always give imprecise prevalence estimates. Sampling and screening involved 7.4 h labour and 27 km of travel costing $759 NZD per farm. Sampling 10% of farms would cost >$1 million NZD if lower risk farms were excluded, or >$3 million in exhaustive surveys. Regional farm and industry breakdowns could guide cost-sharing arrangements for surveys.
Introduction
Weed control is the most effective crop protection tool, it generally provides benefits (ca. 20% yield improvements) that exceed those provided by controlling pests and diseases (Oerke and Dehne Citation2004; Oerke Citation2006). To realise these benefits, cultural (Chauhan and Johnson Citation2010; Chauhan and Gill Citation2014) and herbicidal controls are typically used (Osteen and Szmedra Citation1989). Agricultural chemical crop protection sales in New Zealand are estimated at $350 million annually with herbicides accounting for 45% or ca. $158 million (unpublished data Agcarm 2018). These inputs contribute significantly to the New Zealand agricultural sector’s annual export earnings of $11.8–13.1 billion NZD over each of the 5 years prior to 2018 (www.stats.govt.nz). This spending shows the value that farmers place on weed control using herbicides. A growing concern is that many herbicides are becoming less effective and alternatives are under-used. Worldwide, where herbicides are used extensively resistance has repeatedly developed and cases of resistance for 255 species are known (Heap Citation2019).
In New Zealand, resistance to one or more herbicides has been found in 13 taxa over the last 40 years (). Herbicide resistance was recognised as a high priority issue by stakeholders in New Zealand (Bourdôt et al. Citation2018). Because many herbicides share activity on certain enzymes and processes those taxa with resistance in New Zealand often display cross-resistance to multiple herbicides (Bourdôt et al. Citation1994; Seefeldt et al. Citation2001; Lusk et al. Citation2015; Ghanizadeh et al. Citation2016a; Ghanizadeh and Harrington Citation2017; Gunnarsson et al. Citation2017). Resistant species in New Zealand have been found in arable crops (Bourdôt Citation1996; Seefeldt et al. Citation2001; Gunnarsson et al. Citation2017) including maize (Rahman and Patterson Citation1987; James et al. Citation2005; Ghanizadeh et al. Citation2015a; Ghanizadeh and Harrington Citation2017), pastures (Harrington and Popay Citation1987; Popay et al. Citation1989; Bourdot et al. Citation1990; Harrington Citation1990; Harrington and Hewage Citation1997; Bourdôt et al. Citation2003, Citation1994; Lusk et al. Citation2015), vineyards (Ghanizadeh et al. Citation2016b, Citation2015b, Citation2013), sweet potato (Lewthwaite and Triggs Citation2009), peas (Harrington et al. Citation2001), orchards (Harrington et al. Citation2001, Citation1992) and turf (Harrington et al. Citation2001). Often the same species of weed can display resistance in more than one crop and herbicide-use context (). No cases have been documented in New Zealand from roadsides, and railways – unlike overseas (Heap Citation2019).
Table 1. The year in which each herbicide resistance case in New Zealand was documented and the land-use type in which it was found. Herbicide Mode-of-Action classifications as defined by the Herbicide Resistance Action Committee https://hracglobal.com.
It is unclear whether the prevalence is low overall, but the problem is probably under-reported. Apart from queries back to the companies that supply the herbicides, there is no obvious protocol for reporting, nor a designated person, company or agency that provides specialist support in New Zealand. Herbicide company representatives may have good knowledge of problems, but these are not typically shared or published. Often it may hardly bear publicising as they believe they can address client concerns, or they may prefer not to draw attention to product limitations. It is surely in the public’s interest (and other stakeholders) that we get reliable estimates of the spatial extent, frequency and types of herbicide-resistant weeds.
National or regional surveys for herbicide resistance across multiple farm types, that target all potential weeds using defensible random sampling designs are infrequent given the number of publications about resistance. Surveys often focus on one or two farm types, or known problem weeds. Australian work in cropping systems are an important exception. A single random survey of cropping regions in 2010 in southern parts of Western Australia showed resistance in multiple species including rigid ryegrass Lolium rigidum (>95% of farms), wild radish (84%), brome (13%), and barley grass (8%) (Owen et al. Citation2015a, Citation2015b, Citation2014). Similar levels of resistance were found in in southern New South Wales surveys in 2007 for rigid ryegrass (87%), wild oats (57%), but brome and barley grass populations were all susceptible (Broster et al. Citation2012, Citation2011, Citation2010). Surveys in southern Australia showed that 90% of wheat fields contained resistant L. rigidum (rigid ryegrass), mostly conferred (80%) by target site mutations for ACCase inhibiting (Group A) herbicides (Malone et al. Citation2013). Meanwhile rigid ryegrass resistance ranged between 20%–80% for a variety of herbicides in a cereal cropping region of South-eastern Australia (Boutsalis et al. Citation2012). In Tasmania only (36%) of populations of ryegrass species had resistance – this was attributed to the lower cropping intensity (Broster et al. Citation2012). Similarly, in France surveys across large regions detected ACCase-resistant Alopecurus myosuroides in 50%–65% of the populations in winter wheat farms (Menchari et al. Citation2006). Multiple resistance in Avena fatua was found in 15%–50% of wheat fields in a regional survey of parts of Canada (Beckie et al. Citation2002, Citation1999). Published evidence suggests that the spread of resistant genotypes within fields (via seed or pollen) is common; however, resistance typically arises independently in individual farms (Menchari et al. Citation2006; Malone et al. Citation2013) via strong selection of rare resistant phenotypes which occur at ratios of 1:10,000–1:10,000,000 (Preston and Powles Citation2002; Neve Citation2008; Renton et al. Citation2014; Liu et al. Citation2017). Even in the absence of selection (i.e. herbicide application), rare resistant phenotypes are believed to persist (by chance) at rates at 10–100 times (Harms and DiMaio Citation1991; Jasieniuk et al. Citation1996; Neve Citation2008) above the spontaneous mutation rates which may be between 1 × 10⁻⁶ (López-Rodas et al. Citation2007; Marvá et al. Citation2010) and 1 × 10⁻⁹ (Harms and DiMaio Citation1991; Jasieniuk et al. Citation1996). This may be a conservative estimate. Some populations unexposed to herbicides have resistance rates more than 100 times the mutation rate (Jasieniuk et al. Citation1996; Preston and Powles Citation2002). This is possible if the fitness cost of the mutation is low – theory from population genetics about the mutation-selection balance describes the likely processes involved (Hermisson and Pennings Citation2005; Vila-Aiub et al. Citation2015; Kreiner et al. Citation2018). Ultimately, survey data could potentially be made available on interactive maps (Panozzo et al. Citation2015a), but issues of confidentiality may mean that public versions of such maps could only depict resistance within administrative boundaries rather than at the level of farms.
For weed managers diagnosing herbicide-resistant weeds is a useful first step that guides management options; a yes or no answer is enough (Beckie Citation2006). Scientists’ expectations are more nuanced. Typically, the initial characterisation of a herbicide-resistant weed in a reputable journal should involve a full assay of 5–8 doses, including likely sublethal doses, to construct comparative dose–response curves. Such experiments require good levels of replication (Streibig Citation1988; Ritz and Streibig Citation2005; Ritz et al. Citation2015). The heritability of the resistance trait also needs to be demonstrated (Beckie et al. Citation2000; Heap, Citation2005, Citation1994; Burgos et al. Citation2013). This could involve genotyping, or further assays of progeny from crosses within resistant and susceptible plants, and back-crosses to determine how they segregate (Busi et al. Citation2008; Ghanizadeh et al. Citation2016a). Alternatively, large scale genotyping may be used (Malone et al. Citation2013; e.g. Menchari et al. Citation2006). While it may be a relatively simple matter to develop a probe kit targeting the known target sites for resistance e.g. using methods similar to Lemmon et al.(Citation2012), the costs may be prohibitive when applied at scale and would miss untargeted or undiscovered genes, and biotypes with non-target site (NTS) resistance. For large numbers of samples, simple tests with multiple herbicides applied at discriminating doses should be sufficiently informative and cost-effective (Beckie et al. Citation2000; Burgos et al. Citation2013; Panozzo et al. Citation2015b).
Here we assess the sampling effort that may be needed to estimate the extent and prevalence of herbicide resistance in New Zealand. We ask, based on the known cases of herbicide resistance: (1) which farms, or other land use types have a risk of developing herbicide resistance and should be targeted for sampling? (2) What is the distribution of those farms or land-use types in New Zealand? (3) How good an estimate of herbicide resistance prevalence might we obtain given different target population sizes, levels of herbicide resistance, sampling effort, and detectability? (4) What screening procedures could be used? (5) How much might it cost to provide industry sector estimates of herbicide resistance?
Methods
Determining which farms should be in the sample population
We sought to target farm types based on the likely intensity of herbicide use for crop protection, this resulted mostly in selection of the major industry groups and commodities in New Zealand. Targeted selection of high-risk farms for sheep and beef (areas with thistles historically known to have resistance) and dairy farms in regions known to have giant buttercup was explored as an option to reduce costs (high-risk farms indicated in bold in ). Previously published cases of herbicide resistance were characterised in terms of weed, crop (farm type) and herbicide combinations. Herbicide use levels are not well known at national levels, let alone at a per-farm or field level, nor is the distribution of weeds well understood except in the broadest sense. Based on the authors’ broad knowledge of weed distributions, we identified the number of land-use or farm types that are simililar to the published cases of resistance. According to the protocol below, we assumed that these farms could develop resistance problems for the same weed species that were documented earlier, or other resistant weeds could be selected for under any similarly intense herbicide use regime. Our source for farm numbers and distribution data was the the GIS-enabled Agribase™ (Sanson Citation2000, ). Data are limited for the Nelson Region, because of regional rules related to information sharing and designation of some of it as confidential. Agribase™ has limitations because it is based on annual surveys that sample the farmers, but Agribase™ is considered the best available georeferenced farm data – it is referenced in over 300 studies (Google Scholar search May 2019). The number of farm properties and hectares of farms for each major farm-sector group are presented by administrative regions ().
Table 2. An estimate of the number of farms (and the area in thousands of hectares within brackets) within administrative regions that share weed and land-use histories with previously published cases of herbicide resistance (farm types follow Agribase™).
Farms designated as arable (especially cereal crops, this includes maize and peas) are amongst the highest risk for herbicide resistance because of their intensive management – we included all farms classified as arable in Agribase™ (e.g. James et al. Citation2005; Gunnarsson et al. Citation2017). All Dairy farms were included, but we highlight those in the Tasman, Taranaki, Hawkes Bay and Manuatu-Wellington regions because giant buttercup infestations are known from those areas and resistance to herbicides in them is well documented (Bourdôt et al. Citation2003). Fruit operations, including various types of orchards and berries are in Agribase™ under a farm type designation, and all the farms with the type were categorised as at risk. Triazine resistance in orchards was not conclusively documented but was suspected (Harrington et al. Citation2001, Citation1992); resistant biotypes may persist long after use of that herbicide has been discontinued. New herbicide resistance cases in orchards and berry farms may be uncommon as farmers are moving toward using cultural control methods such as mowing and grazing, and farmers now tolerate more weeds than they used to (Pearson Citation2003). However, glyphosate use is common in fruit orchards and berry crops (Tim Herman pers. com.) thus problems could develop as they have for ryegrass in multiple vineyards (Ghanizadeh et al. Citation2013). All vineyards in Agribase are included. Similarly, all sheep and beef farms were included but we highlight those ( in bold) in the North Island regions of Gisborne, Hawkes Bay, and Taranaki that commonly employ intensive herbicidal control measures against thistles and for which herbicide resistance was documented previously (Harrington and Popay Citation1987; Harrington Citation1990; Harrington and Hewage Citation1997). Herbicide resistance cases in horticultural or vegetable farms, appear to be rare, perhaps because of the mitigating effects of regular rotations and intense soil cultivation. Herbicide resistance has developed in sweet potato (Lewthwaite and Triggs Citation2009). Still, vegetable growing operations have a low tolerance for weeds and could be vulnerable to developing herbicide resistance.
Simulating surveys to determine the sample effort needed
Simulations were carried out in R (R Core Team Citation2018) using R scripts that we developed for this question. The process involved randomly designating vectors of zeros and ones, to represent farms with and without herbicide resistance (between 5%–80% of the farms were assigned as resistant, in increments of 5%). The number of farms ranged between 50 and 15000 farms which represent hypothetical population values across a range of farm numbers we obtained in the high-risk land-use categories we identified here (). These simulated farms were randomly sampled using different levels of sampling effort, where the percent of farms sampled ranged between 5%–50% (in increments of 5%). It was assumed that failure to detect a farm where resistance does occur is possible – if nothing else because surveyors could miss the resistant weeds. However, we think that it is unlikely that a survey would wrongly classify a resistant weed as susceptible once it is collected. To account for the possibility that detection rates are likely less than 100%, that is farms with resistance could be missed, we simulated detection rates of 50, 75, 90, and 100% to quantify the effect of this uncertainty. Simulations were run 200 times for each combination of farm number, the proportion of resistant farms, and sample effort level, as well as the four levels of detection certainty.
Costs
The costs of field work were estimated using information from a Foundation for Arable Research effort to randomly sample 50 arable farms in Canterbury region (in 2018–19), along with herbicidal screening using discriminatory doses (effort estimated as this has not been completed yet). This involved collecting grouped seed from weed species surviving in mid to late summer in two fields per farm. Assumptions and calculations are discussed below.
Results and discussion
Delimiting areas that could develop herbicide resistance – a first pass
The results here contribute to answering the first two questions we posed: (1) Based on the known cases of herbicide resistance which farms, or other land use types have a risk of developing herbicide resistance and should be targeted for sampling? (2) What is the distribution of those farms or land use types in New Zealand? Here we document the cases of herbicide resistance in terms of the modes of action (https://hracglobal.com/ accessed in March 2019), over the last forty years since herbicide resistance was first described in New Zealand (). This information was used to select farms that are broadly similar with respect to land-use (using Agribase™) and weed types (author expert knowledge). We contend that a significant proportion of similar farms will be subject to intense weed management () using herbicides and these could select for resistant biotypes. As such, these should be assessed in a survey of herbicide resistance. Actual risk will vary spatially with respect to weed abundance, farm system and the history and intensity of herbicide application.
Herbicide groups, weeds and land-use in cases of resistance
In New Zealand, since 1979, resistance has been found in 13 taxa, with >25 herbicides in 8 chemical classes showing reduced effectiveness i.e. groups A, B, C, D, F, G, H and O – details are provided here and in . The regional breakdown of farm numbers for each land-use or farm type are given in .
Resistance to lipid synthesis inhibitors (ACCase; HRAC Group A) developed in two weedy grass species, L. multiflorum and A. fatua in cereal crops. L. multiflorum developed resistance to haloxyfop and pinoxaden (Gunnarsson et al. Citation2017). A. fatua developed resistance to clethodim, fenoxaprop-P-ethyl, haloxyfop and pinoxaden (Harrington and Chynoweth Citation2014). Arable farms are likely to develop this kind of problem, and for this exercise all arable farms are considered high-risk for the development of herbicide resistance (Beckie et al. Citation1999; Malone et al. Citation2013; Harrington and Chynoweth Citation2014; Gunnarsson et al. Citation2017; Heap Citation2019).
Inhibitors of acetolactate synthase (ALS; HRAC Group B) selected for resistance in arable crops and pasture. In Canterbury cereal crops L. multiflorum developed resistance to the herbicide mixture mesosulfuron + iodosulfuron + diflufenican, and L. perenne showed resistance to chlorsulfuron, iodosulfuron, pyroxsulam, thifensulfuron-methyl, and tribenuron. Also, in cereals, but in Southland chlorsulfuron and tribenuron resistance was documented for Stellaria media. In dairy pastures mostly in Taranaki and the northern part of the South Island flumetsulam and thifensulfuron-methyl resistance was detected in Ranunculus acris. This weed is frequently a problem on dairy farms shown in the regions shown (in bold) in . An estimated 2521 dairy farms in these regions were recorded (Bourdôt et al. Citation2003), and the numbers in closely match those in DairyNZ’s records (DairyNZ Citation2017).
Inhibitors of photosynthesis at Photosystem II selected for resistance in a few species (HRAC Group C1). Weed control in maize crops using atrazine was implicated in the development of resistance in Chenopodium album and Persicaria maculosa. In a pea crop near Palmerston North Solanum nigrum developed resistance to cyanazine and showed cross-resistance to atrazine, prometryne, terbuthylazine and possibly terbutryn. Peas and maize are classified as arable farms in Agribase™.
Paraquat resistance (HRAC Group D, Photosystem I electron diversion) developed in two nightshade species, S. americanum and S. nigrum in sweet potato (kumara) grown in Northland. There was no clear way to distinguish sweet potato farms in Agribase™, but we think these should be captured as part of the vegetable farming category (). The intense weed control expected in most vegetable farms could select for weeds with herbicide-resistant phenotypes.
Group G herbicide (glyphosate) resistance has developed in L. perenne and L. multiflorum from vineyards in New Zealand (Ghanizadeh et al. Citation2016a, Citation2016b, Citation2015b, Citation2014, Citation2013). Target site, and non-target site cases are known in these glyphosate cases (Ghanizadeh et al. Citation2016a, Citation2015b). These ryegrass populations also showed resistance to glufosinate (Group H), and some glyphosate resistant L. perenne and L. multiflorum populations showed resistance to amitrole (Group F) (Ghanizadeh et al. Citation2016b, Citation2014). Such use patterns may be shared in orchards or berry crops. Herbicide use appears to be declining overall, and farmers have moved away from using triazine based products. Meanwhile, it is unclear if the Group N herbicide dalapon is still used against Nassella neesiana (Hartley Citation1994) with flupropanate favoured currently. Grubbing plants is a now the preferred strategy for many farmers (Bourdôt et al. Citation1992). This tussock is considered a serious weed on over a thousand farms on the South Island where it is often subjected to regular control, more resistance cases are possible where herbicides are employed (Bourdôt and Saville Citation2016).
Horticultural farming of fruit and vegetables often employ intensive weed control. Agribase categories for horticultural operations in New Zealand number almost 6000 [()] include 682 vegetable farms, 4130 orchards, fruit and berry operations, and 979 vineyards (from in Agribase™ ). Glyphosate and triazine resistance cases are documented in orchards (). While vegetable farming operations use intensive weed management strategies, so far only kumara (sweet potato) has had documented resistance cases in New Zealand ().
Synthetic auxins, particularly in the phenoxy group (HRAC Group O) are implicated in resistance cases from turf, pasture, and maize. Usually, 2,4-D or MCPA were the sole herbicide used and cross-resistance implicated for other herbicides. Carduus nutans has demonstrated resistance to 2,4-D, and MCPA in pastures. C. pycnocephalus has demonstrated resistance to 2,4-D, MCPA and MCPB in pastures (Harrington and Popay Citation1987; Harrington and Hewage Citation1997). Thistles in sheep and beef farms in the North Island south of Auckland were considered the highest risk for developing resistance and identified as high-risk targets for surveys. Chenopodium album was resistant to dicamba, with cross-resistance shown for aminopyralid, clopyralid, and picloram in maize (James et al. Citation2005; Ghanizadeh et al. Citation2015a; Ghanizadeh and Harrington Citation2017). Maize farms are captured under the arable category in Agribase™. Soliva sessilis developed resistance to 2,4-D in turf and plants from this population were cross-resistant to clopyralid, picloram and triclopyr (Harrington et al. Citation2001). We do not have good information on the distribution of intensely managed turf in New Zealand. Group O phenoxy herbicides MCPA, MCPB and 2,4-D are known to give poor control of R. acris on farms with a history of MCPA overuse – potentially these would occur in Taranaki, Hawke’s Bay, Manawatu-Wanganui, Wellington, South Auckland, and Tasman regions.
Observations about the distribution of farms that should be surveyed
The approximately 1500 farms identified in Agribase as arable may be an underestimate since the The Foundation for Arable Research has a membership of approximately 2700 farmers. Just two of 16 regions account for half of the arable farms, these are in the Waikato and Canterbury, though other important regions are Manawatu-Wellington, and Otago. We think the arable farms in Waikato and Northland grow maize – often for silage. There is less effective tracking of maize growers, so the numbers are most likely an underestimate. Wheat farms are mostly found in Canterbury, Otago and Southland and represent one of highest risk farming activities for herbicide resistance (Heap Citation2019).
Thistle control has been shown to be economically beneficial for sheep farmers in New Zealand, and helicopter based applications of herbicides have been employed for many years (Hartley and James Citation1979; Thompson Citation1979). Here sheep and beef in mid and southern North Island are assessed as high-risk for resistance based on the previously documented problems with thistles developing resistance. The high-risk farms in the Waikato, Taranaki, Hawkes Bay, Bay of Plenty, Gisborne, and Manawatu-Wanganui regions number over around 4,127 (including all sheep and beef farms would bring the number up to 18,000). Some thistles are common on most pastures in New Zealand so selecting this subset may underestimate the potential (Bourdôt et al. Citation2014).
For the R. acris an estimated 2521 dairy farms in these regions are recorded, and the numbers in closely match those in DairyNZ’s records (Citation2017). Earlier estimates of its prevalence suggest that between 5% and 30% of the farms in these regions have severe problems with giant buttercup (Bourdôt et al. Citation2003).
Other areas where herbicide resistance could be detected
Intensive herbicidal management of weeds seems likely in a variety of settings, including roads, railways and turf, especially for turf favoured for sports like golf, bowls, croquet, tennis, cricket, and rugby. A passive mailing campaign could be used to reach out to these stakeholders. Sampling some of the 393 golf courses in New Zealand (www.golf.co.nz, accessed March 2019) – could lead to new detections of herbicide resistance including more cases of the previously described S. sessilis or in other species. Only four resistant species are known from golf-courses worldwide but Poa annua has repeatedly developed resistance in the golf setting in Australia, USA and Japan for herbicides with 8 different modes of action (Heap Citation2019).
Overseas 34 and 15 taxa are known to have developed resistance on roads and railways respectively (Heap Citation2019). Developing a sampling strategy for the approximately 94,000 km of state and local roads in New Zealand and 4,128 km of railways (https://www.nzta.govt.nz, accessed March 2019) would be relatively easy – but funding it may not be. Providing weed control contractors with a place to send samples of suspected resistant weeds could lead to new detections.
Estimating sample effort required to accurately estimate the prevalence
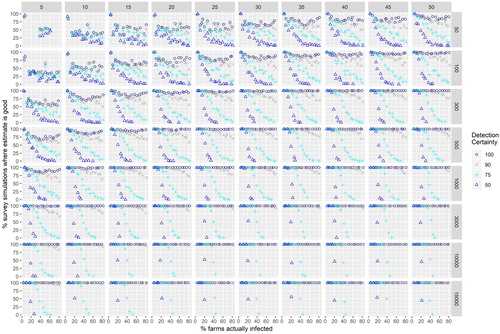
Results from survey simulations are shown in Figures and (Appendix). The aim here was to answer our question: (3) How good an estimate of herbicide resistance prevalence might we obtain given different target populations of farms, percentages of farms actually having herbicide resistance (prevalence), sampling effort, and detectability? There is predictably an interaction between actual prevalence, sampling effort levels, target population size and the certainty we have of detecting cases on farms. Figure A1 shows the percent of sampling simulations where all cases of resistance are missed at the given level of sampling effort and the percent of farms actually infested. When the percent of farms actually infested was low (5%) and detectability was low (50%) all cases of resistance could be missed (Figure A1) even if 250–300 out of 1000 farms were sampled (though this was rare). Simulations sampling 250 out of 1000 farms provided a good estimate (within 10% of the true value) of the prevalence only three-quarters of the time even with a 90% detectability at the highest infection rates 75%–80% (Figure A2). For detectability levels of 50% there were no good estimates (estimate within 10% of the known rate) when rates of resistance exceeded 25% and where the sampled population exceeded 100. When the percent of farms actually infested was lower than 25% the number of estimates within 10% of the true value is higher than expected because observations are bound by zero at the low end.
If detectability rates are low, it is impossible to get a good estimate of the proportion of farms infected. Such estimates would always be an ‘at least’ estimate – because it is possible to sample only susceptible plants even though resistant plants are present on a farm. This observation is interesting as it implies that even the highest reported rates of resistance from large surveys (Beckie et al. Citation1999; Malone et al. Citation2013) are under-estimating the true prevalence. Clearly, the predominant means of documenting herbicide resistance (by scientists) around the world is haphazard and under-estimates its occurrence by a large margin. Detecting resistant weeds on a farm three quarters of the time may seem like a good probability of detection, but if prevalence rates exceed 45% no good estimates (within 10% of the true value) were obtained –the probability of missing all the cases was low at this level of detection when the percent of farms sampled exceeded 5% and from a targeted population >300.
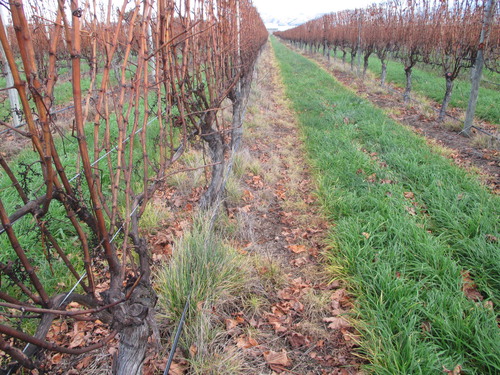
Taking an arbitrary threshold as a reference, sampling 10% of farms would detect some new resistance cases more than half the time at all levels of detectability and provide good prevalence estimates if the sample population exceeds 300 farms. To use the information in our simulations (Figures A1 and A2) the user needs to have a scenario in mind. For example, if you had $100,000 NZD you could afford to sample 131 vineyards (cost calculations below) which is approximately 10% of the estimated 979 that there are in New Zealand. In this case you are very likely to detect some new cases of resistance, but if detection rates are 75% or less your estimate is unlikely to be within 10% of the true value. Resistant ryegrass plants do stand out in vineyard rows () and other weeds surviving treatment may also stand out, implying that they would be easily detected.
Figure 1. Herbicide resistant ryegrass in a vineyard in Marlborough. Picture: Trevor James.
Screening procedures and costs
Here we explore these questions: (4) What screening procedures could be used? (5) How much might it cost to provide industry sector estimates of herbicide resistance?
A pilot survey of 50 randomly selected Canterbury cereal and clover farms mostly within 100 kilometres of the Foundation for Arable Research office took 320 h of staff time including making initial phone contact with farmers or 6.4 h per farm was undertaken in the summer of 2018–19 (unpublished data). Travel distances were approximately 27 km per farm. This yielded 144 cleaned aggregated seed samples from six weed species surviving in or near wheat, clover and pea fields. Each sample represents seed from one or more plants of the same species collected from a single farm field. Screening a sample for weed resistance across a range of 5–10 likely herbicides using a single discriminatory dose (Beckie et al. Citation2000) can cost between $200 and $500 AUD for a commerical lab with greenhouse facilities. In Australia costs in a dedicated project were estimated at $20,000 AUD for 150 arable farms, or $133 AUD per farm (Peter Boutsalis pers. comm). Assuming 0.73 cents per km (27 km per farm) a charge out rate of $100 per hour and 6.4 h for contacting farmers and doing on-farm surveys, plus labour costs of 1 h per farm (7.4 h total) for screening 5–10 candidate herbicides for 2–3 samples per farm the cost comes up higher $759 NZD per farm. If all the farm (>38,000) identified in are targeted the cost of surveying 10% of cases would exceed $2.9 million NZD. Whereas, keeping all else the same but implementing some targeted sampling of high-risk dairy, and sheep and beef farms would bring the targeted farm population down to 10% of ca. 14,000 and a lower cost of $1,062,600 NZD. This is on the basis of using a single discriminating dose (e.g. label rates) as opposed to multiple doses for dose–response curve estimation to lower costs (Beckie et al. Citation2000; Malone et al. Citation2013; Panozzo et al. Citation2015b).
The costs of surveys could be reduced by using telephone screening procedures that identify farms as high-risk and exclude low-risk cases, for example by asking farmers about weed type, abundance, history of herbicide use, and whether they suspect a problem. Such a process could reduce the costs involved in farm visits but would require a more nuanced statistical estimation of prevalence. Clearly, some proportion of the farms deemed low-risk would need to be sampled to ascertain if the screening protocol was truly yielding different levels of risk. More passive systems could be implemented to good effect, extension efforts and user-pays or subsidised screening could be effective. The down side of non-random and passive surveys is that population wide conclusions about prevalance are impossible. In addition, more reporting could be required of herbicide companies, farmers or contractors so as to track year to year variations in herbicide use, treatment efficacy and resistance cases.
Conclusions
Farmer led mitigation of herbicide and pesticide resistance requires farmers to know when problems develop. Random surveys allow you to determine where the greatest extent of resistance is and therefore target either a survey or extension messages for that region. Simulations showed that sampling quite large proportions of high-risk farms could fail to detect many cases of resistance, and prevalence estimates could be poor. This is particularly true if detection rates for the farms with resistance falls below 75%. Every effort should be made to standardise methods to ensure detection rates are high once surveyors are on a farm. Their experience and the engagement with farmers or spraying contractors would surely improve detection rates. Weed type and crop context would lead to different detection rates. For example, in orchards and vineyards (e.g. ) detection might be straightforward compared to locating grass weeds in cereal crops or pastures. On the plus side, no matter how accurate survey estimates are any new cases detected could help to educate farmers about risk, and better guide survey and extension efforts. Herbicide resistance detection would be more straightforward if data were available about the herbicides that are applied from year to year. Per farm level data would be good, but data about herbicide sales and crop context at a national level could also do a lot to guide surveys. Government agencies or industry groups should do what they can to support evidence-based decision-making by tracking herbicide use. In the absence of dedicated survey efforts, an affordable and dedicated pesticide resistance screening service could be funded by a mix of user pays, industry contributions (farm and agricultural chemical companies) and potentially subsidised by taxes (from national or regional authorities). The Foundation for Arable Research has already made herbicide resistance research a priority, but some other large agricultural industry groups e.g. sheep, beef, dairy, wine, fruit and vegetables may be underestimating the importance of this problem. Weed control is widely regarded as the most cost-effective crop protection strategy and provides demonstrable benefits. The effectiveness of the available chemical controls is likely to decline over time if this problem is ignored by farmers and other stakeholders.
Figure A2. The proportion of survey simulations in which an estimate of resistance is obtained within 10% of the actual level of resistance
Download JPEG Image (3.2 MB)
Figure A1. The proportion of survey simulations in which every case of resistance was missed
Download JPEG Image (1.9 MB)
Appendix 1 Surveying For Resistance
Download MS Word (1.5 MB)Acknowledgements
I thank Hossein Ghanizadeh and Kerry Harrington and two anonymous reviewers for critical comments that helped improve the manuscript.
Disclosure statement
No potential conflict of interest was reported by the authors.
Additional information
Funding
Related Research Data
References
- Beckie HJ. 2006. Herbicide-resistant weeds: management tactics and practices. Weed Technology. 20:793–814. doi:10.1614/WT-05-084R1.1.
- Beckie HJ, Heap IM, Smeda RJ, Hall LM. 2000. Screening for herbicide resistance in weeds. Weed Technology. 14:428–445. doi:10.1614/0890-037X(2000)014[0428:SFHRIW]2.0.CO;2.
- Beckie HJ, Thomas AG, Légère A, Kelner DJ, van Acker RC, Meers S. 1999. Nature, occurrence, and cost of herbicide-resistant wild oat (Avena fatua) in small-grain production areas. Weed Technology. 13:612–625. doi:10.1017/S0890037X00046297.
- Beckie HJ, Thomas AG, Stevenson FC. 2002. Survey of herbicide-resistant wild oat (Avena fatua) in two townships in Saskatchewan. Canadian Journal of Plant Science. 82:463–471. doi:10.4141/P01-067.
- Bourdôt G, Buddenhagen C, Lamoureaux S, Cripps M, James T. 2018. Pastoral sector weeds research strategy (2018-2028) (No. 8284). Christchurch, New Zealand: AgResearch.
- Bourdôt G, Hurrell G, Saville D. 2014. Frequency of occurrence and ground cover of Cirsium arvense on pastoral farms in New Zealand: a farmer opinion survey. New Zealand Journal of Agricultural Research. 57:1–13. doi:10.1080/00288233.2013.859626.
- Bourdôt GW. 1996. The status of herbicide resistance in New Zealand weeds. In: Bourdôt GW, Suckling DM, editors. Pesticide resistance: prevention and management. New Zealand Plant Protection Society, Rotorua, New Zealand. 81–89.
- Bourdot GW, Hurrell GA. 1988. Differential tolerance of MCPA among giant buttercup (Ranunculus acris) biotypes in Takaka, Golden Bay. Proceedings of the NZ Weed and Pest Control Conference. 41:231–234. doi: 10.30843/nzpp.1988.41.9859
- Bourdot GW, Hurrell GA, Saville DJ. 1990. Variation in MCPA-resistance in Ranunculus acris L. subsp. acris and its correlation with historical exposure to MCPA. Weed Research. 30:449–457. doi:10.1111/j.1365-3180.1990.tb01733.x.
- Bourdôt GW, Hurrell GA, Saville DJ. 1992. Eradication of nassella tussock (Nassella trichotoma), an unlikely outcome of grubbing. New Zealand Journal of Agricultural Research. 35:245–252. doi:10.1080/00288233.1992.10427501.
- Bourdôt GW, Hurrell GA, Saville DJ. 1994. Herbicide cross-resistance in Ranunculus acris L. subsp. acris. New Zealand Journal of Agricultural Research. 37:255–262. doi:10.1080/00288233.1994.9513062.
- Bourdôt GW, Saville DJ. 2016. Nassella trichotoma in modified tussock grasslands in New Zealand: a case study in landscape-scale invasive plant population monitoring. Weed Research. 56:395–406. doi:10.1111/wre.12221.
- Bourdôt GW, Saville DJ, Crone D. 2003. Dairy production revenue losses in New Zealand due to giant buttercup (Ranunculus acris). New Zealand Journal of Agricultural Research. 46:295–303. doi:10.1080/00288233.2003.9513557.
- Boutsalis P, Gill GS, Preston C. 2012. Incidence of herbicide resistance in rigid ryegrass (Lolium rigidum) across Southeastern Australia. Weed Technology. 26:391–398. doi:10.1614/WT-D-11-00150.1.
- Broster JC, Koetz EA, Wu H. 2010. A survey of southern New South Wales to determine the level of herbicide resistance in brome grass and barley grass populations. In: Zydenbos SM, editors. Presented at the Seventeenth Australasian Weeds Conference, Christchurch, New Zealand, 274–277.
- Broster JC, Koetz EA, Wu H. 2011. Herbicide resistance levels in annual ryegrass (Lolium rigidum Gaud.) in southern New South Wales. Plant Protection Quarterly. 26:22–28.
- Broster JC, Koetz EA, Wu H. 2012. Herbicide resistance frequencies in ryegrass (Lolium spp.) and other grass species in Tasmania. Plant Protection Quarterly. 27:36–42.
- Burgos NR, Tranel PJ, Streibig JC, Davis VM, Shaner D, Norsworthy JK, Ritz C. 2013. Review: confirmation of resistance to herbicides and evaluation of resistance levels. Weed Science. 61:4–20. doi:10.1614/WS-D-12-00032.1.
- Busi R, Yu Q, Barrett-Lennard R, Powles S. 2008. Long distance pollen-mediated flow of herbicide resistance genes in Lolium rigidum. Theoretical and Applied Genetics. 117:1281–1290. doi:10.1007/s00122-008-0862-8.
- Chauhan BS, Gill GS. 2014. Ecologically based weed management strategies. In: Recent advances in weed management. Springer New York; p. 1–11. doi:10.1007/978-1-4939-1019-9_1.
- Chauhan BS, Johnson DE. 2010. Chapter 6 - The role of seed ecology in improving weed management strategies in the tropics. In: Advances in Agronomy, Advances in Agronomy. Academic Press; p. 221–262. doi:10.1016/S0065-2113(10)05006-6.
- DairyNZ. 2017. New Zealand dairy statistics 2016-17 [WWW Document]. New Zealand Dairy Statistics 2016-17; [accessed 2019 Mar 15]. https://www.dairynz.co.nz/publications/dairy-industry/new-zealand-dairy-statistics-2016-17/.
- Ghanizadeh H, Harrington KC. 2017. Cross-resistance to auxinic herbicides in dicamba-resistant Chenopodium album. New Zealand Journal of Agricultural Research. 60:45–53. doi:10.1080/00288233.2016.1238397.
- Ghanizadeh H, Harrington K, James T. 2016a. Genetic inheritance of restricted herbicide translocation in a glyphosate-resistant population. New Zealand Journal of Agricultural Research. 59:269–279. doi:10.1080/00288233.2016.1189438.
- Ghanizadeh H, Harrington KC, James TK. 2016b. Glyphosate-resistant Italian ryegrass and perennial ryegrass in New Zealand – a review. New Zealand Plant Protection. 69:246–251. doi: 10.30843/nzpp.2016.69.5943
- Ghanizadeh H, Harrington KC, James TK, Woolley DJ. 2013. Confirmation of glyphosate resistance in two species of ryegrass from New Zealand vineyards. New Zealand Plant Protection. 66:89–93. doi: 10.30843/nzpp.2013.66.5713
- Ghanizadeh H, Harrington KC, James TK, Woolley DJ. 2014. A glyphosate-resistant perennial ryegrass population is also resistant to amitrole. New Zealand Plant Protection. 67:331. doi: 10.30843/nzpp.2014.67.5779
- Ghanizadeh H, Harrington KC, James TK, Woolley DJ. 2015a. A quick test using seeds for detecting dicamba resistance in fathen (Chenopodium album). Australian Journal of Crop Science. 9:337–343.
- Ghanizadeh H, Harrington KC, James TK, Woolley DJ, Ellison NW. 2015b. Mechanisms of glyphosate resistance in two perennial ryegrass (Lolium perenne) populations. Pest Management Science. 71:1617–1622. doi:10.1002/ps.3968.
- Gunnarsson M, James TK, Chynoweth RJ, Rolston MP. 2017. An evaluation of the resistance of annual and perennial ryegrass to herbicides. New Zealand Plant Protection. 70:165–170. doi: 10.30843/nzpp.2017.70.45
- Harms CT, DiMaio JJ. 1991. Primisulfuron herbicide-resistant tobacco cell lines. Application of fluctuation test design to in vitro mutant selection with plant cells. Journal of Plant Physiology. 137:513–519. doi: 10.1016/S0176-1617(11)80691-7
- Harrington KC. 1990. Spraying history and fitness of nodding thistle, Carduus nutans. Proceedings of the 9th Australian Weeds Conference. p. 201–204.
- Harrington KC, Berry SB, Sims REH. 1992. A survey of weed control practices in New Zealand pipfruit orchards. Proceedings of the NZ Plant Protection Conference. 45:285–288. doi: 10.30843/nzpp.1992.45.11241
- Harrington KC, Chynoweth RJ. 2014. Have wild oats in Canterbury become resistant to herbicides? New Zealand Plant Protection. 67:331. doi: 10.30843/nzpp.2014.67.5778
- Harrington KC, Hewage N. 1997. Resistance of slender winged thistle to MCPA. Proceedings of the NZ Plant Protection Conference. 50:538. doi: 10.30843/nzpp.1997.50.11381
- Harrington KC, Popay AI. 1987. Differences in susceptibility of nodding thistle populations to phenoxy herbicides. Proceedings of the Eighth Australian Weeds Conference, Sydney, New South Wales, Australia; Sep 21–25. Weed Society of New South Wales, p. 126–129.
- Harrington KC, Ward AJ, Wells DM. 2001. Herbicide resistance in black nightshade and Onehunga weed. New Zealand Plant Protection. 54:152–156.
- Hartley MJ. 1994. Dalapon resistant individuals in a susceptible population of Chilean needle grass. Proceedings of the NZ Plant Protection Conference. 47:75–79. doi: 10.30843/nzpp.1994.47.11033
- Hartley MJ, James TK. 1979. Cost benefit of Californian thistle control in pasture. Proceedings of the NZ Weed and Pest Control Conference. 32:245–249. doi: 10.30843/nzpp.1979.32.10761
- Heap I. 2019. International survey of herbicide resistant weeds - weedscience.org; [accessed 2019 Feb 26]. http://www.weedscience.org/.
- Heap, I, 2005. Criteria for confirmation of herbicide-resistant weeds - with specific emphasis on confirming low level resistance. Herbicide Resistance Action Committee. https://hracglobal.com/files/Criteria-for-Confirmation-of-Herbicide-Resistant-Weeds.pdf
- Heap IM. 1994. Identification and documentation of herbicide resistance. Phytoprotection. 75:85. doi:10.7202/706075ar.
- Hermisson J, Pennings PS. 2005. Soft sweeps: molecular population genetics of adaptation from standing genetic variation. Genetics. 169:2335–2352. doi:10.1534/genetics.104.036947.
- James TK, Rahman A, Mellsop JM. 2005. Fathen (Chenopodium album): a biotype resistant to dicamba. New Zealand Plant Protection. 58:152–156. doi: 10.30843/nzpp.2005.58.4321
- Jasieniuk M, Brûlé-Babel AL, Morrison IN. 1996. The evolution and genetics of herbicide resistance in weeds. Weed Science. 44:176–193. doi:10.1017/S0043174500093747.
- Kreiner JM, Stinchcombe JR, Wright SI. 2018. Population genomics of herbicide resistance: adaptation via evolutionary rescue. Annual Review of Plant Biology. 69:611–635. doi:10.1146/annurev-arplant-042817-040038.
- Lemmon AR, Emme SA, Lemmon EM. 2012. Anchored hybrid enrichment for massively high-throughput phylogenomics. Systematic Biology. 61:727–744. doi:10.1093/sysbio/sys049.
- Lewthwaite SL, Triggs CM. 2009. Identification of paraquat-resistant Solanum nigrum and S. americanum biotypes. New Zealand Plant Protection. 62:349–355. doi: 10.30843/nzpp.2009.62.4811
- Liu C, Bridges ME, Kaundun SS, Glasgow L, Owen MD, Neve P. 2017. A generalised individual-based algorithm for modelling the evolution of quantitative herbicide resistance in arable weed populations: A generalised modelling framework for quantitative herbicide resistance. Pest Management Science. 73:462–474. doi:10.1002/ps.4317.
- López-Rodas V, Flores-Moya A, Maneiro E, Perdigones N, Marva F, García ME, Costas E. 2007. Resistance to glyphosate in the cyanobacterium Microcystis aeruginosa as result of pre-selective mutations. Evolutionary Ecology. 21:535–547. doi:10.1007/s10682-006-9134-8.
- Lusk C, Hurrell G, Harrington K, Bourdôt G, Saville D. 2015. Resistance of Ranunculus acris to flumetsulam, thifensulfuron-methyl and MCPA in New Zealand dairy pastures. New Zealand Journal of Agricultural Research. 58:271–280. doi:10.1080/00288233.2015.1016539.
- Malone JM, Boutsalis P, Baker J, Preston C. 2013. Distribution of herbicide-resistant acetyl-coenzyme A carboxylase alleles in Lolium rigidum across grain cropping areas of South Australia. Weed Research. 54:78–86. doi:10.1111/wre.12050.
- Marvá F, López-Rodas V, Rouco M, Navarro M, Toro FJ, Costas E, Flores-Moya A. 2010. Adaptation of green microalgae to the herbicides simazine and diquat as result of pre-selective mutations. Aquatic Toxicology. 96:130–134. doi:10.1016/j.aquatox.2009.10.009.
- Menchari Y, Camilleri C, Michel S, Brunel D, Dessaint F, Le Corre V, Delye C. 2006. Weed response to herbicides: regional-scale distribution of herbicide resistance alleles in the grass weed Alopecurus myosuroides. New Phytologist. 171:861–874. doi:10.1111/j.1469-8137.2006.01788.x.
- Neve P. 2008. Simulation modelling to understand the evolution and management of glyphosate resistance in weeds. Pest Management Science. 64:392–401. doi:10.1002/ps.1495.
- Oerke E-C. 2006. Crop losses to pests. The Journal of Agricultural Science. 144:31–43. doi: 10.1017/S0021859605005708
- Oerke E-C, Dehne H-W. 2004. Safeguarding production—losses in major crops and the role of crop protection. Crop Protection. 23:275–285. doi:10.1016/j.cropro.2003.10.001.
- Osteen CD, Szmedra PI. 1989. Agricultural pesticide use trends and policy issues (No. 622). Washington, DC: US Department of Agriculture, Economic Research Service.
- Owen MJ, Martinez NJ, Powles SB. 2014. Multiple herbicide-resistant Lolium rigidum (annual ryegrass) now dominates across the Western Australian grain belt. Weed Research. 54:314–324. doi:10.1111/wre.12068.
- Owen MJ, Martinez NJ, Powles SB. 2015a. Herbicide resistance in Bromus and Hordeum spp. in the Western Australian grain belt. Crop Pasture Sci. 66:466. doi:10.1071/CP14293.
- Owen MJ, Martinez NJ, Powles SB. 2015b. Multiple herbicide-resistant wild radish (Raphanus raphanistrum) populations dominate Western Australian cropping fields. Crop Pasture Sci. 66:1079. doi:10.1071/CP15063.
- Panozzo S, Colauzzi M, Scarabel L, Collavo A, Rosan V, Sattin M. 2015a. iMAR: An interactive web-based application for mapping herbicide resistant weeds. PLOS ONE. 10:e0135328. doi:10.1371/journal.pone.0135328.
- Panozzo S, Scarabel L, Collavo A, Sattin M. 2015b. Protocols for robust herbicide resistance testing in different weed species. Journal of Visualized Experiments. 101:e52923. doi:10.3791/52923.
- Pearson AJ. 2003. Trends in weed management in New Zealand orchards. New Zealand Plant Protection. 56:211–214. doi: 10.30843/nzpp.2003.56.6093
- Popay AI, Edmonds DK, Lytile LA, Phung HT. 1989. Chemical control of giant buttercup (Ranunculus acris L). New Zealand Journal of Agricultural Research. 32:299–303. doi:10.1080/00288233.1989.10423465.
- Preston C, Powles S. 2002. Evolution of herbicide resistance in weeds: initial frequency of target site-based resistance to acetolactate synthase-inhibiting herbicides in Lolium rigidum. Heredity. 88:8–13. doi:10.1038/sj.hdy.6800004.
- R Core Team. 2018. R: a language and environment for statistical computing. Vienna, Austria: R Foundation for Statistical Computing.
- Rahman A. 1982. Resistance of weeds to herbicides in New Zealand. In: Pesticide resistance seminar. Hastings, New Zealand: Hawkes Bay Branch of New Zealand Weed and Pest Control Society; p. 13–36.
- Rahman A, Patterson TM. 1987. Polygonum persicaria - a triazine-resistant biotype. Proceedings of the NZ Weed and Pest Control Conference. 40:186–188. doi: 10.30843/nzpp.1987.40.9933
- Renton M, Busi R, Neve P, Thornby D, Vila-Aiub M. 2014. Herbicide resistance modelling: past, present and future. Pest Management Science. 70:1394–1404. doi:10.1002/ps.3773.
- Ritz C, Baty F, Streibig JC, Gerhard D. 2015. Dose-response analysis using R. PLOS ONE. 10:e0146021. doi:10.1371/journal.pone.0146021.
- Sanson RL. 2000. Agribase–Introduction and history. Proceedings of the New Zealand Veterinary Association Epidemiology and Animal Health Management Branch Seminar, Wallaceville, Upper Hutt, New Zealand, 23. p. 61–4.
- Seefeldt S, Peters E, Armstrong ML, Rahman A. 2001. Cross-resistance in chlorsulfuron-resistant chickweed (Stellaria media). New Zealand Plant Protection. 54:157–161. doi: 10.30843/nzpp.2001.54.3714
- Streibig JC. 1988. Herbicide bioassay. Weed Research. 28:479–484. doi:10.1111/j.1365-3180.1988.tb00831.x.
- Thompson A. 1979. Helicopter spraying of nodding thistle with two rates of water. Proceedings of the NZ Weed and Pest Control Conference. 32:27–30. doi: 10.30843/nzpp.1979.32.10718
- Vila-Aiub MM, Gundel PE, Preston C. 2015. Experimental methods for estimation of plant fitness costs associated with herbicide-resistance genes. Weed Science. 63:203–216. doi:10.1614/WS-D-14-00062.1.
- Ritz C, Streibig JC. 2005. Bioassay analysis using R. Journal of Statistical Software. 12:1–22. doi: 10.18637/jss.v012.i05
Appendix
Figure A1. The proportion of survey simulations in which every case of resistance was missed. Panel headers show the percent of population samples, panel rows show the size of the sample population (number of farms). For simulations with farm numbers higher than 3000 some cases of resistance were detected in all simulations.
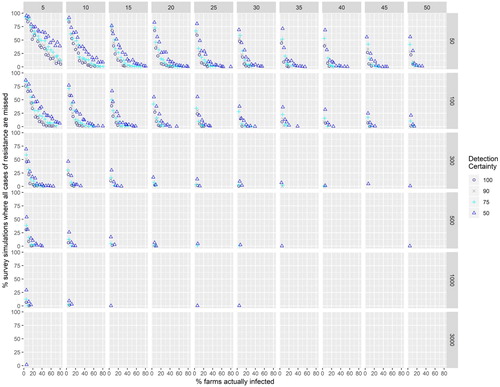
Figure A2. The proportion of survey simulations in which an estimate of resistance is obtained within 10% of the actual level of resistance. Panel headers show the percent of population samples, panel rows show the size of the sample population (number of farms). An absence of observations within 10% of the value results in no points being plotted.