?Mathematical formulae have been encoded as MathML and are displayed in this HTML version using MathJax in order to improve their display. Uncheck the box to turn MathJax off. This feature requires Javascript. Click on a formula to zoom.
ABSTRACT
Liveweight production, dry matter yield and botanical composition of three lucerne based pastures (lucerne monoculture, lucerne/brome, lucerne/cocksfoot) were quantified for five years from a grazed, dryland experiment at Ashley Dene, Canterbury. The objective was to determine if liveweight production by sheep was enhanced by inclusion of a companion grass species with lucerne. Over five growth seasons (2012/2013–2016/2017) annual liveweight production ranged from 439 kg/ha (lucerne/grass mixes in 2016/2017) to 883 kg/ha (lucerne in 2013/2014). Liveweight produced from the monoculture was greater than, or equal to, that of the mixes every year. Dry matter yields ranged from 6.3 (lucerne and lucerne/cocksfoot in 2016/2017) to 16.2 t/ha/yr (lucerne in 2013/2014) primarily due to differences in in-season rainfall. Annual yield from the monoculture was less than, or equal to, lucerne/grass mixes in most years. The relationship between liveweight production and lucerne yield was strong (R2 = 0.84). Earlier grazing of the mixes occurred in two of five years. After two years liveweight production from the lucerne/grass mixes was consistently lower than that achieved from the monoculture. However, in commercial situations drilling a runout lucerne stand with grass to extend stand life may be beneficial to provide an introductory feed prior to grazing a lucerne monoculture.
Introduction
Rainfed pastoral systems in summer dry regions along New Zealand’s east coast are at risk of becoming drier and more variable under predicted climate change scenarios (Salinger Citation2003). To create resilient dryland systems, previous work has initiated a change from grass-based to legume driven animal production. Simplified grazing management for lucerne (Medicago sativa L.) monocultures has been developed based on the physiological mechanisms which drive plant growth and development (Moot et al. Citation2003; Moot and Smith Citation2011; Moot et al. Citation2016). When these management practices have been applied on commercial properties transformational changes in production, profitability and long-term sustainability have been achieved (Avery et al. Citation2008; Moot and Avery Citation2013; Anderson et al. Citation2014).
As the area of lucerne on a property expands, there is a need to increase the duration of the productive season of the lucerne stands particularly in spring and autumn. In early- to mid-spring feed supply is often inadequate to meet animal demand (Webby and Bywater Citation2007). For lucerne, optimal management suggests the first paddock in the rotation is not grazed until it reaches ∼15 cm height (Moot et al. Citation2003). Inclusion of a lucerne/grass mix may offer the opportunity to (1) initiate lucerne grazing earlier, (2) allow a short period of set stocking before moving to a rotational grazing system, and (3) provide an introductory feed source which allows the rumen to adapt and reduce the risk of animal health issues from a lucerne monoculture. Additional benefits of a lucerne/grass mix include increased ground cover during regrowth to limit soil loss and inhibit weed establishment (McLeod and Douglas Citation1975) which may reduce the need for winter spraying.
In New Zealand, previous research has focused on DM yield comparisons between monocultures and lucerne/grass mixes (Cullen Citation1960; O’Connor Citation1967; Vartha Citation1967; Fraser Citation1982) with limited liveweight (LWt) data. The research showed earlier growth in the mixes but annually dry matter (DM) yields varied and depended on a range of factors including the companion grass species used, site, year, season and, environmental and management conditions experienced. Regardless, lucerne/grass mixtures are commonly used in dairy systems in South America and on sheep farms in Australia, so interest remains in their application in New Zealand.
For sheep and beef systems, farm profitability and subsequent long-term sustainability are a function of the quantity of LWt produced. This is determined by quantity and quality of the pasture on offer to grazing livestock (Mills et al. Citation2014, Citation2015). In summer dry environments earlier grazing would allow earlier lambing dates to increase the time available to reach sale weights before water stress restricts feed supply. Legume dominant diets result in higher animal intake (Cosgrove and Edwards Citation2007). Indeed, ruminants consistently selected 70%–75% legume and 25%–30% grass when grazing adjacent lucerne and grass monocultures (Rutter Citation2006). Voluntary grass intake by grazing stock may balance pasture intake with costs associated with a high legume diet and optimise pasture intake. Therefore, inclusion of a companion grass with lucerne may have a positive effect on animal liveweight production.
Pasture composition changes over time in response to biotic and abiotic factors. This means maintaining a lucerne/grass mix with 60%–80% lucerne may be difficult in the long-term. Eventually one, or more, pasture components will become dominant as they become more efficient at utilising available resources such as light, water and nutrients, for growth (Sanderson et al. Citation2004). There is a twofold impact which could lead to grass dominance in a lucerne/grass mixture. Firstly, during and immediately after grazing lucerne leaf area will be lower than that of the companion grass. Lower initial resource demand by lucerne means these resources are available for the companion species. Secondly, preferential grazing of the legume component (Rutter Citation2006), particularly by sheep, can have a negative impact on legume survival in the mix. Furthermore, winter growth rates of lucerne are low in temperate environments (Purves and Wynn-Williams Citation1989; Morris Citation2011; Ta Citation2018). Thus, in a mixture, growth of winter active grasses may compromise subsequent spring lucerne production in water-limited environments by depleting stored soil moisture.
The aim of the current research was to examine the total and seasonal DM production of lucerne and lucerne/grass mixes over several years and quantify the animal production achieved from them. Measurements also considered changes in the seasonal botanical composition of these pastures over time. The key relationship to quantify is the annual production of LWt in relation to the proportion of lucerne in the sward. To do this lucerne based pasture mixes, created with either brome (Bromus sp.) or cocksfoot (Dactylis glomerata) as a companion species, were compared with a lucerne monoculture. The expectation was that the lucerne/grass mixes would allow grazing to be initiated earlier in spring and finish later in autumn than the monoculture. The impact of these potential benefits on overall animal production was quantified over five years to also explore the effects of seasonal changes and account for variation in the abiotic factors (rainfall and temperature) typically experienced in a dryland pasture environment on the east coast of New Zealand.
Materials and methods
Site and soil
The ‘MaxLucerne’ dryland grazing experiment was established at the Ashley Dene Pastoral Systems Research Farm, Canterbury (172°19′25.23′′E; 43°39′0.60′′S; 40 m a.s.l.). The experiment covered 17.7 ha and, typical of soils formed on a floodplain, a variable patchwork of soils underlies the experimental area. The four soils (Typic Dystrustept, USDA taxonomy) are a Lismore stony (47% of total experimental area), Ashley Dene deep fine sandy loam (26%), Lowcliffe stony silt loam (26%) and patches of a Lowcliffe moderately deep silt loam soils (1%).
Available soil moisture in the top 1.0 m of soil ranges from 60–80 mm, in the stoniest soil, to 100–160 mm for the Ashley Dene deep fine sandy loam soil. Depth to stones also varies from <20 cm (Lowcliffe stony silt loam soil) to >90 cm under the Ashley Dene deep fine sandy loam soil (McLenaghen and Webb Citation2012).
Experimental design
A randomised complete block experiment was established in November 2011 to monitor LWt production, DM yield and botanical composition in a lucerne monoculture (Luc), a lucerne/brome mixture (Luc/Brome) and a lucerne/cocksfoot (Luc/CF) mixture under grazing. There were six replicates. Germination of the sown seed () ranged from 78.5% (‘Atom’ prairie grass; Bromus willdenowii) to 98.5% (‘Stamina 5’ lucerne).
Table 1. Pasture, cultivar, sowing rates (target and actual; kg/ha) and seedlot germination percentage (%) for the seeds sown in the ‘MaxLucerne’ grazing experiment at Ashley Dene, Canterbury, New Zealand.
Replicates 1 and 2 were established in Paddock C6E and Replicates 5 and 6 in Paddock C7E in November 2011. Both paddocks were previously in winter fed brassica crops and were subdivided into six individually fenced plots/paddock. Paddock C7W was sown as a ‘Kaituna’ lucerne monoculture on 13 October 2006. This paddock was used to create an age structure across paddocks (Replicates 3 and 4) which focused on extending the life of runout lucerne stands which would otherwise undergo pasture renewal.
In Replicates 1, 2, 5 and 6 the grasses were sown with a triple disc drill on 18 November 2011 and the next day lucerne was sown at right angles with a Duncan drill (C6E) or triple disc drill (C7E). The existing five-year-old lucerne monoculture was also split into six paddocks. Two paddocks were overdrilled with brome and two paddocks were oversown with cocksfoot. A ring laneway facilitated stock movement between paddocks. The 18 pasture plots ranged in size from 0.60 to 1.30 ha and total treatment areas were 5.66 ha for the lucerne monoculture, 5.73 ha for the Luc/CF mixes and 5.76 ha for the Luc/Brome mixes. In the older runout lucerne stands (Reps 3 and 4) the lucerne component was negligible in autumn of Year 4 (2015/2016) and so measurements ceased. Observations in Reps 1, 2, 5 and 6 continued until February 2017 when the experiment terminated.
There were two cultivars of brome and cocksfoot used. This gave three replicate paddocks of each of the grass cultivar paddocks. For the brome either ‘Bareno’ pasture brome (Bromus valdivianus) or ‘Atom’ prairie grass were sown. For cocksfoot mixtures either ‘Vision’ or ‘Safin’ cultivars were sown. There were three replicates each of these cultivar treatments. Visual evaluation of the grass plant population indicated poor establishment in all plots. Consequently, in autumn 2012 grasses were resown (oversown or overdrilled) with a Fiona drill at the same rates.
Environmental conditions
Rainfall and temperature
For the five growth seasons (2012/2013–2016/2017) A shows monthly rainfall, measured at Ashley Dene Farm, was highly variable and inconsistent. It ranged from a minimum of 8 mm (October 2015) to a maximum of 224 mm (June 2013). Rainfall was at or near average for only seven out of 56 months of data shown (12%) and above average in 12 of 56 months (21%). This meant in 37 of 56 months, or 66% of the time, rainfall was below average. On an annual basis, rainfall totalled 830 mm in 2012/2013 due to the abnormally high rainfall in June 2013 (224 mm) which caused flooding in non-experimental parts of the farm. It is unlikely that this rainfall contributed to extra growth for the 2012/2013 period as it occurred in winter when plant demand was minimal. However, it was expected to have recharged the entire soil profile to field capacity for the start of the 2013/2014 growth season, with any excess soil moisture expected to have drained from these stony soils.
Figure 1. A, monthly rainfall (mm) and B, mean air temperature (°C) monitored at Ashley Dene for five growth seasons from 2012/13 (July–June) and the long-term mean (LTM) for the period 1970–2010 recorded at the Burnham Sewage Plant located ∼3 km NE of Ashley Dene Farm which was the closest station with long-term rainfall data available for comparison.
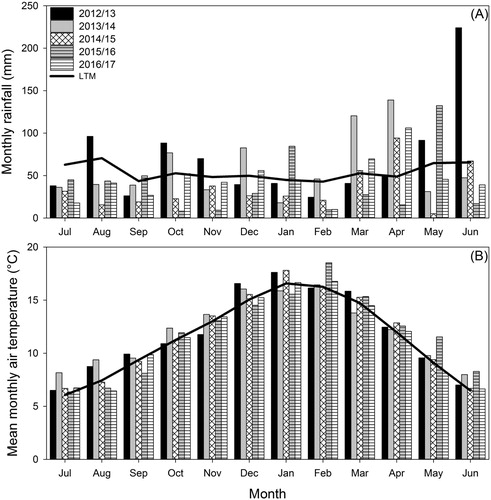
In Year 2 (2013/2014) rainfall totalled 712 mm which was also above average due to more than double the LTM monthly rain falling in March (120 mm) and April (139 mm). This was effective rainfall which occurred when autumn temperatures (B) were warm enough to stimulate plant growth in a year when soil water recharge at depth had been achieved from the high rainfall in June 2013, followed by above average rainfall in October (79 mm) and December (83 mm). These events maintained plant growth at times when it would typically cease on these stony light soils. They, therefore, provided a ‘wet’ season where production was close to maximal for the year. After this, El Niño conditions (NIWA Citation2019a) began to dominate and rainfall was 34% below average in Year 3 (2014/2015; 422 mm) and 24% below average in Year 4 (2015/2016; 491 mm). The rainfall for Year 4 appears higher than field growth data would suggest. This was due to 146 mm of rain falling in May 2016, when cooler temperatures restricted pasture growth. For the July–December period of Year 5 (2016/2017), rainfall totalled 236 mm which was about 100 mm less than the 328 mm LTM for the period.
Temperatures followed expected long-term seasonal patterns but mean monthly air temperatures tended to be above average for the July–January period in 2012 and 2013 and for the February–June 2016 period (B).
Potential soil moisture deficit
A potential soil moisture deficit (PSMD) was calculated (EquationEquation 1(1)
(1) ) for each year. Rainfall (R; mm) was measured on site and Penman potential evapotranspiration (PET; mm) was sourced from the Broadfields Meteorological Station which was the closest station with available daily PET data. Monthly mean PET was used when there were missing observations.
(1)
(1)
The potential soil moisture deficit (PSMD) calculated in CliFlo (NIWA Citation2019b) assumes total plant available water content is 150 mm so the same value was used here. The PSMD accumulated in daily increments from PET minus the rainfall. When rainfall caused the PSMD to become negative (effectively rainfall in excess of ‘field capacity’) the excess is assumed to have drained and is lost from the system. If the PSMD on a given day exceeds half the PAWC (75 mm; wilting point) then PET is multiplied by the calculated proportion specified in the following equation:(2)
(2)
This simulates reduced plant water use as stress develops and it becomes more difficult for the plant to extract soil moisture as the soil dries and plant transpiration declines in response.
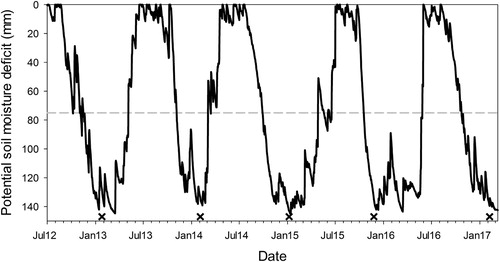
Across the four full growth seasons (2012/2013–2015/2016) there were between 120 (2013/2014) and 236 days (2014/2015) annually where the PSMD exceeded 75 mm (). For July 2016 to February 2017 the PSMD exceeded 75 mm for 128 days. The PSMD was not zeroed on 1 July and deficits carried over to the next year. In most cases this did not impact on the development of the PSMD which were generally <10 mm on 1 July. The 43 mm PSMD on 30 June 2015 did not fully recharge until 7 July 2015. Annually, accumulated water use (1 July–30 June) was 547 (2012/2013); 599 (2013/2014); 448 (2014/2015) and 455 mm (2015/2016). Between 1 July and 28 February for the final growth season (2016/2017) water use was 417 mm.
Figure 2. Potential soil moisture deficit (mm) calculated for the ‘MaxLucerne’ experiment at Ashley Dene, Canterbury for the period 1 July 2012–28 February 2017. Plant available soil water was set at 150 mm and PET was reduced (Equation (2)) when the PSMD exceeded 75 mm (dashed grey line). Crosses indicate the date pastures were destocked.
Management
Soil fertility and fertiliser applications
reports mean soil test results for the 0–7.5 cm soil layer taken in May/June annually. The primary purpose of these tests was to determine fertiliser requirements. Initial soil tests were taken in Paddocks C6E, C7W and C7E in May/June 2011 prior to sowing. After sowing the pastures were allowed to establish, and prior to initiating measurements for the first growth season (2012/2013) soil tests were again taken from each of the three paddocks and bulked across pasture treatments.
Table 2. Average soil test results (0–7.5 cm) of soil cores bulked across paddock or pasture treatment during the course of the ‘MaxLucerne’ dryland grazing experiment at Ashley Dene, Canterbury.
No treatment specific fertiliser applications were needed. No fertiliser was applied in 2012. In 2013 and 2014 an annual maintenance application of 180 kg/ha of 20% sulphur superphosphate (0% N, 8.1% P, 0% K, 20.5% S) was applied. In 2015 and 2016, single superphosphate (0% N, 9.1% P, 0% K, 10.8% S) was applied at 200 kg/ha.
Weed control
The lucerne monocultures received a winter weed control application of paraquat at 500 g a.i./ha and atrazine at 720 g a.i./ha to control dicot weeds. This was done in early July in 2012, between the 5th and 26th June in 2014, and on the 6th July in 2015. No herbicide application was made in Year 2 (2013/2014). Applications were made after the winter ‘clean up’ graze when leaf area was low to minimise any detrimental effect on the lucerne.
Animal health
Ewes and hoggets were treated annually for toxoplasmosis (Toxovax®), campylobacter (Campyvax4®) and gastrointestinal worms (Nilvax 5 in 1®). At tailing, all lambs received a preventative treatment of Clik® to prevent fly strike. Additional treatments were made as required. Lambs were drenched to control gastrointestinal worms at weaning and subsequently on an ‘as required’ basis. All stock were walked through a foot bath containing 8% zinc sulphate solution when foot scald occurred. Salt licks were available at all times for animals grazing the lucerne monocultures.
Measurements
Animal production
The experiment was grazed by sheep. In spring, ewes with twin lambs (E&L) grazed and, if feed supply in late spring/summer was sufficient, weaned lambs (WL) were returned to their initially assigned pasture treatments. Hoggets were the predominant stock class in autumn months. Pastures were generally destocked over winter (June–August) months.
In spring, stock were allocated to one of the three pasture treatments. Mobs were not replicated but one mob grazed each of the six replicate paddocks in a rotation for each of the three main pasture treatments. Therefore, a weighted mean daily liveweight gain (LWG; g/hd/d) was calculated and used in combination with the number of grazing days on each paddock to calculate replicated data suitable for statistical analysis. The weighted seasonal LWG was used in calculations for LWt production (kg/ha) because stock were weighed at irregular intervals. Across all stock classes and years, time between weighing events ranged from 7 (E&L, Luc/CF treatment, Spring 2015/2016) to 69 days (E&L, Luc/Brome, Spring 2014/2015). Weighted mean LWGs were calculated for individual stock classes for spring (July–November), summer (December–February) and autumn (March–June). Splitting seasons in this manner allowed for early starts (pregnant ewes grazing in August) and late finishes (‘production’ stock grazing May/June following drought recovery) due to variable feed supply to be attributed to the correct grazing season.
Grazing livestock were weighed periodically during ‘production’ grazing events. A ‘put and take’ system was used to match pasture supply and animal demand. All stock classes were weighed ‘full’ and in most cases all grazing livestock, regardless of pasture treatment, were weighed on the same day. Grazing by lactating ewes, lambs at foot, weaned lambs and some autumn grazing by hoggets were classified as ‘production’ grazing events and LWt production and DM yield were quantified. Stocking rate of ‘production’ livestock in each pasture over the duration of the experiment is shown in the Appendix. In some years feed supply exceeded animal demand. When this occurred a paddock was dropped from the rotational grazing system and was grazed by ‘maintenance’ stock. Similarly, ‘maintenance’ grazing events, mainly in summer and autumn, occurred for sward management. Dry matter yield and LWt production were not recorded for these events and the mob grazed plots rotationally, irrespective of pasture type. At other times cold weather or the early onset of water stress meant feed supply was inadequate to meet animal demand. Stocking rates were reduced or pastures were completely destocked during these periods. Animals were removed from the grazing experiment and put on pastures on the commercial farm.
Yield and botanical composition
In most cases, pasture height was recorded pre- and post-grazing with a height stick. Lucerne, sown grass or average sward height were then used to estimate average total paddock DM yield from a series of regression relationships generated from destructive harvest data. Paired comparison data (height and total DM yield) were recorded, in most cases, from three 0.2 m2 quadrats taken from areas of low, medium and high lucerne height. These destructive calibration samples were sorted (Cayley and Bird Citation1996) to determine botanical composition and dried until constant weight at 65 °C in a forced air oven. After drying, subsamples of the different pasture components were taken and bulked for each plot.
Statistical analysis
Data were analysed by ANOVA and linear regression in Genstat v18 (Lawes Agricultural Trust, VSN International Ltd.). When significant, treatment means were separated at the α = 0.05 level by Fishers protected least significant difference (LSD). Trends (α = 0.10) are also reported where necessary to interpret results.
Animal production
A weighted mean season liveweight gain was calculated for each stock class in each year and season. This was multiplied by grazing days recorded in each paddock to determine LWt production in kg/ha for each plot suitable for analysis. In 2013/2014, it was necessary to analyse annual LWt production by t-test to determine treatment differences. Excess feed supply in spring meant some paddocks were dropped from the rotation and grazed by ‘maintenance’ stock and LWt was not quantified which resulted in lower annual LWt production from those plots.
Calibration development to estimate DM yield
In total there were 2093 destructive quadrat samples taken for calibration development and botanical composition between 2012/2013 and 2016/2017. In 2012/2013 only lucerne height was recorded for the three treatments. In subsequent years, both lucerne and grass heights were recorded for the lucerne/grass (Luc/grass) mixes. For each calibration the height which accounted for the most observed variation (lucerne, grass or average) was used as the explanatory variate.
Each of the three pasture treatments required separate regression analysis. Regression analysis was unable to determine which height was best for a specific period for the Luc/grass mixes so data were manually coded and assigned the relevant height variable after manually inspecting the data and evaluating the all subsets regression outputs.
Multiple factors were used to improve yield estimates analysed by grouped linear regression. These included Year, Season, Observation type (pre- or post-grazing) and, at times, Pasture Age or Cultivar. For each of the pasture treatments analysed, the combination of these factors using all subsets regression followed by a grouped linear regression to generate parameters, resulted in R2 for the grouped linear regressions of 0.80–0.82. Regressions were not forced through the origin.
Yield analysis
For analysis of DM yield, pasture age structure was initially employed as a covariate but was not found to be significant for total annual yield or total annual LWt production and was removed from subsequent analyses. Total annual yield generally excludes any feed ingested during ‘maintenance’ grazing events when yield and composition were usually not determined. Grass cultivar was used as a factor for the analysis of the sown grass yields for botanical composition data. For clarity, graphs show grass species not grass cultivar but, where significant, grass cultivar effects are described in text. At times, seasonal yield and composition data may not equal the total accumulated yield due to rounding, incomplete rotations or when no composition was determined during a rotation. A correlation coefficient (r) was used to describe the changes in the proportions of lucerne and sown grass components over time.
Results
Net annual accumulated LWt production
In Year 1 (2012/2013) grazing by ewes and lambs was initiated on 5 September 2012 (). Annual LWt production was lowest from the Luc/Brome mix (748 kg LWt/ha) and highest (P < .001) from Luc and Luc/CF pastures (834 ± 10.5 kg LWt/ha). In Year 2 (2013/2014) stock began grazing on 6 September 2013. Plots 10 (Luc/CF) and 11 (Luc/Brome) were dropped from the first rotation in spring due to excess feed supply. Because of this, data were unbalanced and net annual LWt production of the pasture treatments was compared by a two-tailed t-test. This showed that there was no difference in net LWt production from Luc (883.5 ± 141.0 kg LWt/ha), Luc/Brome (824.1 ± 104.9) or Luc/CF (730 ± 98.8 kg LWt/ha) pastures.
Figure 3. Annual accumulated LWt production (kg LWt/ha) from ‘production’ stock grazing a lucerne monoculture (●), Luc/Brome (
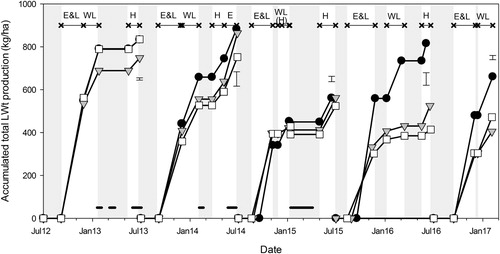
Year 3 (2014/2015) grazing was initiated on 12/8, 2/9 and 17/9 for the Luc/CF, Luc/Brome and Luc pastures, respectively. Despite the one month difference, total LWt production did not differ among the three pastures (551 ± 24.6 kg LWt/ha) but was lower than measured in the previous two growth seasons. In Year 4 (2015/2016), the lucerne monoculture produced 816 kg LWt/ha which was greater (P < .01) than the 469 ± 58.6 kg LWt/ha from the Luc/grass mixes. In the fifth and final year ewes and lambs entered all pasture treatments in mid-September (14–16 September 2016) and the experiment terminated with the removal of weaned lambs in early February. Total LWt production from the lucerne monocultures (661 kg/ha) was greater (P < .001) than the 439 ± 21.6 kg LWt/ha produced from stock grazing the Luc/grass mixes.
LWt production by stock class (gross LWt production)
Year 1 (2012/2013): Lactating ewes gained 118 ± 1.1 kg LWt/ha regardless of pasture type in 2012/2013 (A). However, lambs at foot produced 446 kg LWt/ha on Luc/CF pastures which was more (P < .05) than the 418 kg LWt/ha lambs produced on the Luc/Brome pasture. The 431 kg LWt/ha from lambs assigned to the lucerne monoculture was intermediate. Post-weaning, LWt production was lower (P < .001) on the Luc/Brome pasture (153 kg LWt/ha) than the 234 ± 11.1 kg LWt/ha from Luc and Luc/CF pastures. In autumn, hoggets grazing the Luc/Brome pastures gained 60 kg LWt/ha which was more (P < .001) than the 45 ± 1.5 kg LWt/ha from the other two pastures. Total lamb production (pre- and post-weaning) was 672 ± 15.1 kg LWt/ha over the spring/summer period from Luc and Luc/CF pastures which was more (P < .001) than the 571 kg LWt/ha from the Luc/Brome pasture.
Figure 4. Absolute LWt production (kg/ha) by lactating ewes, lambs at foot, weaned lambs, hoggets and dry ewes grazing three lucerne based dryland pastures in A, Year 1 (2012/2013); B, Year 2 (2013/2014); C, Year 3 (2014/2015); D, Year 4 (2015/2016) and E, Year 5 (2016/2017) at Ashley Dene, Canterbury.
Note: 2015/2016 six replicate paddocks were grazed in spring/summer and four replicate paddocks in autumn. 2016/2017 ran from 1 July 2016 to 28 February 2017 with four replicates. Lactating ewes lost (–) weight on all pastures in Year 2 and on Luc/grass mixes in Years 4 and 5. Error bars are pooled SEM for the sum of absolute LWt production.
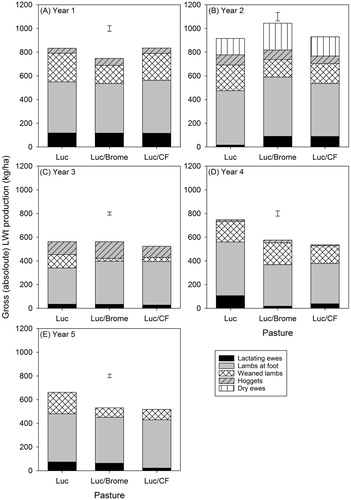
Year 2 (2013/2014): Over the course of the lactation phase, ewes on all pastures lost weight (B). However, liveweight losses were lower (P < .001) from ewes assigned to the lucerne monoculture (−16.4 kg/ha) than those grazing Luc/Brome or Luc/CF mixes (−87.2 ± 3.8 kg LWt/ha). The LWt losses by ewes on the Luc/Brome mix supported similar LWt production from their twin lambs at foot to those on lucerne (446 ± 11.9 kg LWt/ha) but the Luc/CF lambs (P < .01) only produced 381 kg LWt/ha. Post-weaning LWt production in summer was not different among the three pastures (177 ± 20.8 kg LWt/ha) nor was autumn LWt production from hoggets (77 ± 9.2 kg LWt/ha). Dry ewe LWt production from the Luc/Brome mix (222 kg LWt/ha) in autumn was superior (P < .001) to that from the lucerne monocultures or Luc/CF mixes (148 ± 7.9 kg LWt/ha). The total production from lambs (pre- + post-weaning) in the spring/summer period was 675 kg LWt/ha from the lucerne monoculture compared (P < .001) with 540 ± 18.9 kg LWt/ha for the Luc/Brome and Luc/CF mixes.
Year 3 (2014/2015): A trend (C) showed lactating ewes gained (P < .10) between 28 kg/ha (Luc/CF) and 34 ± 2.0 kg LWt/ha (Luc and Luc/Brome). There was also a trend (P < .10) which showed lambs at foot assigned to Luc/grass mixes gained ∼60 kg/ha more liveweight than lambs on the monoculture (306 kg LWt/ha). This occurred because ewes and lambs started grazing the Luc/grass mixes almost one month prior to those assigned to the lucerne monocultures. Weaned lamb production was superior from the lucerne monocultures (101 kg LWt/ha) compared (P < .001) with the 26 ± 9.7 kg LWt/ha from the Luc/Brome and Luc/CF mixes. However, this did not translate to higher total (pre- + post-weaning) lamb production for the spring/summer period which was 403 ± 17.5 kg LWt/ha regardless of pasture type. Overall, total lamb LWt production (pre- + post-weaning) in 2014/2015 was 135–272 kg LWt/ha lower than in the previous two growth seasons due to the dry spring (A). In autumn hoggets gained 117 ± 12.0 kg LWt/ha.
Year 4 (2015/2016): In spring ewes on lucerne gained 107 kg LWt/ha whereas ewes on the Luc/grass pastures lost (P < .001) (−)28 ± 7.9 kg LWt/ha (D). Liveweight production of lambs at foot was 453 kg LWt/ha from lucerne monocultures. A trend indicated this was more (P < .10) than the 345 ± 32.4 kg LWt/ha gained by lambs on the Luc/grass mixes. For the summer period weaned lambs gained a further 175 kg LWt/ha on the monoculture compared (P < .001) with 89 ± 4.2 kg LWt/ha from weaned lambs on the Luc/grass mixes. The total (pre- + post-weaning) lamb production ranged (P < .01) from 436 ± 38.0 kg LWt/ha from the Luc/grass mixes to 628 kg LWt/ha from the lucerne monoculture. In autumn, LWt production from the pasture treatments was minimal but ranged from 8.1 (Luc/CF) to (P < .01) 22.5 kg LWt/ha (Luc/Brome).
Year 5 (2016/2017): In 2016/2017, lactating ewes gained (P < .001) 74 kg LWt/ha grazing lucerne monocultures but lost (−)23 kg LWt/ha on Luc/CF pastures (E). Ewes on the Luc/Brome pastures lost (−)63 kg LWt/ha. However, the lambs at foot gained a comparable quantity of LWt (401 ± 16.1 kg LWt/ha) regardless of pasture type. For the final LWt period weaned lambs grazing lucerne gained 181 kg LWt/ha which was more (P < .05) than double the LWt produced by lambs on the Luc/grass mixes (84 ± 7.1 kg LWt/ha). The total LWt produced by lambs prior to destocking (pre- + post-weaning) was 596 kg LWt/ha for lambs assigned to lucerne monocultures which was greater (P < .01) than the 481 ± 20.4 kg LWt/ha from lambs grazing the mixes.
Weighted seasonal LWt gains (g/hd/d)
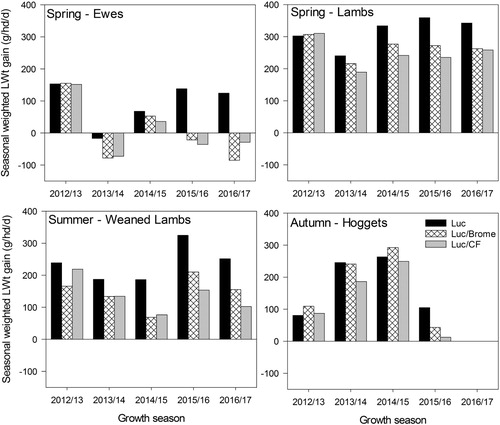
Weighted mean seasonal LWt gains (g/hd/d) for ‘production’ stock classes are presented in . Only lucerne consistently gave >300 g/hd/d growth rates for lambs at foot in spring, except in 2013/2014 (Year 2) when foot scald affected performance of grazing livestock across all treatments and the wider commercial farm. Post-weaning growth rates >200 g/hd/d were predominantly from animals assigned to the lucerne monocultures.
Figure 5. Weighted mean seasonal liveweight gains (g/hd/d) for lactating ewes (spring), lambs at foot (spring), weaned lambs (summer) and hoggets (autumn) grazing three dryland pastures at Ashley Dene, Canterbury over five growth seasons. No error bars are shown as data were unreplicated.
Dry matter yield
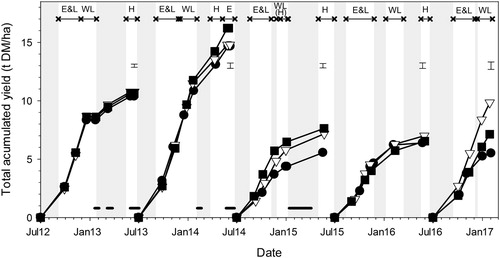
shows total accumulated annual DM yield in 2012/2013 (Year 1) did not differ among pasture treatments (10.6 ± 0.27 t DM/ha). Year 2 (2013/2014) had the greatest yield over the five growth seasons. Total DM yield was highest (P < .001) from the Luc/CF mix (16.2 t DM/ha) while Luc and Luc/Brome pastures produced 14.4 ± 0.45 t/ha. In Year 3 (2014/2015) the Luc/grass mixes produced 7.4 ± 0.38 t DM/ha which was more (P < .01) than the 5.6 t/ha produced from the lucerne monoculture. Pastures produced 6.6 ± 0.47 t DM/ha in 2015/2016 (Year 4) while in the final year (2016/2017) the 9.8 t DM/ha produce by the Luc/Brome pasture from July to February exceeded (P < .01) the 6.3 ± 0.64 t DM/ha produced by lucerne monocultures and Luc/CF treatments over the same period.
Figure 6. Total accumulated DM yields (t/ha) of Luc (●), Luc/Brome (▽) and Luc/CF (▪) dryland pastures for five growth seasons at Ashley Dene, Canterbury. Error bars are SEM for the annual yield. Periods of grazing by different stock classes (x–x) are: lactating ewes with twin lambs at foot (E&L), weaned lambs (WL), hoggets (H) and dry ewes (E). Grey shaded areas indicate periods where pastures were destocked. Thick black horizontal lines (—) indicate ‘maintenance’ grazing events by ewes or hoggets for sward management where LWt was not recorded.
Note: No DM yield measurements were taken for three ‘maintenance’ grazing events (summer 2012/2013, autumn 2012/2013 and autumn 2013/2014).
Spring DM production and botanical composition
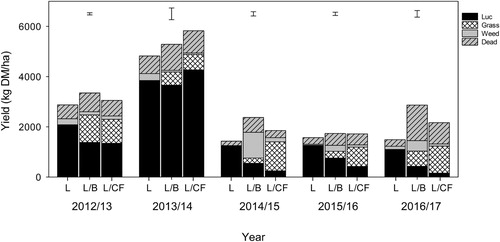
Yield and composition were measured at every spring grazing during the experimental period. shows total spring DM yield was 5454 ± 124.9 kg/ha in Year 1 (2012/2013) and did not differ among pasture treatments. Of this, the lucerne contributed 4442 ± 198.5 kg DM/ha in the Luc and Luc/CF pastures which was more (P < .01) than the 3520 kg lucerne DM/ha in the Luc/Brome pasture. There was no difference observed among companion grass cultivars, but a species trend indicated the 1182 kg brome DM/ha was more (P < .10) than the 716 kg DM/ha produced by the cocksfoot.
Figure 7. Spring DM yield (kg/ha) from lucerne (Luc), sown companion grass, weed and dead components of lucerne monocultures (L), lucerne/brome (L/B) and lucerne/cocksfoot (L/CF) pastures at Ashley Dene, Canterbury over five growth seasons. For clarity the error bar is SEM for total spring DM yield.
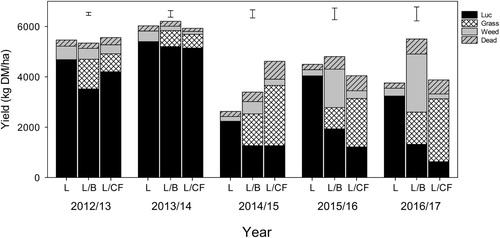
In Year 2 (2013/2014) total spring DM production was unaffected by pasture treatment (6054 ± 264.1 kg DM/ha). Similarly, the contributions from the lucerne (5247 ± 230.1 kg DM/ha) and sown grass (593 ± 61.0 kg/ha) components did not differ among pastures. In spring of Year 3 the 4616 kg DM/ha produced by the Luc/CF pasture was more (P < .01) than the 3010 ± 321.1 kg DM/ha produced from the Luc and Luc/Brome pastures. A trend showed the lucerne component yield in the monoculture (2234 kg DM/ha) was higher (P < .10) than the 1265 ± 288.7 kg DM/ha produced by lucerne in the mixtures. ‘Safin’ cocksfoot produced 2954 kg/ha which was more (P < .01) than the 1834 kg grass/ha from ‘Vision’ cocksfoot mix. ‘Atom’ prairie grass had the lowest grass yield (555 kg DM/ha).
In Year 4 the spring yield totalled 4436 ± 465.6 kg DM/ha. Lucerne contributed 4040 kg/ha in the monoculture which was 1.6 times more (P < .001) than in the Luc/grass mixes. In the mixes the yield of the sown grass component differed (P < .01) among cultivars and ranged from 527 kg/ha (‘Atom’ prairie grass) to 2095 kg/ha (‘Safin’ cocksfoot). Weeds contributed (P < .01) 256 kg DM/ha (Luc and Luc/CF) to 1529 kg DM/ha (Luc/Brome).
In the final spring of Year 5 (2016/2017) DM yield of all three pastures were not different (4379 ± 553 kg DM/ha). The 3237 kg lucerne DM/ha from the monoculture was more (P < .001) than the 972 ± 219 kg/ha in the Luc/grass mixes. Yield of the sown grass also differed (P < .05) among cultivars. The lowest grass yield was 831 kg/ha from the ‘Atom’ prairie grass. Weeds contributed 2308 kg DM/ha in the Luc/Brome pastures which was one order of magnitude more (P < .05) than the 250 ± 522 kg DM/ha of weeds in the Luc and Luc/CF pastures.
Summer yield and composition
In summer of Year 1 (2012/2013) two rotations were completed. Yield and composition were quantified for the one rotation grazed by ‘production’ livestock (). The 3346 kg DM/ha from the Luc/Brome was more (P < .01) than the 2963 ± 85.8 kg DM/ha produced by Luc and Luc/CF pastures. The lucerne component contributed 2086 kg DM/ha in the monocultures which was more (P < .001) than the 1362 ± 76.8 kg lucerne DM/ha from the mixes. Sown grasses contributed 1026 ± 142 kg DM/ha and showed no difference between species.
Figure 8. Summer DM yield (kg/ha) from lucerne (Luc), sown companion grass, weed and dead components of lucerne monocultures (L), lucerne/brome (L/B) and lucerne/cocksfoot (L/CF) pastures at Ashley Dene, Canterbury over five growth seasons. For clarity the error bar is SEM for total summer DM yield.
Summer DM production was highest in Year 2 (2013/2014). There was no difference in the quantity of total DM produced among the three pastures (5313 ± 466.5 kg DM/ha) of which 3924 ± 357.9 kg DM/ha was contributed by the lucerne component. Sown grass contributed 569 ± 79.1 kg/ha in the Luc/grass mixes. In Year 3 (2014/2015) total DM yield ranged (P < .01) from 1432 kg DM/ha (Luc) to 2354 kg DM/ha (Luc/Brome). Lucerne yields differed (P < .001) among treatments and ranged from 248 (Luc/CF) to 1232 kg DM/ha (Luc). Brome yield was 201 kg DM/ha which was less (P < .001) than the 1156 kg DM/ha yield from cocksfoot. Weeds contributed 93.3 ± 109.3 kg DM/ha in the Luc and Luc/CF pastures which was less (P < .001) than produced from the Luc/Brome pasture (1022 kg DM/ha). In Year 4 (2015/2016) 1675 ± 132 kg DM/ha was produced in summer. Lucerne contributed 1266 kg DM/ha in the monoculture, or double (P < .001) the 590 ± 108 kg lucerne DM/ha present in the mixes. Of the sown grass, cocksfoot yield (768 kg/ha) again exceeded (P < .05) that of brome (271 kg/ha).
For Year 5 there were two rotations by weaned lambs before the experiment ended. Yield, but not composition, was quantified for the second rotation. The Luc monoculture produced 1841 kg DM/ha compared (P < .001) with 3254 kg DM/ha from the Luc/CF pasture and 4336 kg DM/ha from the Luc/Brome pasture. In the penultimate rotation for the final summer season, lucerne contributed 1100 kg DM/ha in the monoculture compared (P < .01) with 293 ± 117 kg DM/ha in the Luc/grass mixes. Cocksfoot produced 1075 kg DM/ha compared (P < .05) with 602 kg/ha from the brome with the Luc/grass mixes. Weed yields ranged from a minimum of 107 ± 75.6 kg DM/ha (Luc and Luc/CF) to a maximum (P < .05) of 418 kg DM/ha (Luc/Brome). There was also a difference in the quantity of dead material present. The 264 kg DM/ha of dead material in the monoculture was less (P < .01) than the 1418 kg dead material/ha found in the Luc/Brome pasture. The 847 kg DM/ha present in the Luc/CF pasture did not differ from either treatment.
Autumn yield and composition
In autumn of Year 1 (2012/2013) there were three rotations completed. Total yield was quantified for two ‘production’ rotations. Total yield from these two periods was 2040 ± 166.7 kg DM/ha. In Rotation 6 (), lucerne yield in the monoculture (878 kg DM/ha) was more than double (P < .001) the 423 ± 48.8 kg/ha produced by the mixes. Sown grasses contributed 613 ± 22.6 kg DM/ha.
Figure 9. Autumn DM yield (kg/ha) from lucerne (Luc), sown companion grass, weed and dead components of lucerne monocultures (L), lucerne/brome (L/B) and lucerne/cocksfoot (L/CF) pastures at Ashley Dene, Canterbury over five growth seasons. For clarity the error bar is SEM for total summer DM yield. Composition data was incomplete in Year 1 so no error bar is shown.
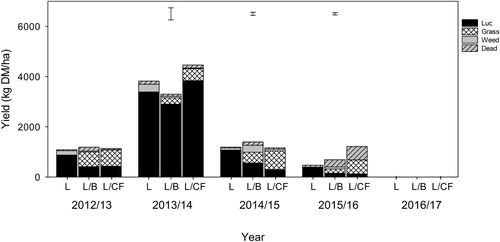
Autumn production was highest in Year 2 (2013/2014) and totalled 4419 ± 478.9 kg DM/ha regardless of pasture treatment. Lucerne contributed 3935 ± 414.8 kg DM/ha. The 481 kg DM/ha produced by cocksfoot was almost double (P < .05) the 246 kg DM/ha produced by brome in the Luc/grass mixes. In Year 3 (2014/2015) autumn yield was 1250 ± 125.1 kg DM/ha. The lucerne component was highest (P < .001) in the monoculture (1073 kg/ha) and lowest in the Luc/CF pasture (299 kg/ha). Cocksfoot yield (743 ± 75.0 kg/ha) was more (P < .05) than the 431 kg DM/ha produced by brome.
In Year 4 (2015/2016) the 1218 kg DM/ha from the Luc/CF pasture was more than double (P < .01) the 583 ± 91.1 kg DM/ha produced by the Luc and Luc/Brome pastures. In Rotation 5, the 391 kg lucerne DM/ha in the monoculture was more (P < .01) than the 140 ± 41.8 kg DM/ha from the mixes. The contribution of dead material differed (P < .001) among all three pastures and ranged from 79 (Luc) to 534 kg DM/ha (Luc/CF).
Relationship between sown pasture components over time
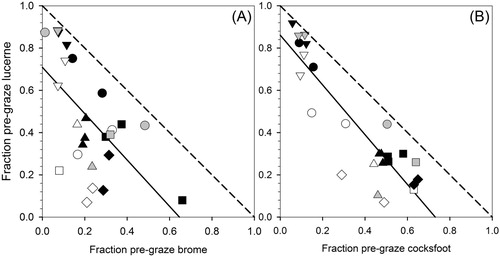
The correlation between the proportion of lucerne and sown grasses contributing to pre-graze yields within the Luc/grass mixes shows lucerne was not solely replaced by grass (1:1 replacement). However, the cocksfoot replaced lucerne more fully (r = 0.87; B) than the brome (r = 0.60; A) which is consistent with greater weed content in the Luc/Brome over time.
Figure 10. Correlation between the fractions of lucerne and sown grass in the A, Luc/Brome and B, Luc/CF mixes in 2012/2013 (circles), 2013/2014 (downward triangles), 2014/2015 (squares), 2015/2016 (upward triangles) and 2016/2017 (diamonds) in spring (black fill), summer (white fill) and autumn (grey fill) at Ashley Dene, Canterbury. Dashed line is the 1:1 line. Correlation coefficients (r) were A, 0.60 and B, 0.87.
Relationship between yield and LWt production
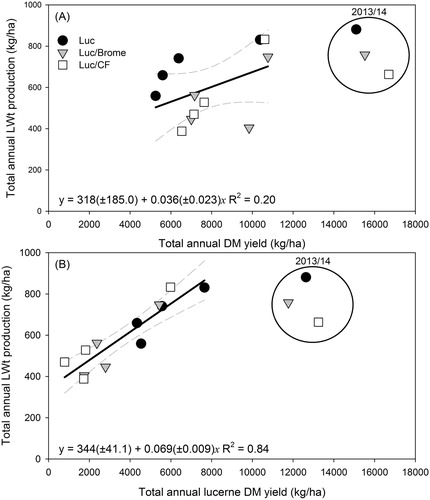
Annually, total DM on offer explained 20% of the observed variation in net annual LWt production (A). In contrast, pre-graze lucerne yield and total LWt production accounted for 84% of the observed variation (B). The production rate was 6.9 ± 0.09 kg LWt/ha/yr per 100 kg lucerne DM/ha/yr on offer, or 14.5 kg lucerne DM per kg LWt produced. The impact of scald in 2013/2014 could be extrapolated from the regression to suggest ∼440 kg LWt/ha may have been lost due to the wet spring.
Figure 11. Relationship between net annual liveweight (LWt) production (kg/ha) and A, total annual DM yield or B, total annual lucerne DM yield in Luc (black circle), Luc/Brome (grey triangle) and Luc/CF (white square) pastures between 2012/2013 and 2016/2017. Note: 2013/2014 data (circled) was excluded from analysis due to impeded livestock performance resulting from foot scald but is shown for completeness. 2016/2017 was a partial growth season (July–February).
Discussion
Yield and LWt relationships
The 6.9 kg LWt/ha per 100 kg DM of pre-graze lucerne produced on an annual basis (B) is consistent with the 5.0–7.0 kg LWt/ha/yr per 100 kg total DM/ha/yr reported previously for lucerne and grass/clover mixes grazed by ewes and lambs, weaned lambs and hoggets (Mills et al. Citation2015). The implication is that small areas of improved forages in a farm system can produce high liveweight gains even when stocked for only short periods. The benefit of growing animals quickly in a dryland environment were highlighted by Year 3 when low spring rainfall restricted pasture growth.
Of interest was the LWt and DM production in Years 1, 3 and 4. Specifically, there was superior LWt production from the Luc monoculture in Year 4 compared with Year 3 (), despite comparable total annual DM (). shows that in the spring period there was more lucerne on offer in Year 4 while on an annual basis indicated the importance of legume in driving LWt production. The differences in the quantity of lucerne on offer annually accounted for 84% of the observed variation in annual LWt production. Similarly, LWt from ewes and twin lambs in Year 1 and Year 4 were comparable () even though there was superior total DM produced in Year 1 (). Again, this was explained by the quantity of lucerne on offer. The correlation between LWt production and legume on offer in the spring period was described fully in Mills and Moot (Citation2019).
Over the five growth seasons total LWt production ranged from 405 (Luc/Brome, Year 5) to 884 kg LWt/ha (Luc, Year 2). This is lower than the 750–1250 kg LWt/ha reported for a lucerne monoculture over eight years at Lincoln University (Mills et al. Citation2015). The differences reflect the lower soil water holding capacity and its subsequent impact on lucerne yield to support animal LWt production. The results show that in four out of five years the total quantity of feed on offer in spring did not differ among pasture treatments (). However, over time composition changed and in most years the contribution of lucerne in the monoculture was superior to the Luc/grass mixes. This superiority contributed to higher LWt gains () particularly in the final two spring seasons when the mixes were dominated by grass and weeds ().
This experiment measured higher total lamb meat production in four out of five years from lucerne monocultures, regardless of similar or lower total DM yields. The decline in LWt production from the Luc/grass mixes over time indicates the lucerne component drove the total animal production. This differential in LWt production may increase over time as the monocultures persist and the mixes become more grass and weed dominant.
For summer dry farms, where the majority of profit is determined by production in spring, lucerne stands should be kept as monocultures to maximise per head LWt production and LWt produced per hectare. However, from a commercial perspective, the inclusion of a grass to extend the life of runout lucerne, as examined in Reps 3 and 4, offers an area to provide an early introductory feed source for young lambs or stock coming off lower quality feeds. This may minimise nutritional disorders associated with stock moving from low to high quality feed sources. Best practice grazing management specifies a 7–14 d period for the rumen population to adjust (Nichol Citation2007). There are no published literature specifically on this in lucerne but a mixed Luc/grass pasture would provide voluntary selection, prevent a sudden change in feed associated with immediate entry to a lucerne monoculture and prevent hungry animals gorging on high quality feed when initially introduced to a lucerne monoculture. The area cannot be expected to persist beyond 2–3 years before the lucerne disappears but it could add flexibility to overall grazing management of lucerne over the whole farm. Additionally, no herbicides were applied to the Luc/grass mixes. In the first two years the grasses adequately suppressed weeds and reduced the need for chemicals. This may be beneficial in organic grazing systems to promote stand longevity.
Changes in sown species composition
The correlation between lucerne and sown grass was stronger for pastures established with cocksfoot (r = 0.87) than brome (r = 0.60; ). The Luc/Brome mix, initially suppressed weeds in Years 1 and 2, but subsequently weed content increased. This was particularly evident in the spring period (). ‘Atom’ prairie grass is considered less persistent than other temperate grasses because of increased loss in summer (Kemp et al. Citation1999). Here, seasonal botanical composition data showed spring yields of ‘Atom’ were less than all other grass cultivars in Years 3–5. From autumn of Year 2 onwards, at a species level, brome yields were consistently lower than those of cocksfoot in the summer () and autumn (). This suggests both brome cultivars failed to suppress weeds after the first two years. It is likely the weed ingress over time was due to a loss of grass tillers in combination with increased grazing pressure on the lucerne component causing the loss of lucerne plants and subsequent opening of gaps in the swards. In contrast, weed suppression was maintained in the Luc/CF pastures. The more competitive behaviour of cocksfoot for resources (Lee and Cho Citation1985; Mills et al. Citation2014), restricted weed ingress and meant the correlation was closer to the 1:1 replacement line (). The loss of lucerne from the Luc/CF pasture treatment may also reflect increased grazing pressure on the lucerne component, and potentially lead to nitrogen deficiency in the cocksfoot.
A feature of the results was the annual variability of both plant and animal production which reflects the highly variable nature of east coast environments. Pastures were destocked at different times. The earliest destocking occurred in Year 4 (25 November 2015) and the latest was in Year 5 when the experiment terminated (7 February 2017). Thus, there was a more than two month difference in destocking which occurred near the maximum PSMD each year (). Sheep and beef farmers dealing with this variability need flexibility in their management as was demonstrated for each individual year of this experiment.
Year 1 (2012/2013)
In Year 1 annual LWt production was lowest from the Luc/Brome mix (748 kg LWt/ha) () but there was no difference in pre-graze annual DM yield among pastures (10.6 ± 0.27 t DM/ha; ). The difference in LWt production was primarily a result of lower lamb LWt production from the Luc/Brome treatment (A) in the spring and summer. Total spring DM yields did not differ among treatments () however, lucerne contributed 26% more DM in the Luc and Luc/CF pastures than the 3520 kg DM/ha in the Luc/Brome. As expected, there was also 66% more sown grass in the Luc/Brome pasture than in the Luc/CF pasture because cocksfoot is slower to emerge due to high initial thermal time requirements (Moot et al. Citation2000) compared with other temperate pasture grasses. These differences in composition of feed on offer did not translate to differences in spring lamb growth rates () which were comparable across treatments (∼307 g/hd/d). However, there were ∼10% more grazing days on the Luc and Luc/CF pastures than on Luc/Brome in the spring.
In summer, weaned lamb production from the Luc/Brome pastures was 35% lower than the 234 ± 11.1 kg LWt/ha produced by the Luc and Luc/CF pastures (A) even though total yield on offer was 13% greater (). The increased lucerne on offer in the monoculture explains the higher LWt production from this treatment. In contrast, the quantity and composition of feed on offer in summer from both Luc/grass mixes was similar but the seasonal weighted LWt gain was 24% lower for Luc/Brome lambs (). This indicated either feed quality and/or intake limited LWt production from the Luc/Brome pasture. Visual observation suggested stock rejected the brome because it had gone reproductive, so intake may have been lower.
Year 2 (2013/2014)
In Year 2 pastures produced a similar amount of LWt annually () but LWt production was lower than expected given this year produced the highest DM yields (). The Luc/CF mix produced 16.2 t DM/ha which was 13% more than was produced from the Luc and Luc/Brome pastures. In spring, lactating ewes lost weight on all treatments (B) and spring LWt gains of twin lambs at foot (189–240 g/hd/d) were the lowest measured over the five years of the experiment (). These growth rates are lower than the 251–348 g/hd/d growth rates previously reported for lambs at foot (Rattray et al. Citation1982; Douglas et al. Citation1995; Mills et al. Citation2015). This was the wettest growth season (A). Wet conditions under foot, and above average rainfall in June 2013, meant livestock across the entire farm developed foot scald from early spring. On this experiment livestock were treated for scald on three separate occasions however, lameness compromised potential LWt production and probably caused the lower than expected LWt observed from the high DM yields ().
In the summer period, weaned lambs grew at 134 (Luc/grass) to 187 g/hd/d Luc (). Again, these were lower than the 180–270 g LWG/day reported previously for weaned lambs on lucerne (McLean et al. Citation1967; Douglas et al. Citation1995; Wang et al. Citation2009). Cruickshank (Citation1986) previously reported growth rates of ∼315 g/hd/d for lambs fed lucerne or white clover which was ∼38% greater than lambs fed perennial ryegrass or prairie grass. Their higher lamb growth rates were associated with higher DM intake from animals ingesting a legume diet compared with those fed grass diets. The lamb growth rates in this ‘MaxLucerne’ experiment were lower than expected given the feed on offer. Potentially, recovery from foot scald continued to impact LWt production into the summer months. There was no difference in total summer DM yield, nor yield of the sown components () and pastures produced similar LWt (B). This indicated all three mobs were similarly affected. Autumn DM production was 4419 ± 478.9 kg DM/ha and the highest of the five years (). Dry ewes were initially put on for a ‘maintenance’ grazing event grazed for longer than expected when rainfall stimulated pasture growth. Consequently, they were weighed and re-assigned to a ‘production’ phase. These animals produced an additional 222 kg LWt/ha on the Luc/Brome pasture and 148 kg LWt/ha grazing the Luc and Luc/CF pastures (B).
Overall, this second production season showed the impact of environmental factors on animal health and LWt production thought the spring and summer. Foot scald had a major impact on performance of priority stock which could not be compensated for by greater DM yield on offer. Poor feed conversion efficiency meant priority stock took longer to reach saleable weights for slaughter. This would have impacted on farm profitability for the year as schedule prices tend to decrease later in the season. This was the only animal health issue encountered across five years.
Year 3 (2014/2015)
Year 3 (2014/15) saw the onset of El Niño conditions with rainfall 34% below average (A) and monthly rainfall consistently below average from July to February. This resulted in lower annual LWt production than measured in the previous two growth seasons () but no difference in the quantity of LWt produced from the three pasture treatments (551 kg LWt/ha). This occurred even though grazing on the Luc/CF pasture began one month earlier than with the lucerne monoculture (18 September 2018) and despite 32% more total annual DM yield from the Luc/grass mixes ().
In spring, a positive effect of the earlier grazing on the Luc/grass mixes was twin lambs gained ∼60 kg/ha more liveweight than lambs on the monoculture (306 kg LWt/ha: C). Year 3 was the first of two years where inclusion of a grass component was positively expressed in the ability to graze earlier than on a monoculture (). However, it was also the first year of the developing El Niño weather pattern which resulted in early onset water stress with a total of 236 days where the PSMD exceeded 75 mm (). The early water stress meant there was insufficient feed and this resulted in a period of destocking between the removal of ewes and lambs and the return of weaned lambs to the plots for the first time ().
The additional one month of early grazing from the Luc/grass mixes compensated for the 22% lower mean daily growth rate of stock grazing those mixes (259 g/hd/d; ). This resulted in 19% more LWt production for lambs at foot grazing the mixes () compared with stock assigned to the lucerne monoculture. However, the spring LWt difference was not purely a result of the quantity of feed available as the Luc/CF pasture had 25% more total DM on offer () but similar LWt production to the Luc/Brome pasture (C). Thus, composition also impacted spring LWt production. The two mixes had 1265 kg lucerne DM/ha on offer, with more sown grass present in the Luc/CF pasture (). This was mainly a result of less DM from the ‘Atom’ prairie grass sub-treatment (555 kg DM/ha). The decline of ‘Atom’ prairie grass had begun in autumn of Year 2, when cocksfoot first out-yielded brome (). This provided an opportunity for weed encroachment and subsequent pasture deterioration. Thus, prairie grass could be considered a short-term perennial to extend the life of a declining lucerne stand, as occurred for Reps 3 and 4 of this experiment.
Lucerne yielded 248 (Luc/CF) to 1232 kg DM/ha (Luc) in the summer period (). This additional legume production resulted in an almost four-fold increase in the amount of LWt produced by weaned lambs grazing the monoculture compared with those grazing Luc/grass mixes (C). Weaned lambs gained ∼73 g/h/d on the mixtures compared with 187 g/hd/d for those grazing lucerne alone (). This additional summer LWt from the lucerne DM production compensated the later spring productivity and thus, resulted in similar LWt production from the three pastures on an annual basis (C). This result highlighted the benefit of high quality feed being produced from lucerne in response to summer rainfall.
Year 4 (2015/2016)
In 2015/2016 (Year 4), El Niño conditions continued with annual rainfall 24% below average (A) and 455 mm of water used. Stock began grazing the Luc/CF treatment on 12 August 2015, Luc/Brome on 2 September 2015 and Luc monocultures on 17 September 2015 (). Treatments were destocked on 20/11, 13/11 and 25/11, respectively due to a lack of feed as pastures again ran out of water. Annual LWt production of the lucerne monoculture totalled 816 kg LWt/ha which was 74% greater than that produced from the Luc/grass mixes even though there was no difference in pasture yield among treatments (6.6 t DM/ha; ). The difference in annual LWt production was due to differences in animal production and pasture composition in the spring and summer periods.
In spring, both ewes and lambs at foot grazing the monoculture produced more LWt than those assigned to the Luc/grass mixes (D). Total spring DM production was 4436 ± 465.6 kg DM/ha and did not differ among pastures (). However, composition differed and there was 4040 kg lucerne DM/ha on offer in the monoculture which was 1.6 times more than that on offer in the Luc/grass mixes. With more legume on offer twin lambs on lucerne grew at 360 g/hd/d compared with ∼254 g/hd/d on the Luc/grass mixes (). The lack of difference between LWt produced by the Luc/grass mixes, even though contributions of the sown grass component differed among cultivars, indicated either grazing selectivity or feed intake, possibly from vegetative weeds, compensated for reduced contribution of the brome component particularly in the ‘Atom’ based mixes. Importantly, this year showed the benefit of early spring grazing in dryland systems facilitated by inclusion of the grass component. This offers farmers more management alternatives when water stress develops by weaning early and moving to a leader/follower system. This could help get priority stock to sale weights before feed supply limits animal production.
For the summer period, weaned lambs gained a further 175 kg LWt/ha on the monoculture which was almost double that produced from Luc/grass mixes (D). Again, feed on offer did not differ among pastures but there was more than double the lucerne on offer in the monoculture (). This resulted in mean daily growth rates ranging from 154 (Luc/CF) to 325 g/hd/d (Luc). The lower growth rate on Luc/CF reflects more sown grass compared with the Luc/Brome pasture where initially sown grass had been replaced by weeds which had invaded the pasture as brome failed to persist.
Year 5 (2016/2017)
In the final growth season (July 2016–February 2017) ewes and lambs entered all pasture treatments in mid-September (14–16 September 2016; ). Animals were removed between 30 November 2016 (Luc/CF) and 4 December 2016 (Luc/Brome) for weaning but, for the third time in five years, a lack of feed meant weaned lambs had to graze elsewhere on the farm until 13 December 2016 when grazing resumed. The experiment was terminated on 7 February 2017 when feed supply was insufficient and pastures were destocked. Total LWt production from the Luc treatment was 53% greater than the 439 kg LWt/ha produced from stock grazing the Luc/grass mixes even though the Luc/Brome pasture produced 56% more DM than the Luc and Luc/CF pastures (6.3 t DM/ha; ).
For the spring period, lactating ewes on the Luc/grass pastures lost (−)22.6 (Luc/CF) to (−)62.9 kg LWt/ha to support LWt production by suckling lambs (E). This suggests LWt loss by dams on these treatments was due to greater pressure by lambs prior to weaning but the strategy was successful with 401 ± 16.1 kg LWt/ha produced by twin lambs at foot in the lactation phase. There was no treatment effect on the total quantity of feed on offer (4379 kg DM/ha; ). However, the 972 kg/ha of lucerne on offer in the Luc/grass mixes was insufficient to maintain high lamb growth rates compared with the 3237 kg lucerne DM/ha on offer in the monoculture. Lambs grew at ∼261 g/hd/d on the mixes which was 24% lower than the 343 g/hd/d for twin lambs grazing the Luc monoculture (). Weeds contributed 2308 kg DM/ha in the Luc/Brome pastures in the final spring which represented 52% of the total DM on offer (). Differences in spring LWt production () reflect more lucerne on offer in the monoculture compared with the Luc/grass mixes. This replicated the result found in Year 4. However, the difference in LWt production between the Luc/Brome and Luc/CF pastures indicated that weed encroachment into the Luc/Brome had reached a level where potential LWt production was compromised due to the lack of persistence of the bromes within this dryland environment. This was one reason the experiment was terminated. At this point the lucerne monocultures were still productive and would not have needed to be renewed.
In summer, DM yield was lowest from the Luc pasture (1841 kg DM/ha) and highest from Luc/Brome pastures (4336 kg DM/ha) but LWt production from weaned lambs grazing the monoculture was more than double that achieved on the Luc/grass mixes (E). The higher lamb liveweight gains from stock grazing the monoculture () reflected more lucerne herbage on offer in the monoculture (). There was no difference in LWt production between the cocksfoot and brome mixes but it appeared that lambs grazing the Luc/CF grew at a slower rate (102 g/hd/d) than those on the Luc/Brome pasture (155 g/hd/d; ), which was associated with more sown grass on offer in the Luc/CF mix (). It is likely that the quality of the cocksfoot on offer may have limited LWt production. Grazing preference for cocksfoot has previously been shown to improve as N fertility increases (Edwards et al. Citation1993) and for optimal growth cocksfoot requires a greater N% than ryegrass for non-limited growth (Mills et al. Citation2009). Thus, the loss of lucerne in the Luc/CF pasture would have less N cycling to the companion grass resulting in reduced grazing preference and thus lower LWt gains by grazing livestock. The quality of the herbage in each treatments over time may also have contributed to differences in liveweight gains and requires further investigation.
Conclusions
Annual liveweight production from lucerne monocultures was greater than, or equal to, that from Luc/grass mixes in all five years, mainly due to increased liveweight production in the critical spring period. Twin lambs grazing lucerne grew 302–359 g/hd/d in four out of five years. Lambs grazing Luc/grass pastures only achieved comparable growth rates in Year 1, when pastures were lucerne dominant.
The inclusion of a companion grass enabled earlier grazing than on the lucerne monocultures in two years. However, this benefit did not translate into increased annual LWt production relative to the monoculture.
The inclusion of a grass benefited the runout pastures (Reps 3 and 4) through increased lucerne stand life. An additional four years were gained before loss of lucerne in the mixes triggered renewal.
Disclosure statement
No potential conflict of interest was reported by the authors.
Additional information
Funding
References
- Anderson D, Anderson L, Moot DJ, Ogle GI. 2014. Integrating lucerne (Medicago sativa L.) into a high country merino system. Proceedings of the New Zealand Grassland Association. 76:29–34. doi: 10.33584/jnzg.2014.76.2951
- Avery D, Avery F, Ogle GI, Wills BJ, Moot DJ. 2008. Adapting farm systems to a drier future. Proceedings of the New Zealand Grassland Association. 70:13–18. English. doi: 10.33584/jnzg.2008.70.2710
- Cayley JWD, Bird PR. 1996. Techniques for measuring pastures. 2nd ed. Hamilton: Pastoral and Veterinary Institute.
- Cosgrove GP, Edwards GR. 2007. Control of grazing intake. In: Rattray PV, Brookes IM, Nichol AM, editors. Pasture and supplements for grazing animals. Christchurch: New Zealand Society of Animal Production; p. 61–80.
- Cruickshank GJ. 1986. Nutritional constraints to lamb growth at pasture [PhD thesis]. University of Canterbury. https://researcharchive.lincoln.ac.nz/handle/10182/1988.
- Cullen NA. 1960. Lucerne-grass mixtures. Proceedings of the New Zealand Grassland Association. 22:122–129.
- Douglas GB, Wang Y, Waghorn GC, Barry TN, Purchas RW, Foote AG, Wilson GF. 1995. Liveweight gain and wool production of sheep grazing Lotus corniculatus and lucerne (Medicago sativa). New Zealand Journal of Agricultural Research. 38:85–104. doi: 10.1080/00288233.1995.9513108
- Edwards GR, Lucas RJ, Johnston MR. 1993. Grazing preference for pasture species by sheep is affected by endophyte and nitrogen fertility. Proceedings of the New Zealand Grassland Association. 55:137–141. doi: 10.33584/jnzg.1993.55.2074
- Fraser TJ. 1982. Evaluation of ‘grasslands Matua’ prairie grass and ‘grasslands Maru’ phalaris with or without lucerne in Canterbury. New Zealand Journal of Experimental Agriculture. 10:235–237. doi: 10.1080/03015521.1982.10427876
- Kemp PD, Matthew C, Lucas RJ. 1999. Pasture species and cultivars. In: White J, Hodgson J, editors. New Zealand pasture and Crop Science. Auckland: Oxford University Press; p. 83–99.
- Lee HJ, Cho MJ. 1985. Root competition and productivity in mono- and binary association of four forage species. Proceedings of the XV International Grassland Congress; Aug 24–31; Kyoto, Japan. p. 663–665.
- McLean JW, Thomson GG, Lawson BM. 1967. A study of the nutritive value of lucerne pasture. In: Langer RHM, editor. The lucerne crop. Christchurch: A.W. & A.W. Reed; p. 272–275.
- McLenaghen R, Webb TH. 2012. Soil properties and fertility of Ashley Dene: the challenge. In: Lucas RJ, Gow N, Nichol A, editors. Ashley Dene Lincoln University farm: the first 100 years. Christchurch: Lincoln University; p. 17–22.
- McLeod CC, Douglas JA. 1975. Autumn over drilling of lucerne with cereals and annual ryegrasses to improve spring production in South Canterbury and North Otago. Proceedings of the New Zealand Grassland Association. 37:228–236. doi: 10.33584/jnzg.1975.37.1422
- Mills A, Lucas RJ, Moot DJ. 2014. ‘Maxclover’ grazing experiment: I. Annual yields, botanical composition and growth rates of six dryland pastures over nine years. Grass and Forage Science. 70:557–570. doi: 10.1111/gfs.12132
- Mills A, Lucas RJ, Moot DJ. 2015. ‘Maxclover’ grazing experiment. II. Sheep liveweight production from six grazed dryland pastures over eight years. New Zealand Journal of Agricultural Research. 58:57–77. doi: 10.1080/00288233.2014.978481
- Mills A, Moot DJ. 2019. Relationships between liveweight production and dry matter yield for lucerne based pastures in spring. Journal of New Zealand Grasslands. 81. In Press.
- Mills A, Moot DJ, Jamieson PD. 2009. Quantifying the effect of nitrogen of productivity of cocksfoot (Dactylis glomerata L.) pastures. European Journal of Agronomy. 30:63–69. doi: 10.1016/j.eja.2008.07.008
- Moot DJ, Avery D. 2013. Sustainable intensification of livestock grazing systems in low rainfall regions of New Zealand. First International Conference on Global Food Security; Sep 29–Oct 2; Noordwijkerhout, The Netherlands.
- Moot DJ, Bennett SM, Mills A, Smith MC. 2016. Optimal grazing management to achieve high yields and utilisation of dryland lucerne. Journal of New Zealand Grasslands. 78:27–33. doi: 10.33584/jnzg.2016.78.516
- Moot DJ, Brown HE, Teixeira EI, Pollock KM. 2003. Crop growth and development affect seasonal priorities for lucerne management. In: Moot DJ, editor. Legumes for dryland pastures. Proceedings of a New Zealand Grassland Association Inc Symposium held at Lincoln University; Nov 18–19. Christchurch: New Zealand Grassland Association; p. 201–208.
- Moot DJ, Scott WR, Roy AM, Nicholls AC. 2000. Base temperature and thermal time requirements for germination and emergence of temperate pasture species. New Zealand Journal of Agricultural Research. 43:15–25. doi: 10.1080/00288233.2000.9513404
- Moot DJ, Smith M. 2011. Practical lucerne management guide. http://www.lincoln.ac.nz/PageFiles/23598/Lucerne-management-guide-Col.pdf.
- Morris NJ. 2011. Productivity, botanical composition and insect population of seven dryland pasture species in Canterbury after eight years [M.Ag.Sci. thesis]. Lincoln University, Lincoln. 93 pp. https://hdl.handle.net/10182/3436.
- Nichol WW. 2007. Nutritional disorders of ruminants caused by the consumption of pasture and fodder crops. In: Rattray PV, Brookes IM, Nichol AM, editors. Pasture and supplements for grazing animals. Christchurch: New Zealand Society of Animal Production; p. 133–149.
- NIWA. 2019a. El Niño and La Niña. NIWA. [updated: not specified; accessed 2019 Feb 21]. https://www.niwa.co.nz/climate/information-and-resources/elnino.
- NIWA. 2019b. Water balance. NIWA. [updated: not specified; accessed 2019 Jan 16]. https://cliflo.niwa.co.nz/pls/niwp/wh.do_help?id=ls_ra_wb.
- O’Connor KF. 1967. Lucerne-grass associations under different sowing and defoliation systems. In: Langer RHM, editor. The lucerne crop. Wellington: A.H. & A.W. Reed; p. 163–176.
- Purves RG, Wynn-Williams RB. 1989. Lucerne – a fresh look. Proceedings Agronomy Society of New Zealand. 19:95–102.
- Rattray PV, Jagusch KT, Duganzich DM, MacLean KS, Lynch RJ. 1982. Influence of feeding post-lambing on ewe and lamb performance at grazing. Proceedings of the New Zealand Society of Animal Production. 42:179–182.
- Rutter SM. 2006. Diet preference for grass and legumes in free-ranging domestic sheep and cattle: current theory and future application. Applied Animal Behaviour Science. 97:17–35. doi: 10.1016/j.applanim.2005.11.016
- Salinger J. 2003. Climate reality – actual and expected. In: Moot DJ, editor. Legumes for dryland pastures. Proceedings of a Symposium held at Lincoln University, Nov 18–19. Grassland research and practice series no 11. Wellington: New Zealand Grassland Association; p. 13–18.
- Sanderson MA, Skinner RH, Barker DJ, Edwards GR, Tracey BF, Wedin D. 2004. Plant species diversity and management of temperate forage and grazing land ecosystems. Crop Science. 44:1132–1144. doi: 10.2135/cropsci2004.1132
- Ta HT. 2018. Growth and development of lucerne with different fall dormancy ratings [Ph.D. thesis]. Lincoln University, Lincoln. 160 pp. https://hdl.handle.net/10182/10332.
- Vartha EW. 1967. Lucerne overdrilled with grasses for grazing. In: Langer RHM, editor. The lucerne crop. Wellington: A.H. & A.W. Reed; p. 177–185.
- Wang Y, Douglas GB, Waghorn GC, Barry TN, Foote AG, Purchas RW. 2009. Effect of condensed tannins upon the performance of lambs grazing Lotus corniculatus and lucerne (Medicago sativa). The Journal of Agricultural Science. 126:87–98. doi: 10.1017/S0021859600088833
- Webby RW, Bywater AC. 2007. Chapter 12, Principles of feed planning and management. In: Rattray PV, Brookes IM, Nichol AM, editors. Pasture and supplements for grazing animals. Christchurch: New Zealand Society of Animal Production; p. 189–220.
Appendix
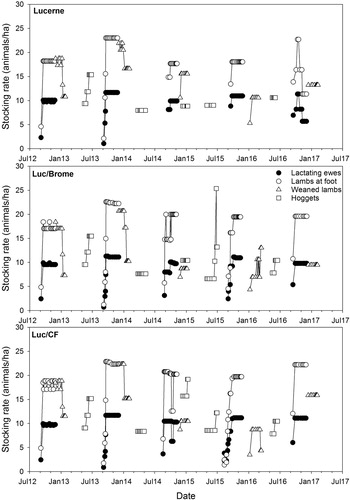
Figure A1. Stocking rate (hd/ha) of ewes, lambs at foot, weaned lambs and hoggets grazing dryland Luc (top), Luc/Brome (middle) or Luc/CF pastures (bottom) during LWt ‘production’ periods over five years at Ashley Dene, Canterbury.