
 ?Mathematical formulae have been encoded as MathML and are displayed in this HTML version using MathJax in order to improve their display. Uncheck the box to turn MathJax off. This feature requires Javascript. Click on a formula to zoom.
ABSTRACT
Autumn grazing of high-yielding forage crops such as fodder beet (FB) has increased in popularity in many regions of New Zealand. During grazing, large amounts of urinary nitrogen (N) is returned to the soil which is at risk of leaching. This study evaluated using two different catch crops of oats or Italian ryegrass (‘Italian RG’) to reduce the risk of N leaching both after FB grazing by lactating dairy cows and after lifting (i.e. un-grazed FB) in autumn. During FB grazing, cows grazed either (i) high [40% of diet dry matter (DM), with pasture; FB40] or (ii) low (25% of diet DM, with pasture; FB25) FB allocations. Both Italian RG and oats reduced soil mineral N (0–90 cm depth) by 16%–37% by August, and 53%–58% by October, compared with a fallow control (115 and 100 kg N ha−1 for August and October, respectively). The greatest reductions in soil mineral N were from oats, largely attributed to higher DM yields resulting in greater N uptake. Furthermore, the total amounts of soil mineral N in the soil after grazing differed between FB allocation treatments and lifted FB (FB25 > FB40 > lifted FB), in proportion to urinary-N inputs and associated dietary N intake.
Introduction
Urinary nitrogen (N) excreted by grazing livestock is a significant environmental pollutant in grazed pastoral systems of New Zealand (NZ). This is because the amount of N deposited in urine patches usually exceeds plant N demands, and therefore excess nitrate-N (–N) can be readily leached from the plant-soil system, contributing to the contamination of underlying waterbodies (Di and Cameron Citation2002; Monaghan et al. Citation2013; Selbie et al. Citation2015). Moreover,
–N leaching losses from autumn/winter-grazed forage crop systems can pose an even greater source of leachable-N due to the large amounts of urine-N deposited onto soil from cows grazing the crop at relatively high stocking densities, coupled with the area being left fallow until the summer crop is established (up to five months post-grazing). During this period evaporation rates are typically low and drainage potentially large, resulting in a situation where the risk of N leaching is high (Beare et al. Citation2010; Malcolm et al. Citation2015a; Citation2016a).
Fodder beet (FB; Beta vulgaris L. ssp. vulgaris var. alba) is a high-yielding, high-energy forage crop that has been used extensively in NZ, particularly in the South Island, as a winter feed for large non-lactating ruminant livestock; however, its use in the diet of lactating cows is relatively recent (Edwards et al. Citation2014; Gibbs Citation2014; Gibbs et al. Citation2015). The use of FB as an alternative to maize silage for late lactation dairy cattle is because of its high concentration of readily fermentable carbohydrate and low N content in the bulbs (de Ruiter et al. Citation2018; Dalley et al. Citation2019). In the recent study of Dalley et al. (Citation2019), replacing maize with FB (at 25% of the diet) in late lactating dairy cows on a pasture-based diet improved milk solids production, but the authors also observed that to reduce N excreted, higher allocations of FB in the diet (40%) were required, which negated any production gains due to associated adverse animal health effects (e.g. subclinical rumen acidosis).
Because late lactation feeding of FB in autumn results in the deposition of urine patches just prior to the main leaching period (winter) when soil temperatures are still conducive to nitrification (Di et al. Citation2009), this likely presents an even greater risk to N leaching losses than during winter grazing, because the urine-N is exposed to the full amount of winter rainfall/drainage. Farmers in NZ are coming under increasing regulatory pressure to reduce their environmental footprint, and therefore cost-effective mitigation technologies are required to relieve this pressure, such as those associated with autumn-grazed forage crops, and ultimately to improve environmental outcomes.
The establishment of forage catch crops (catch crops with an inherent feed value), sown directly after cash crops or winter-grazed forages, have been shown to be effective at reducing N leaching (Dabney et al. Citation2001; Thorup-Kristensen et al. Citation2003; Carey et al. Citation2016; Malcolm et al. Citation2018). Catch crops also offer other benefits, such as protection against weeds, pests and diseases, protection against soil erosion, contribution of N to subsequent crops, and generally increase soil quality by improving biological, chemical and physical properties (Dabney et al. Citation2001; Marcillo and Miguez Citation2017; Thapa et al. Citation2018). However, they have not been tested in terms of their ability to reduce the risk of N leaching losses after autumn-grazed forage crops such as FB. In the Waikato region, climatic conditions in early-mid autumn usually allow farmers to establish pasture (e.g. Italian ryegrass; Lolium multiflorum) after cropping, but in late autumn, this can be more challenging for plant establishment. Previous research has shown that fast growing root systems and high above-ground winter-activity are particularly important plant traits for improving plant N uptake and subsequently reducing N leaching losses (Thorup-Kristensen Citation2001; Malcolm et al. Citation2014; Citation2015b). Therefore, we hypothesised that a cereal catch crop like oats (Avena sativa) would be more effective than conventionally grown pasture crops like Italian ryegrass when sown after a grazed FB crop in late autumn.
This study tested two different catch crop systems (oats and Italian ryegrass) for their ability to reduce the risk of N leaching from FB grazed by late lactation dairy cows in the Waikato region, NZ. This study was performed in conjunction with that reported in Dalley et al. (Citation2019), so that our analysis of soil and crop samples under the two FB allocation treatments (proportion of FB in the diet) could be used to validate the findings of Dalley et al. (Citation2019) in relation to N excretion and subsequent N loadings at grazing, compared with an ungrazed FB crop that was lifted and removed, i.e. simulating an off-paddock feeding situation.
Materials and methods
Site description and soil type
The trial was located at DairyNZ Scott Farm near Hamilton in the central Waikato, New Zealand (37°46′S, 175°22′E), on a Te Rapa humic silt loam, brown subsoil variant [a Humose Orthic Podzol Soil (NZ Soil Classification, Hewitt Citation2010) or Humic Haplothod (Soil Taxonomy, Soil Survey Staff Citation2014)]. This soil is well drained with moderate subsoil permeability and occurs in slightly elevated levees or channel bars positioned commonly over permeable sand or gravel (Singleton Citation1991; Lowe Citation2010). The average annual rainfall in the region is approximately 1100 mm (NIWA Citation2019a), and autumn, winter, spring and summer mean monthly temperatures range from 12°C–17°C, 9°C–10°C, 12°C–15°C and 17°C–19°C, respectively (NIWA Citation2019b).
On 14 September 2016, 30 soil samples to 30 cm depth were taken within the trial area and composited for general soil fertility testing. Results indicate that all basic nutrients, except for potassium (K) were within acceptable ranges for crop production (). Daily climate data (rainfall, air temperature and solar radiation) were collected from the nearest NIWA weather station (37° 46.54′ S, 175° 18.30′ E).
Table 1. The initial soil fertility status fodder beet trial site prior to basal fertiliser applications [adopted from Dalley et al. (Citation2019)].
Pre-trial crop, soil and animal management
In spring 2016, three 0.36 ha (50 m × 72 m) adjacent paddocks with similar management history were simultaneously prepared for FB production. The paddocks were previously in chicory/plantain (2011–2013), then sown in annual ryegrass in spring 2013, oversown with plantain in November 2013, and with annual ryegrass in autumn 2014. In spring of 2015, the contiguous paddocks were sprayed out and sown in either maize, Sudan × Sudan grass (Pioneer® Brand) or rape.
A detailed description of the FB crop and grazing management are given in Dalley et al. (Citation2019), who reports on animal production and urine N excretion during the autumn grazing period at the same experimental site. Briefly, in early November 2016 following cultivation and basal fertiliser applications of lime, muriate of potash (MOP, 50% K) and Summit® AGSalt, ‘Vermon’ FB seeds were sown using a precision planter at 90,000 seeds ha−1. Nortron® herbicide at 2 L ha−1 (a.i. Ethofumesate 500 g L−1) and Attack® insecticide at 150 ml ha−1 (a.i. 475 g L−1 Pirimiphos and 25 g L−1 Permethrin) were applied at planting. A post-emergence chemical spray regime was then adopted to control weed and pest infestation. Fertiliser N was applied on two separate occasions; once on 20 December 2016 at 100 kg N ha−1 as urea (SustaiN®) and again on 25 January 2017 at 53 kg N ha−1 as a foliar application (Nrich® Liquid Urea, 19%N).
In autumn 2017, before grazing commenced, and on a weekly basis during the grazing period, FB yield assessments were undertaken to ensure animals were allocated the correct amount of feed. Fodder beet yield at grazing averaged approximately 15 t DM ha−1, and grazing occurred between 2 March 2017 and 2 April 2017. Within each replicate FB paddock, two longitudinal strips (25 m wide) were separated by an electric wire to contain lactating dairy cows randomly assigned FB offered at either 25% (4 kg DM cow−1 day−1, with pasture at 11 kg DM cow−1 day−1; ‘FB25’) or 40% (6 kg DM cow−1 day−1, with pasture at 9 kg DM cow−1 day−1; ‘FB40’) of the diet. During the main animal measurement period (27 March 2017–2 April 2017) of the trial (Dalley et al. Citation2019), the FB25 and FB40 treatment groups were allowed to strip-graze their FB plots for approximately 3 (1100–1400) and 4 (1000–1400) hours each day, respectively. No FB was offered between the afternoon and morning milking. Each mob was also assigned to a randomly allocated longitudinal pasture plot within the same pasture paddock each day, by which 80% of the daily pasture allocation followed the afternoon milking, and 20% followed the morning milking. After the final grazing on 2 April 2017, all the FB plants in the ungrazed area of each plot were removed by hand (hereafter referred to as ‘lifted FB’), representing approximately 44% and 40% of the area in the FB25 and FB40 plots, respectively ().
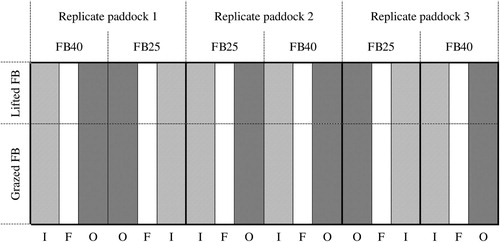
Figure 1. A schematic of the layout of the fodder beet (FB)-catch crop paddock trial at the DairyNZ Scott Farm, Hamilton in 2017. ‘Grazed’ represents FB consumed by livestock in autumn, and ‘lifted’ is FB harvested and removed in autumn by manual labour, i.e. no livestock grazing. FB allocation treatments consisted of either 25% of the diet dry matter (DM) (4 kg DM cow−1 day−1, with pasture at 11 kg DM cow−1 day−1; ‘FB25’) or 40% of the diet DM (6 kg DM cow−1 day−1, with pasture at 9 kg DM cow−1 day−1; ‘FB40’). Oats (O, grey shading) and Italian ryegrass (I, diagonal line shading) catch crops were direct-drilled on 3 May 2017, after all FB plants had been removed. ‘F’ represents the fallow control (unshaded).
Experimental set up and management
On 25 April 2017, after all FB had been removed, emerging weeds within the general trial area were controlled using Glyphosate 510 at a rate equivalent to 2 L ha−1, plus Nail®EC at 100 ml ha−1. Then on 3 May 2017, each of the FB25 and FB40 plots were divided and direct-drilled with either ‘Asset’ Italian ryegrass with AR37 endophyte (24 kg seed ha−1; ‘Italian RG’) or ‘Milton’ oats (124 kg seed ha−1; targeting 300 plants m−2) catch crops by random selection, leaving an approximate 2-m fallow strip between each catch crop (; ). The entire length of each subplot was sown, which meant that both ‘grazed’ and ‘lifted’ zones within each subplot were included. The treatments were allocated as a Strip-plot design with grazed/lifted treatments applied in strips across rows in the replicate paddocks. The Allocation treatment was applied down the paddock columns in strips, with each of these further partitioned into three vertical strips relating to each of the catch crop treatments (refer to ).
Table 2. Treatment structure of the catch crop trial at the DairyNZ Scott Farm, Hamilton in 2017. ‘Grazed’ represents fodder beet (FB) consumed by livestock in autumn, and ‘lifted’ is FB harvested and removed in autumn, i.e. no livestock grazing. Fodder beet allocation treatments consisted of either 25% of the diet dry matter (DM) (4 kg DM cow−1 day−1, with pasture at 11 kg DM cow−1 day−1; ‘FB25’) or 40% of the diet DM (6 kg DM cow−1 day−1, with pasture at 9 kg DM cow−1 day−1; ‘FB40’). Oats and Italian ryegrass (Italian RG) catch crops were direct-drilled on 3 May 2017, after all FB plants had been removed.
The catch crops were managed as per normal on-farm practice. This comprised of the Italian RG plots being rotationally grazed by dairy cows at regular intervals throughout the trial (first grazing occurred on 20 July 2017 at the 2.5-leaf stage), while the oats treatment remained ungrazed until machine-harvested at approximately 50% ear emergence (hereafter referred to as ‘green-chop silage maturity’) on 16 October 2017. A single application of Glyphosate 510 was made to the fallow strips on 21 June 2017, to maintain a weed-free status.
The entire trial area received 4 t ha−1 of lime on 21 October 2017, plus a basal dressing of 150 kg ha−1 of diammonium phosphate (DAP, NPK 18:20:0) and 250 kg ha−1 of MOP on 26 October 2017. ‘Asset’ Italian ryegrass with AR37 endophyte was direct-drilled into the oats plots on 2 November 2017 at a rate equivalent to 24 kg seed ha−1. Both the autumn-sown and spring-sown ryegrass was sprayed with Valdo 800WG (active ingredient: 800 g kg−1 flumetsulam) at 65 g ha−1 with 0.5 L UptakeTM oil per 100 L tank water plus 4 L ha−1 Thistrol® Plus (active ingredient: 375 g L−1 MCPB and 25 g L−1 MCPA) on 21 November 2017. The ryegrass following oats and the autumn-sown ryegrass systems were compared for timing and quantity of feed supply over 11 months. This accounted for the lag in feed production after the oat catch crop was harvested and before the new Italian ryegrass pasture was established and in the feed rotation. The spring–sown plots were rotationally grazed by dairy cows on a monthly basis (initial grazing on 19 December 2017), until approximately the end of February 2018, when it was considered that any lag in feed production associated with establishing Italian ryegrass after the oats was fully accounted. Rotational grazing on the Italian RG plots also continued through until the end of February 2018.
Measurements
Biomass production and nitrogen uptake
Monthly biomass cuts of each catch crop treatment were taken from June 2017 until the end of the trial in late February 2018. These data were used to follow N uptake (until 12 October only) and crop growth patterns of both catch crop systems, and understand the temporal processes related to environmental (e.g. N leaching risk) and productivity outcomes. The yield and N uptake measurements were taken from plot areas that were previously grazed during animal urine monitoring (approximately 20 m in length), as reported in Dalley et al. (Citation2019). A separate set of crop measurements were taken from within the ‘lifted’ areas of each plot. Catch crop cuts were performed on 21 June, 19 July, 17 August, 14 September, 12 October (final oat sampling at green-chop silage maturity), 15 November (Italian RG only) and 14 December in 2017, and on 17 January and 28 February 2018, and were often aligned with when Italian RG plots were due to be grazed (i.e. pre-grazing). At each sampling occasion, all above-ground biomass material within two randomly placed 0.5 m2 quadrats of each plot were removed at ground level. Both crop samples were combined to give a total sample area of 1 m2, and total fresh weight determined. A subsample of approximately 500 g was oven-dried at 65°C for approx. 48 hours to determine percentage DM, then finely ground and analysed for total N content using a LECO CNS analyser (LECO Corporation, St Joseph, MI, USA). The product of the DM yield and N concentration in tissue gave the total herbage N uptake on an area basis for each sampling occasion.
Post-grazing residuals were determined 1–2 days after Italian RG plots were grazed, in both catch crop systems, i.e. including Italian RG that followed the oats. This involved cutting all biomass at ground level within a 0.5 m2 quadrat in each plot, and analysing the samples for DM and N content as per that of the oats and pre-grazing samples described above. These data were then used to calculate the amount of DM and N consumed by the grazing livestock, and to consider the cumulative amount of DM grown in each system at each harvest/grazing event, as well as the total amount of N taken up in above-ground biomass by the crops.
Soil mineral nitrogen
An intensive soil sampling regime was used to assess the influence of above-ground production and N uptake by the catch crops on soil mineral N, as a proxy for potential N leaching risk. This was conducted within the 20 m strip of each plot where animal measurements occurred, as described above for the biomass measurements. Samples from the ‘lifted FB’ areas were also obtained. Due to the high degree of spatial variability associated with urine deposition during grazing, a urine patch spatial distribution model was used as a guide for the number of soil cores required within each ‘grazed’ plot, to provide a high level of confidence that our sampling regime accounted for a representative number of urine patches at any given time (Lilburne et al. Citation2012). For further information and a full description of this modelling exercise, see Supplementary Material Section I.
Soil samplings were carried out on a bimonthly basis after an initial post-grazing sampling on 18 April 2017 (before catch crop sowing). At this initial sampling, fallow plots had not yet been established, and therefore only the two catch crop plots (pre-sowing) within each of the FB25 and FB40 plots were sampled. Subsequent soil samplings occurred on 20 June, 17 August and 13 October 2017. Within each of the ‘grazed’ plots, samplings involved obtaining soil cores at 0–30, 30–60 and 60–90 cm depths every 1 m along a 20 m transect and bulking by soil depth to give three complete stratified soil samples per plot. Each of the three samples was thoroughly mixed and subsampled (approximately 1 kg of fresh soil) in the field. In the ‘lifted FB’ areas, the same procedure was used, but only five cores were taken in each plot (one core every 6 m). Soil samples were then passed through a 4-mm sieve, and a well-mixed subsample of 5 g of sieved soil extracted with 2M potassium chloride (KCl) at a 1:5 soil-to-solution ratio for soil mineral N analysis (–N and
–N). The filtered extract was analysed for
–N and
–N on a Lachat QuikChem 8500 Series 2 Flow Injection Analysis System (Lachat Instruments, Loveland, CO, USE; Keeney and Nelson Citation1982). Bulk density information for the given soil type was drawn from Singleton (Citation1991) and used to calculate the amount of
–N and
–N (kg/ha) within each measured soil layer. Soil moisture content of the samples was measured by weighing fresh subsamples and then reweighing following drying at 105°C for approximately 16 h or until a constant weight was achieved.
Statistical analysis
The statistical analysis was conducted in SAS 9.4 using the GLIMMIX procedure. Harvest, catch crop, grazed and allocation level nested within grazed main effects and interactions were treated as fixed effects with a normal distribution and identity link function specified. To account for the complex design, paddock, paddock by allocation, paddock by grazed, and paddock by allocation by catch crop were included as random effects. An autoregressive, AR(1) covariance structure was included to model the repeated measurements over time. Residual plots were investigated to confirm that the model assumptions of normality and constant variance were met, with a log transformation required for several dependent variables. Type 3 tests with Kenward-Roger degrees of freedom were used to assess evidence of an effect due to the various main and interaction treatments. Least-squares means were calculated together with their respective confidence interval and where appropriate back-transformed onto the original scale.
Results
Rainfall and air temperature
A total of approximately 1600 mm of rain fell during the months of March 2017 to January 2018, 567 mm more than the long-term mean (1981–2010) for the same period (A). Conditions were consequently particularly wet during March and April 2017, and January 2018, with between 230 and 275 mm of rainfall recorded in each month (approximately 3-fold higher than long-term means; A). Rainfall during other months was similar to long-term trends, except in June and November 2017 where rainfall was approximately 62 and 48 mm less than the long term average, respectively (A). The amount of drainage was estimated using a water balance simulation (see Supplementary Material Section II), which indicated a total of approximately 450 mm of accumulated drainage had occurred between catch crop sowing (May) and the end of October. Thereafter, only a minimal amount of drainage was estimated to have occurred, i.e. between November 2017 and January 2018.
Figure 2. Climate data at the DairyNZ Scott Farm fodder beet-catch crop grazing trial for the period 1 March 2017 to 30 January 2018. A, Daily, cumulative and cumulative 30-year district normal rainfall; B, daily average air temperature and 30-year district normal temperature.
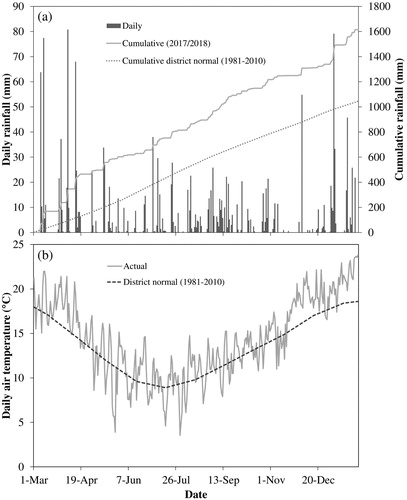
Daily mean air temperatures were similar to long term district averages during the months of May to October 2017 (B), but were 1.2°C–2.9°C warmer during March, April, November and December 2017, and January 2018.
Catch crop yield and nitrogen uptake
The cumulative amounts of catch crop feed grown after FB removal is presented in . There were no significant interactions between catch crop type and FB diet allocation (data not shown). However, there were significant main effects of both catch crop type (oats versus Italian ryegrass, P < 0.001) and FB diet allocation (FB25 vs FB40, P < 0.05) on catch crop dry matter production. By 21 June 2017, although yields overall were relatively low, there was evidence that oats established faster than Italian RG with more than double (P < 0.05) the amount of DM recorded (A). Thereafter, oats consistently produced significantly (P < 0.05) greater amounts of DM than Italian RG at each harvest (by up to almost 4-fold). At final sampling of the oats (12 October 2017; green-chop silage maturity), oats yielded 9.5 t DM ha−1 in the grazed FB treatments (average of FB40 and FB25 treatments), 7 t DM ha−1 more than Italian RG. There was no significant difference between the grazed and lifted FB treatments in the yields obtained for either oats or Italian RG (data not shown). In the oats treatment, there was a lag in feed produced between final harvest in early October and the establishment of the following Italian ryegrass (approximately mid-December); however, the total amount of feed grown within the oats treatment (after ‘grazed’ FB) remained significantly (P < 0.05) higher than the Italian RG treatment, with 16.9 and 10.5 t DM ha−1 grown by the end of February 2018, respectively. The differences in the cumulative biomass of catch crops under the two FB diet allocation treatments at the initial four harvests were minimal, but were consistently higher in FB25 (by approximately 2.8 t DM ha−1) than FB40 plots between October 2017 and February 2018 (average of oats and Italian RG treatments) (B). There was no significant difference in main treatment effects of catch crop yield between lifted FB and the two FB allocation treatments.
Figure 3. Amount of cumulative feed grown (t DM ha−1) of A, Italian ryegrass (‘Italian RG’) or oats catch crops (both crops sown 5 May 2017) after ‘grazed’ fodder beet (FB) by lactating dairy cows in autumn 2017 (FB allocation treatments averaged), and B, catch crop feed grown within the ‘grazed’ FB allocation herd treatments [whereby mobs of animals were allocated FB at either 25% of the diet dry matter (DM) (4 kg DM cow−1 day−1, with pasture at 11 kg DM cow−1 day−1; ‘FB25’) or 40% of the diet DM (6 kg DM cow−1 day−1, with pasture at 9 kg DM cow−1 day−1; ‘FB40’)], as well as ungrazed areas of the plots where FB was lifted and removed, i.e. no grazing took place (‘lifted FB’) (average of oats and Italian RG treatments) at the FB-catch crop paddock trial at DairyNZ’s Scott Farm, Hamilton (n = 6 for ‘Grazed’ FB treatments, and n = 12 for ‘lifted’ FB treatments). After oats were harvested at green-chop silage maturity (12 October 2017), oat plots were sown with Italian RG (‘Oats, then Italian RG’), therefore all feed produced post 12 October 2017 was Italian ryegrass pasture. LSR represents the least significant ratio at the 5% level, i.e. if the value of the ratio of the larger mean to the smaller is greater than the LSR calculation, the means should be considered statistically significantly different.
![Figure 3. Amount of cumulative feed grown (t DM ha−1) of A, Italian ryegrass (‘Italian RG’) or oats catch crops (both crops sown 5 May 2017) after ‘grazed’ fodder beet (FB) by lactating dairy cows in autumn 2017 (FB allocation treatments averaged), and B, catch crop feed grown within the ‘grazed’ FB allocation herd treatments [whereby mobs of animals were allocated FB at either 25% of the diet dry matter (DM) (4 kg DM cow−1 day−1, with pasture at 11 kg DM cow−1 day−1; ‘FB25’) or 40% of the diet DM (6 kg DM cow−1 day−1, with pasture at 9 kg DM cow−1 day−1; ‘FB40’)], as well as ungrazed areas of the plots where FB was lifted and removed, i.e. no grazing took place (‘lifted FB’) (average of oats and Italian RG treatments) at the FB-catch crop paddock trial at DairyNZ’s Scott Farm, Hamilton (n = 6 for ‘Grazed’ FB treatments, and n = 12 for ‘lifted’ FB treatments). After oats were harvested at green-chop silage maturity (12 October 2017), oat plots were sown with Italian RG (‘Oats, then Italian RG’), therefore all feed produced post 12 October 2017 was Italian ryegrass pasture. LSR represents the least significant ratio at the 5% level, i.e. if the value of the ratio of the larger mean to the smaller is greater than the LSR calculation, the means should be considered statistically significantly different.](/cms/asset/dacbfe53-b7c2-4e07-be31-c723fee07db6/tnza_a_1704422_f0003_ob.jpg)
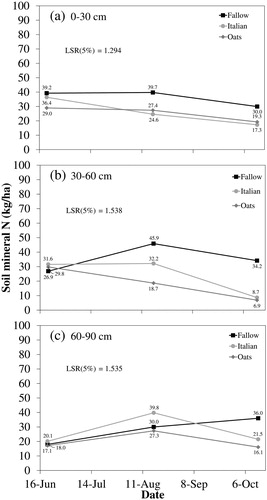
The cumulative amounts of N uptake by the catch crop treatments are given in . There was a highly significant (P < 0.001) main effect of catch crop type on N uptake. Both oats and Italian RG catch crops were effective at removing mineral N (i.e. N at risk of leaching) during the winter-early spring period (A). Overall, oats removed significantly (P < 0.05) greater amounts of N than Italian RG on all sampling occasions. By 12 October 2017 (green-chop silage of oats), oats had removed 88 kg N ha−1, significantly (P < 0.05) more N than Italian RG (54 kg N ha−1), when FB40 and FB25 treatments were averaged. Approximately 50% of N removed by the two catch crop species occurred during winter months, with the remaining 50% being taken up during late August, September and early October. Cumulative N uptake by catch crops in the FB25 treatment was twice as much as the FB40 treatment in mid-September (P < 0.05), and 63% higher (P < 0.05) by the October harvest (B). Nitrogen uptake by catch crops in the ‘lifted FB’ treatments did not differ significantly from those of the grazed FB treatments.
Figure 4. Amount of cumulative nitrogen (N) uptake (kg ha−1) by A, Italian ryegrass (‘Italian RG’) or oats catch crops (both crops sown 5 May 2017) after ‘grazed’ fodder beet (FB) by lactating dairy cows in autumn 2017 (FB allocation treatments averaged), and B, catch crop N uptake within the ‘grazed’ FB allocation herd treatments [whereby mobs of animals were allocated FB at either 25% of the diet dry matter (DM) (4 kg DM cow−1 day−1, with pasture at 11 kg DM cow−1 day−1; ‘FB25’) or 40% of the diet DM (6 kg DM cow−1 day−1, with pasture at 9 kg DM cow−1 day−1; ‘FB40’)], as well as ungrazed areas of the plots where FB was lifted and removed, i.e. no grazing took place (‘lifted FB’) (average of oats and Italian RG treatments), at the FB-catch crop paddock trial at DairyNZ’s Scott Farm, Hamilton (n = 6 for FB25 and FB40 treatments, and n = 12 for ‘lifted FB’ treatments). Nitrogen assessments were made up until 12 October 2017 only. LSR represents the least significant ratio at the 5% level, i.e. if the value of the ratio of the larger mean to the smaller is greater than the LSR calculation, the means should be considered statistically significantly different.
![Figure 4. Amount of cumulative nitrogen (N) uptake (kg ha−1) by A, Italian ryegrass (‘Italian RG’) or oats catch crops (both crops sown 5 May 2017) after ‘grazed’ fodder beet (FB) by lactating dairy cows in autumn 2017 (FB allocation treatments averaged), and B, catch crop N uptake within the ‘grazed’ FB allocation herd treatments [whereby mobs of animals were allocated FB at either 25% of the diet dry matter (DM) (4 kg DM cow−1 day−1, with pasture at 11 kg DM cow−1 day−1; ‘FB25’) or 40% of the diet DM (6 kg DM cow−1 day−1, with pasture at 9 kg DM cow−1 day−1; ‘FB40’)], as well as ungrazed areas of the plots where FB was lifted and removed, i.e. no grazing took place (‘lifted FB’) (average of oats and Italian RG treatments), at the FB-catch crop paddock trial at DairyNZ’s Scott Farm, Hamilton (n = 6 for FB25 and FB40 treatments, and n = 12 for ‘lifted FB’ treatments). Nitrogen assessments were made up until 12 October 2017 only. LSR represents the least significant ratio at the 5% level, i.e. if the value of the ratio of the larger mean to the smaller is greater than the LSR calculation, the means should be considered statistically significantly different.](/cms/asset/f221f194-b337-465c-9d7f-50e182c53609/tnza_a_1704422_f0004_ob.jpg)
Soil mineral nitrogen
The amount of soil mineral N (–N and
–N) in three depth layers during the winter-spring period of the catch crop and fallow treatments are presented in . There was a highly significant (P < 0.001) main treatment effect of catch crop (fallow control included) at each of the measured soil depths. At the initial post-sowing sampling on 20 June 2017, oats had significantly (P < 0.05) reduced soil mineral N within the 0–30 cm depth by 26% compared with the fallow control (A), but no differences were observed at lower depths. On 17 August and 13 October 2017, both oats and Italian RG had significantly reduced soil mineral N in the top 30 cm by 31%–42%, attributed to N uptake by the respective crops as described above. At the 30–60 cm depth, both catch crops reduced soil mineral N stocks by 30%–80% compared with the fallow control (34–46 kg N ha−1) plots at the August and October samplings, and were notably lower in the oats treatment (19 kg N ha−1) than Italian RG (32 kg N ha−1) in August, owing to the greater N uptake of oats compared with Italian RG during winter. Within the 60–90 cm depth, differences were only observed at the final sampling in October, whereby catch crops reduced soil mineral N by 55% for oats (reduction of 20 kg N ha−1) and 40% for Italian RG (15 kg N ha−1) compared with the fallow control. Within the deeper layers of the soil (30–60 and 60–90 cm depths), there was an increase in the amount of N in the fallow treatment, indicating N was leaching down the soil profile.
Figure 5. Soil mineral nitrogen (N; kg ha−1) under Italian ryegrass (‘Italian’) or oats catch crops (both crops sown 5 May 2017) compared with a fallow control at A, 0–30, B, 30–60 and C, 60–90 cm depths post fodder beet (FB) grazing, at the FB-catch crop paddock trial at DairyNZ’s Scott Farm, Hamilton in 2017 (n = 6). LSR represents the least significant ratio at the 5% level, i.e. if the value of the ratio of the larger mean to the smaller is greater than the LSR calculation, the means should be considered statistically significantly different.
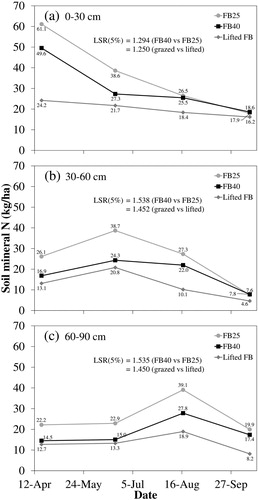
shows the amounts of soil profile mineral N under the catch crop and fallow plots (combined) within the prior FB feeding treatment areas (FB25, FB40 and lifted FB). There were significant main treatment effects of FB diet allocation (FB25 vs FB40) on soil mineral N in grazed FB plots at all measured depths; 0–30 cm (P < 0.05), 30–60 cm (P < 0.001) and 60–90 cm (P = 0.0012). In addition, there was a highly significant (P < 0.001) main treatment effect of grazed vs lifted FB on soil mineral N at each of the measured depths. For instance, in the 0–30 cm depth layer the amounts of soil mineral N in the FB40 and FB25 treatments in mid-April were up to 153% higher (by 25 and 37 kg N ha−1, respectively) than those of the lifted FB treatments, with a mean of 24 kg N ha−1. In addition, there was approximately 12 kg N ha−1 (23%) more soil mineral N in the FB25 treatment than the FB40 treatment (P < 0.05). In subsequent samplings, the amounts of mineral N in this top layer of soil declined to between 18 and 39 kg N ha−1 in the FB25 and FB40 treatments, while in the lifted FB treatments levels remained relatively steady. In the 30–60 cm (B) and 60–90 cm (C) depths, changes over time followed a similar trend for all treatments, with marginal increases in June, before returning to relatively low levels in October (5–8 kg N ha−1). At the 30–60 cm depth, there were consistently higher (59%–86%; P < 0.05) amounts of N in the FB25 treatment compared with FB40 and lifted FB in June, and marginally higher amounts of N in general in the FB25 treatment within the 60–90 cm depth compared with FB40 and lifted FB treatments. In August and October, both FB40 and FB25 treatments had significantly (P < 0.05) higher amounts of soil mineral N in the 60–90 cm depth compared with lifted FB.
Figure 6. Soil mineral nitrogen (N; kg ha−1) at A, 0–30, B, 30–60 and C, 60–90 cm depths post fodder beet (FB) grazing, at the FB-catch crop paddock trial at DairyNZ’s Scott Farm, Hamilton in 2017. Treatments represent those imposed at the time of grazing, whereby mobs of animals were allocated FB at either 25% of the diet dry matter (DM) (4 kg DM cow−1 day−1, with pasture at 11 kg DM cow−1 day−1; ‘FB25’) or 40% of the diet DM (6 kg DM cow−1 day−1, with pasture at 9 kg DM cow−1 day−1; ‘FB40’), as well as ungrazed areas of the plots where FB was lifted and removed, i.e. no grazing took place (‘lifted FB’). Data represents the mean of oats, Italian RG and fallow treatments. At the initial sampling (April) fallow plots were not yet established, and therefore n = 6; thereafter n = 9 at each sampling occasion for the ‘FB25’ and ‘FB40’ treatments. For the ‘lifted FB’ treatments, n = 12 at the initial sampling (April); thereafter n = 18 at each sampling occasion. LSR represents the least significant ratio at the 5% level, i.e. if the value of the ratio of the larger mean to the smaller is greater than the LSR calculation, the means should be considered statistically significantly different.
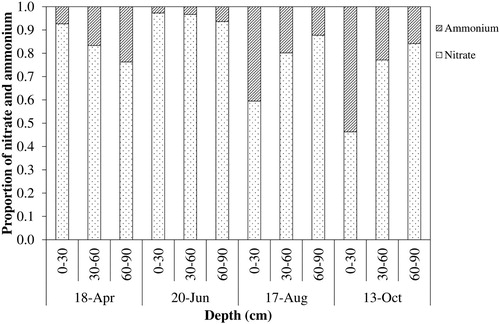
The proportions of –N and
–N in the various layers of soil from April to October are given in . Between 46% and 97% of soil N at any given time was
–N. The proportion of
–N increased markedly after the June sampling, particularly in the 0–30 cm layer of the soil (e.g. from 3% in June to 41% and 54% in August and October, respectively).
Figure 7. Proportion of nitrate-nitrogen (–N) ammonium-nitrogen (
–N) of nested catch crop and fodder beet (FB) feeding strategy treatments at each sampling occasion within the 0–30, 30–60 and 60–90 cm depths, at the FB-catch crop paddock trial at DairyNZ’s Scott Farm, Hamilton in 2017. At the initial sampling (April) fallow plots were not yet established, and therefore n = 24; thereafter n = 36 at each sampling occasion.
Discussion
Effect of catch crops on the risk of N leaching
Sowing oats or Italian RG in early May, directly after autumn-grazed (or lifted/un-grazed) FB in the Waikato region resulted in plant uptake of up to 88 kg ha−1 of mineral N from the soil by October, that would have otherwise been at risk of leaching, causing significant reductions in soil mineral N compared with the fallow control at each of the measured depths (0–30, 0–60 and 60–90 cm). Other studies have also reported the benefits of minimising fallow periods and establishing catch crops to remove leachable mineral N from the soil profile (Dabney et al. Citation2001; Thorup-Kristensen et al. Citation2003; Carey et al. Citation2016; Teixeira et al. Citation2016; Malcolm et al. Citation2016b; Thapa et al. Citation2018). For example, Carey et al. (Citation2016) showed that sowing oats in winter, after simulated winter forage crop grazing, could reduce N leaching losses by up to 49% compared with fallow soil, which they attributed to N uptake by the catch crop and reduced drainage volume as a consequence of higher rates of evapotranspiration. Similarly, Malcolm et al. (Citation2016b) showed that winter-sown oats reduced deep soil N (15–120 cm depth) in simulated urine patches after a kale crop by up to 84% at green-chop silage maturity in late November. Our study considers the performance of late-autumn sown catch crops. This is later than the timing for conventional cover crop sowing (e.g. after summer turnips or maize silage in early autumn), but earlier than post-winter grazing scenarios (late winter or early spring establishment). The general principles for winter crop establishment in this study are the same as traditional systems but allowance will be required for mechanical operations on the land if soil is too wet.
Of the two catch crop systems tested, oats performed best, both in terms of N removed by the crop and reduced soil mineral N. For example, between sowing in early May and August sampling (representing the coolest time period and most likely to generate high N leaching losses), oats removed 50 kg N ha−1, 47% more N than Italian RG. By green-chop silage maturity in October, the oats removed nearly twice as much N as Italian RG, driven by greater biomass accumulation during the winter-spring period () and a seemingly greater level of tolerance to the cool and particularly wet weather conditions (). The results are supportive of Carey et al. (Citation2017), who showed in a monolith lysimeter study that oats sown under simulated winter conditions reduced N leaching losses in urine patches by 25% over the critical winter-spring drainage period compared with Italian RG. Similarly, following late-summer ploughed pasture McLenaghen et al. (Citation1996) showed that a winter ryecorn catch crop took up 53% more N than Italian ryegrass (111 kg N ha−1), while both catch crops significantly reduced N leaching losses compared to fallow soil. The poorer performance of Italian RG in terms of growth and N uptake in the current study may be partly attributed to regular grazings, resulting in a lag in plant growth, slowing N uptake rates until the canopy recovers and maximum solar radiation is captured. In addition, urine deposited during grazings adds N back to the soil which may offset some of the environmental gains. Oats can accumulate large quantities of biomass during winter-spring months until green-chop silage maturity (9.5 t DM ha−1 on average in the current study) without compromising feed quality (e.g. metabolisable energy), and therefore the crop does not require early grazing, meaning maximum light interception and N uptake can be achieved. Grazing Italian RG is a common practice for managing farm covers and feed quality during these months, and therefore represented a valid system comparison to the option of growing oats for green-chop silage.
Although the oat catch crop produced significantly greater biomass by mid-October than Italian RG, harvesting oats at that time of year can result in an immediate loss of production while the subsequent spring-sown crop establishes, at a time when feed supply is crucial for maintaining high milk production. Our study showed the lag in production during establishment of the Italian RG post-harvest of the oats was more than compensated for by oat crop yield. For instance, biomass accumulation of Italian RG, sown in early November after the oats were harvested, reached 6.4 t DM ha−1 by late February, 1.3 t DM ha−1 less than that produced by the earlier established Italian RG treatment over the same time period; but overall, the entire oats-Italian RG rotation produced 6.5 t ha−1 more DM than the Italian RG treatment by late February when the trial ceased. This implies that oat catch crops can offer both improved environmental outcomes and potentially favourable production benefits for farmers.
Although we did not directly measure N leaching losses, the results for plant N uptake and soil mineral N, alongside the large amounts of drainge that were estimated to have occurred, provided strong evidence for reduced N leaching under both catch crop systems compared with fallow soil. For instance, in the fallow treatment there were obvious increases over time in the amounts of soil mineral N at the deeper layers of the soil (e.g. 30–60 and 60–90 cm depths). In both the oats and Italian RG treatments there were notable net reductions in soil mineral N (B and C). Importantly, in an ever-increasing regulatory environment, this practice has potential to improve environmental outcomes in these farm systems, by helping to retain nutrient (namely N) within the agroecosystem, and preventing N losses to receiving water bodies, which can cause deterioration in water quality (Wild and Cameron Citation1980; Addiscott Citation1996).
Oats catch crops have the potential to fit well into maize silage, maize grain and FB production systems for both improved environmental and production outcomes. Waikato is a major maize growing region, and typically land after maize silage is sown back into pasture (e.g. in early- to mid-autumn) (Fletcher et al. Citation2011). However, oats could be used in place of pasture to improve the efficiency of N use in these systems. A study by Chakwizira et al. (Citation2017) showed that on average across two sets of experiments in each of two regions of New Zealand (Waikato and Canterbury), maize sequences using oats (31 t DM ha−1) added 4 t DM ha−1 more feed compared with a standard maize-RG sequence. In addition, due to earlier sowing capabilities in maize silage rotations, oats are likely to mature earlier than those sown later in the current study, and therefore might result in higher yields, as well as allowing the next crop to be established earlier. Oat catch crops might also offer benefits to maize grain rotations, whereby sowings would be more aligned to those in our study, i.e. late autumn. There are potential difficulties with establishing crops directly after maize grain due to the high quantities of trash that is left behind at harvest, and therefore further work is required to test this possibility.
Effect of fodder beet feeding on the risk of N leaching
This catch crop trial was run in conjunction with the study of Dalley et al. (Citation2019), which looked at FB feeding strategies on animal performance and environmental risk indicators (namely N concentration in urine). The results showed that post-grazing soil mineral N (April) within the profile (0–90 cm depth) was approximately 29 kg N ha−1 higher under FB25 treatments (109 kg N ha−1) compared with FB40 (81 kg N ha−1), and both FB25 and FB40 were higher than under lifted FB (50 kg N ha−1). This was attributed to urine N inputs, with higher N concentration in the urine of the FB25 treatment cows due to a higher amount of dietary crude protein [as shown by Dalley et al. (Citation2019)], and a theoretically higher urine patch coverage, given animals in the FB25 treatment were offered less FB (i.e. smaller area of crop). Using mean urine N concentration data reported in Dalley et al. (Citation2019), our crude estimations of the amount of urine N excreted from both the FB25 and FB40 allocation treatments were 72 and 52 kg N ha−1, respectively. In these estimations we assumed three and four urine patches were deposited per cow per day on the FB crop area from the FB25 and FB40 treatments, respectively, noting that the FB40 herd treatment spent 1-hour longer grazing FB than FB25. Quantitatively, these estimates are fairly well aligned to what we measured in the soil profile (0–90 cm depth) of the FB25 and FB40 treatments after discounting background soil N, i.e. mineral N in lifted FB. In addition, the difference in soil mineral N between the two allocation treatments of 29 kg N ha−1 is attributed to the extra amount of N excreted per unit area from the FB25 cows compared with the FB40 cows. These calculations do not consider potential differences between treatments in terms of gaseous losses of N, i.e. N2O, N2, NH3. Importantly, these data validate the findings by Dalley et al. (Citation2019) that higher allocations of FB in the diet resulted in reduced urine N returns to the soil, and essentially the amount of N at risk of leaching.
The lower amounts of soil mineral N in the lifted FB plots compared with grazed plots were attributed to the complete removal of N contained in the FB crop, and therefore no urine N returns. It is possible that this might also be partly related to animal treading/compaction, which compresses soil pores and creates soil conditions that are more conducive to higher gaseous losses of N2O and/or N2 through denitrification (Beare et al. Citation2009; Harrison-Kirk et al. Citation2015; Thomas et al. Citation2019). In terms of DM production and N uptake, FB25 treatments were consistently higher than those of FB40 (B), likely due to the greater amounts of N in the soil after grazing in the FB25 treatment than the FB40 treatment. This suggests that even though there is a higher risk of N leaching at lower allocation of FB in the diet, catch crops can counteract this risk to some degree by taking up more N.
Although it appears that higher allocations of FB can reduce the risk of N leaching losses, Dalley et al. (Citation2019) reported that the FB40 allocation treatment came at a cost to (i) animal performance, such as reduced milk solids production, and (ii) animal health (e.g. subclinical rumen acidosis), and therefore recommends that significant care is required at these higher proportions of FB in the diet. Lifting and removing FB from the land and feeding it on stand-off pads is a viable option to further reduce potential N leaching losses, but this comes at a high capital and operating cost. Detailed cost–benefit analyses are required to determine the long-term profitability and sustainability implications of this option.
Conclusions
This study highlighted that both catch crop systems were effective at reducing the risk of N leaching losses, with the biggest observed benefits achieved with oats, in terms of reduced risk of N leaching and greater biomass production. By August, oats had reduced soil profile (0–90 cm depth) mineral N by 37%, and Italian RG by 16%, compared with fallow. At green-chop silage maturity in October, oats produced on average 9.5 t DM ha−1, 7 t DM ha−1 more than the Italian RG. Additionally, although there was a lag in feed production following establishment of Italian RG after oats were harvested, by late February (11 months after the grazing of the FB) the oats-Italian rotation produced 61% more feed than the Italian RG treatment. Our results also indicate a higher proportion of FB in the diet of late lactation dairy cows, i.e. FB40 cf. FB25, can reduce the amount of N returned to the soil during grazing, due to lower dietary N intake, ultimately reducing the risk of N leaching losses. Although the significant reductions in urinary N excretion for the higher FB allocation (FB40) treatment validates the findings by Dalley et al. (Citation2019), they come at a potential cost to milk solids production and animal health (Dalley et al. Citation2019). In addition, our post-grazing soil sampling showed that the risk of N leaching losses can be further reduced by lifting and feeding the crop on a feed pad or an off-paddock facility, i.e. by not grazing in-situ.
Supplemental Material
Download MS Word (286.6 KB)Acknowledgements
Research was completed as part of the Forages for Reduced Nitrate Leaching programme with principal funding from the New Zealand Ministry of Business, Innovation and Employment and co-funding from research partners DairyNZ, AgResearch, Plant & Food Research, Lincoln University, Foundation for Arable Research and Manaaki Whenua – Landcare Research. The authors also acknowledge the significant technical assistance by Jian Liu, Isabelle Sorensen, Rebekah Tregurtha, Kathryn Lehto (Plant & Food Research), and Jason Phillips, Johannes Nagel, Ben Fisher, Kate Watkins, Caleb Higham, Amelia Griffin, Laura Rossi, Emma Masterson and others from the DairyNZ science support team.
Disclosure statement
No potential conflict of interest was reported by the authors.
ORCID
Brendon J. Malcolm http://orcid.org/0000-0002-2028-4579
John M. de Ruiter http://orcid.org/0000-0001-6995-058X
Dawn E. Dalley http://orcid.org/0000-0003-3707-2051
Sam Carrick http://orcid.org/0000-0002-3295-4197
References
- Addiscott TM. 1996. Fertilizers and nitrate leaching. In: Hester RE, Harrison RM, editors. Agricultural chemicals and the environment: issues in environmental science technology. Cambridge: Royal Society of Chemistry; p. 1–26.
- Beare M, Gregorich E, St-Georges P. 2009. Compaction effects on CO2 and N2O production during drying and rewetting of soil. Soil Biology and Biochemistry. 41(3):611–621.
- Beare MH, Tabley F, Gillespie R, Maley S, Harrison-Kirk T, de Ruiter J. 2010. Nitrate leaching from high production forage crop sequences. Proceedings of the New Zealand Grassland Association. 72:23–28.
- Blakemore LC, Daly BK, Searle PL. 1987. Methods for chemical analysis of soils. New Zealand Soil Bureau, Department of Scientific and Industrial Research 80.
- Carey P, Cameron K, Di H, Edwards G. 2017. Comparison of nitrate leaching from oats and Italian ryegrass catch crops following simulated winter forage grazing: a field lysimeter study. New Zealand Journal of Agricultural Research. 60(3):298–318.
- Carey PL, Cameron KC, Di HJ, Edwards GR, Chapman DF. 2016. Sowing a winter catch crop can reduce nitrate leaching losses from winter-applied urine under simulated forage grazing: a lysimeter study. Soil Use and Management. 32(3):329–337.
- Chakwizira E, Fletcher AL, Johnstone PR, de Ruiter JM, Pearson AJ, Parker M. 2017. Maize silage-winter crop sequences that maximise forage production and quality. New Zealand Journal of Agricultural Research. 62(1):1–22.
- Dabney SM, Delgado JA, Reeves DW. 2001. Using winter cover crops to improve soil and water quality. Communications in Soil Science and Plant Analysis. 32:1221–1250.
- Dalley DE, Waugh D, Griffin A, Higham C, de Ruiter JM, Malcolm BJ. 2019. A comparison of fodder beet and maize silage as supplements to pasture in late lactation to increase milk production and reduce urinary nitrogen excretion. New Zealand Journal of Agricultural Research. https://doi.org/10.1080/00288233.2019.1675717
- de Ruiter JM, Malcolm BJ, Chakwizira E, Johnstone PR, Maley S, Arnold NP, Dalley DE. 2018. Crop management effects on supplementary feed quality and crop options for dairy feeding to reduce nitrate leaching. New Zealand Journal of Agricultural Research. https://doi.org/10.1080/00288233.2018.1508042
- Di HJ, Cameron KC. 2002. Nitrate leaching in temperate agroecosystems: sources, factors and mitigating strategies. Nutrient Cycling in Agroecosystems. 64(3):237–256.
- Di HJ, Cameron KC, Shen JP, Winefield CS, O'Callaghan M, Bowatte S, He JZ. 2009. Nitrification driven by bacteria and not archaea in nitrogen-rich grassland soils. Nature Geoscience. 2(9):621–624.
- Edwards GR, de Ruiter JM, Dalley DE, Pinxterhuis JB, Cameron KC, Bryant RH, Malcolm BJ, Chapman DF. 2014. Dry matter intake and body condition score change of dairy cows grazing fodder beet, kale and kale-oat forage systems in winter. Proceedings of the New Zealand Grassland Association. 76:81–87.
- Fletcher AL, Brown HE, Johnstone PR, de Ruiter JM, Zyskowski RF. 2011. Making sense of yield trade-offs in a crop sequence: a New Zealand case study. Field Crops Research. 124(2):149–156.
- Gibbs J. 2014. Fodder beet in the New Zealand dairy industry. Proceedings of the South Island Dairy Event. Invercargill New Zealand, 23–25 June 2014. [accessed 2015 Feb 19]. http://side.org.nz/wp-content/uploads/2014/05/4.3-Fodder-Beet-GIBBS.pdf.
- Gibbs J, Saldias B, Trotter C. 2015. Feeding fodder beat in lactation and to replacement heifers. Proceedings of the South Island Dairy Event. Lincoln, New Zealand, 22–24 June 2015. [accessed 2019 April 18] https://side.org.nz/wp-content/uploads/2015/10/4.6-Feeding-fodder-beat-in-lactation.pdf.
- Harrison-Kirk T, Thomas SM, Clough TJ, Beare MH, van der Weerden TJ, Meenken ED. 2015. Compaction influences N2O and N2 emissions from 15N-labeled synthetic urine in wet soils during successive saturation/drainage cycles. Soil Biology and Biochemistry. 88:178–188.
- Hewitt AE. 2010. New Zealand soil classification. 3rd ed. Landcare Research. Lincoln, NZ: Manaaki Whenua Press.
- Keeney D, Nelson DW. 1982. Nitrogen—inorganic forms. In: Page A, Miller R, Keeney D, editors. Methods of soil analysis, part 2. Chemical and microbiological properties. 2nd ed. Madison, Wisconsin: American Society of Agronomy and Soil Science Society of America; p. 643–698.
- Lilburne L, Carrick S, Webb T, Moir J. 2012. Computer-based evaluation of methods to sample nitrate leached from grazed pasture. Soil Use and Management. 28(1):19–26.
- Lowe DJ. 2010. Introduction to the landscapes and soils of the Hamilton Basin. In: Lowe DJ, Neall VE, Hedley M, Clothier B, Mackay A, editors. Guidebook for pre-conference North Island, New Zealand “Volcanoes to Oceans” field tour (27–30 July). 19th World Soils Congress, International Union of Soil Sciences, Brisbane. Soil and Earth Sciences Occasional Publication No. 3, Massey University, Palmerston North, pp. 1.24–1.61.
- Malcolm BJ, Cameron KC, Edwards GR, Di HJ. 2015a. Nitrogen leaching losses from lysimeters containing winter kale: the effects of urinary N rate and DCD application. New Zealand Journal of Agricultural Research. 58(1):13–25.
- Malcolm B, Cameron K, Edwards G, Di H, de Ruiter J, Dalley D. 2016a. Nitrate leaching losses from lysimeters simulating winter grazing of fodder beet by dairy cows. New Zealand Journal of Agricultural Research. 59(2):194–203.
- Malcolm BJ, Cameron KC, Edwards GR, Di HJ, Moir J. 2014. The effect of four different pasture species compositions on nitrate leaching losses under high N loading. Soil Use and Management. 30(1):58–68.
- Malcolm B, Carey P, Teixeira E, Johnstone P, Maley S, de Ruiter J. 2018. Potential of catch crops to reduce nitrogen leaching in New Zealand winter grazing systems. Journal of New Zealand Grasslands. 80:207–214.
- Malcolm BJ, Moir JL, Cameron KC, Di HJ, Edwards GR. 2015b. Influence of plant growth and root architecture of Italian ryegrass (Lolium multiflorum) and tall fescue (Festuca arundinacea) on N recovery during winter. Grass and Forage Science. 70(4):600–610.
- Malcolm B, Teixeira E, Johnstone P, Maley S, de Ruiter J, Chakwizira E. 2016b. Catch crops after winter grazing for production and environmental benefits. Agronomy New Zealand. 46:99–108.
- Marcillo G, Miguez F. 2017. Corn yield response to winter cover crops: an updated meta-analysis. Journal of Soil and Water Conservation. 72:226–239.
- McLenaghen RD, Cameron KC, Lampkin NH, Daly ML, Deo B. 1996. Nitrate leaching from ploughed pasture and the effectiveness of winter catch crops in reducing leaching losses. New Zealand Journal of Agricultural Research. 39(3):413–420.
- Monaghan RM, Smith LC, de Klein CAM. 2013. The effectiveness of the nitrification inhibitor dicyandiamide (DCD) in reducing nitrate leaching and nitrous oxide emissions from a grazed winter forage crop in southern New Zealand. Agriculture Ecosystems & Environment. 175:29–38.
- NIWA. 2019a. Mean monthly rainfall. [accessed 2019 Feb 19] https://www.niwa.co.nz/education-and-training/schools/resources/climate/meanrain.
- NIWA. 2019b. Mean monthly temperatures. [accessed 2019 March 12] https://www.niwa.co.nz/education-and-training/schools/resources/climate/meanairtemp.
- Olsen SR, Cole CV, Watanabe FS, Dean LA. 1954. Estimation of available phosphorus in soils by extraction with sodium bicarbonate. pp. 19. Washington, DC: USDA, Circular Nr 939, US Gov. Print Office. 19 p.
- Rayment GE, Higginson FR. 1992. Australian laboratory handbook of soil and water chemical methods. Melbourne, Australia: Inkata Press. xvii+ 330 p.
- Selbie DR, Buckthought LE, Shepherd MA. 2015. The challenge of the urine patch for managing nitrogen in grazed pasture systems. Advances in Agronomy. 129:229–292.
- Singleton PL. 1991. Soils of Ruakura – a window on the Waikato. NZ DSIR Land Resources Scientific Report 5. 127 pp. + map 1:5000.
- Soil Survey Staff. 2014. Keys to soil taxonomy. 12th ed. Washington, DC: United States Department of Agriculture.
- Sparling G, Searle P. 1993. Dimethyl sulphoxide reduction as a sensitive indicator of microbial activity in soil: the relationship with microbial biomass and mineralization of nitrogen and sulphur. Soil Biology and Biochemistry. 25(2):251–256.
- Teixeira E, Johnstone P, Chakwizira E, de Ruiter J, Malcolm B, Shaw N, Zyskowski R, Khaembah E, Sharp J, Meenken E, et al. 2016. Sources of variability in the effectiveness of winter cover crops for mitigating N leaching. Agriculture, Ecosystems and Environment. 220:226–235.
- Thapa R, Mirsky SB, Tully KL. 2018. Cover crops reduce nitrate leaching in agroecosystems: a global meta-analysis. Journal of Environmental Quality. 47(6):1400–1411.
- Thomas SM, Fraser PM, Hu W, Clough TJ, van der Klei G, Wilson S, Tregurtha R, Baird D. 2019. Tillage, compaction and wetting effects on NO3, N2O and N2 losses. Soil Research. 57(6):670–688.
- Thorup-Kristensen K. 2001. Are differences in root growth of nitrogen catch crops important for their ability to reduce soil nitrate-N content, and how can this be measured? Plant and Soil. 230:185–195.
- Thorup-Kristensen K, Magid J, Jensen LS. 2003. Catch crops and green manures as biological tools in nitrogen management in temperate zones. Advances in Agronomy. 79:227–302.
- Watkinson JH, Kear MJ. 1994. High performance ion chromatography measurement of sulfate in 20 mM phosphate extracts of soil. Communications in Soil Science and Plant Analysis. 25(7/8):1015–1033.
- Wild A, Cameron KC. 1980. Soil nitrogen and nitrate leaching. In: Tinker PB, editor. Soils and Agriculture. Oxford, UK: Blackwell Scientific Publications; p. 35–70.