
ABSTRACT
To meet the water quality outcomes sought by catchment communities and regulators, the losses of nitrogen (N), phosphorus (P) and sediment from dairy and sheep/beef farms must be reduced across many catchments. We conducted a high-level desktop analysis of farm typologies and established that if mitigation actions were fully implemented across dairy and sheep/beef farms, losses of N and P could have been decreased by up to 16 and 23%, respectively, compared to the estimated losses for 2015 (where established actions were only partially implemented). Potential decreases were greater for dairy land (34% N and 26% P) because of its greater per hectare yield and number of mitigation actions available before land use change is required. If established and developing mitigation actions were fully implemented by 2035, potential N, P and sediment losses may decrease by up to 34, 39 and 66%, respectively, compared to actual 2015 losses. These results can inform investment and planning by the rural sector as part of an assessment of the potential for on-farm actions to mitigate losses from existing land use.
Introduction
The loss of contaminants, such as nitrogen (N), phosphorus (P) and sediment, from agricultural land use contributes to the pressure on freshwater quality and integrated measures of stream biological health (e.g. macroinvertebrate communities) (Parliamentary Commissioner for the Environment Citation2015). This pressure is likely to increase with the need to produce more food (Steinfield et al. Citation2006; Legg et al. Citation2016), but may also decrease if the contaminants lost can be mitigated (Doody et al. Citation2012) or ‘offset’ by habitat improvements. There is a wide variety of actions aimed at mitigating contaminant losses to water. Many have a long history and are well established, having been tested over a range of conditions, and include stock exclusion, wintering off paddock, dairy effluent management, and fertiliser management. Other mitigation actions have been developed over a few years (commonly ≤ 3) and validated at a handful of locations, and include various edge-of-field mitigations, in-stream sorbents, controlled drainage, management of critical source areas, and retention dams and bunds (McDowell et al. Citation2018).
Research has shown that landowners must have confidence in the effectiveness of mitigation actions before they will be readily implemented. Furthermore, many land owners must also act in collaboration to collectively achieve decreases in losses at a catchment scale (Payne and White Citation2006; Bewsell et al. Citation2007). As a result, catchment-, regional- or national-scale studies dealing with the ability to reduce contaminant losses usually assess established actions, while assessments of developing actions tend to be limited to the few farms or locations where they have initially been explored. To address national policy issues around water quality and land use we need to be able to assess the efficacy, and aggregated water quality benefits at different scales, of both established and developing contaminant mitigation actions across different climate, soil and landscape-types.
In New Zealand, recent national policy aims to set water quality objectives for N, P and sediment (Ministry for the Environment Citation2020). Although minimum standards (bottom lines) are set nationally, objectives desired by local communities are set regionally for catchments. For catchments identified as over-allocated in nutrients, required changes in land use practices (i.e. mitigation actions) need to be implemented on-farm to reduce nutrient losses. Given the diversity of landforms and climate, land use and practices vary considerably, resulting in a wide range of contaminant loss profiles. For instance, although dairy farms are generally considered to have higher yields of nutrient loss relative to other land use types, a summary of yields determined from catchments from c.1975 to 2007 found that P losses for dairy farms could be both greater and lesser than drystock farms (McDowell and Wilcock Citation2008). The guidance given to land owners to support them in choosing appropriate mitigation actions has been to consider how they work over a range of diverse landforms, climates, land uses and practices (McDowell et al. Citation2018). However, modelling every permutation is computationally difficult and constrained by access to data. Instead, attention has turned to grouping this diversity into classes, hereafter called ‘typologies’ that can be assigned a representative contaminant loss rate (viz yield; e.g. kg N ha−1 yr−1). Modelling the distribution and mitigation of contaminant losses from these typologies can inform questions about land use management to meet water quality policy (Andersen et al. Citation2007).
The aim of this study was to estimate the maximum load (kg) of contaminants that could be mitigated from current pastoral land uses if current (i.e. established) mitigation actions had been implemented, where suitable, by 2015. However, research in Australasia found that, from inception, the average time to peak adoption of a new land use practice (or in this case a mitigation action) is about 15–20 years (Botha et al. Citation2015; Kuehne et al. Citation2017). Furthermore, some catchments can exhibit lengthy lag-times between implementing a strategy and seeing a water quality outcome (Meals et al. Citation2010). Therefore, we also chose to determine the maximum load of contaminants that could be mitigated if all developing actions were implemented by 2035. We wish to inform landowners and policy makers about the magnitude of reductions that may be possible with the current type and distribution of catchment land use. Our analysis extends the consideration of mitigation that has been achieved prior to 2015 and reported in the companion paper by (Monaghan et al. Citation2020b). This paper is a desktop, national scale analysis that makes many assumptions. These assumptions and the limitations of the data and results are discussed in detail.
Materials and methods
Approach
Monaghan et al. (Citation2020a) presented an approach to estimate the likely losses of N, P, and sediment in 1995 and 2015 from representative farm types (called typologies). The following sections describe briefly the approach to assigning typologies and how we used these to estimate N and P losses. We refer to three scenarios:
‘2015 current’ as presented in Monaghan et al. (Citation2020b) referring to losses after the partial (i.e. current) adoption of a range of established mitigation actions had been considered.
‘2015 potential’ referring to losses estimated after the full (100%) implementation of established mitigation actions had occurred in 2015, and
‘2035 potential’ referring to losses estimated after the full (100%) implementation of established plus developing mitigation actions had occurred by 2035 ().
Table 1. Additional ‘developing’ mitigation actions included in modelling farm-scale reductions of nitrogen (N) and phosphorus (P) losses to water in 2015 and 2035. Further information on the assumptions relevant to each typology is given in Supplementary Table S3.
As there were few mitigation actions for sediment and due to the long lag time for these few actions to take effect, we only present the 2015 current and 2035 potential scenarios.
We assumed that land use was the same in 2015 and 2035. This also assumed that livestock numbers, genetic gain and farm systems were kept constant. We recognise that this may contribute to an underestimation of animal performance and hence overestimate potential losses.
Both dairy and sheep/beef pastoral land uses were classified into typologies that were distributed across the country. Limited information was available on attenuation processes that occur beyond a typology (e.g. aquifer denitrification) (Rivas et al. Citation2017) and hence this consideration was excluded from our analysis.
Categorisation of typologies for farm contaminant losses
Typologies were developed for dairy and sheep/beef farms. The development of the typologies, and the assumptions involved therein, is explained in detail in Monaghan et al. (Citation2020a). Typologies represented combinations of the major edaphic (e.g. soil type, slope, temperature and rainfall attributes) and management (e.g. irrigation and stocking intensity) factors that are known to control pastoral and arable productivity and N, P and sediment losses. Arable factors were included as one of the sheep/beef typologies had most of the arable land in New Zealand.
Briefly, we used expert opinion and previous sensitivity analyses of components of the Overseer® Nutrient Budgeting software (hereafter referred to as Overseer) version 6.3.1 (McDowell et al. Citation2015; AgResearch Citation2016) to develop a classification of attributes that influence contaminant losses to water. Dairy typologies (Supplementary Table S1), categorised farms into classes based on combinations of spatial databases of temperature, slope, soil wetness and drainage and real farm information (e.g. for stocking rates) contained within 431 Overseer files sourced from DairyBase for the 2014/15 production season (DairyNZ Citation2018). Sheep/beef farm typologies (Supplementary Table S2) combined spatial data for topography, slope and climate with farm classes used in the Beef and Lamb New Zealand (BLNZ) Economic Service Sheep/beef Farm Survey (Beef and Lamb New Zealand Citation2018).
Classifications were made of whole farm parcels if an attribute (e.g. soil type) represented >50% of total farm area. We recognise that this could cause error if a farm contains a diverse array of attributes; for example, a hill country farm with flat finishing land and steep hills that may be classed as a ‘hill country’ farm by BLNZ. Land use was extracted from AgriBase (Sanson Citation2005). The mean values and settings for farm inputs, management and production information for a typology was input into Overseer to generate a representative Overseer file for a typology. However, since soil Olsen P concentrations were not provided with Dairybase information, we used the mean regional soil Olsen P test concentrations calculated for 2015 by the fertiliser co-operative – Ballance Agri-Nutrients. Their database contained, for example, dairy farms for sedimentary soils (11,640 samples from 1416 farms), volcanic soils (2867 samples from 673 farms), pumice soils (1346 samples from 228 farms) and peat soils (763 samples from 161 farms).
After accounting for interactions there were potentially 96 dairy farm typologies, but only 61 of these supported dairy farming (Supplementary Table S1). As per the approach of Monaghan et al. (Citation2020a), we restricted our analysis to the 20 combinations that covered the greatest area (67% of land used for dairy farming in New Zealand). In contrast, the 17 sheep/beef typologies covered 89% of land used for drystock farming. Note that the mixed finishing typology in Marlborough/Canterbury (typology 17; Supplementary Table S2) contained about 66% of New Zealand’s arable cropping land.
Modelling the effectiveness of actions suitable for mitigating N, P and sediment losses
In a previous paper, Monaghan et al. (Citation2020b) examined established mitigation actions that had been partially adopted by the farming community in 2015. Their analysis did not include either full (100%) implementation of these established actions or several developing actions. Developing actions have been less widely accepted and implemented by the farming community because their cost and effectiveness have only been established in a handful of cases and national cost-effectiveness has yet to be established.
We contend that full implementation of established and developing actions (where applicable) will play an important role in mitigating contaminant losses to water from farms over the next two decades of New Zealand agriculture. The effectiveness of potential mitigation scenarios is made relative to the 2015 current state (i.e. 2015 current) baseline scenario of Monaghan et al. (Citation2020b). From this we calculate losses assuming 100% implementation of mitigation actions for 2015 (potential) and 2035 (potential). Whilst we recognise that these may be optimistic scenarios, model outputs do provide an indicative illustration of the potential for changes in land use practice (i.e. mitigation actions) to address the challenges of farming within environmental water quality limits.
We used five dairy and three sheep/beef groupings of established mitigation actions to reduce N and P losses in the ‘2015 potential’ scenario. These groupings are described in full in Monaghan et al. (Citation2020b) and briefly below. Established groupings of mitigation actions used for the 2015 potential scenario for dairy were: (1) Fencing out stock access to all rivers 4th order or above as per proposed Government policy (Ministry for Primary Industries Citation2017), which was expanded to 100% of permanent streams in the 2035 potential scenario; (2) Improved management of fertiliser to avoid over-applying nutrients; (3) improved irrigation water practices such as improved scheduling and variable rate irrigation (VRI) (McDowell Citation2017); (4) Scheduling applications of farm dairy effluent (FDE) for periods when soil is sufficiently dry to retain the applied liquid (Monaghan et al. Citation2010), or via low rate or VRI systems for irrigated typologies; and (5) Off-paddock grazing management which includes off-paddock wintering of dairy cattle via the use of barns and standoff pads (Christensen et al. Citation2012).
Established groupings of mitigation actions used for the 2015 potential scenario for sheep/beef farms were: (1) Fencing out stock as above, but with an allowance to periodically graze margins to keep weeds under control; (2) Improved fertiliser management as above; and (3) Land retirement from grazing as supported by several national programmes (Land Information New Zealand Citation2018; Ministry for Primary Industries Citation2018; Queen Elizabeth II National Trust Citation2019).
For the 2035 (potential) scenario we used a set of developing mitigations (, Supplementary Table S3). Although exhaustive, this list is not comprehensive, and some other strategies may be missing or be developed. For example, dairy cows grazing pastures rich in plantain have been shown to have low concentrations of urinary-N (Box et al. Citation2017). Developing actions were applied to the typologies where they were considered most relevant. These actions included: technologies to capture losses from the edge of the field (McDowell et al. Citation2007; Schipper et al. Citation2010); the application of chemical amendments to reduce the availability of N (Di and Cameron Citation2002; Di et al. Citation2009; Smith et al. Citation2012) or P; application of variable fertiliser rates to steeper land (White et al. Citation2017); limiting N imports in feed and fertiliser (Monaghan and De Klein Citation2014); the strategic sowing of P efficient pastures and delayed grazing of critical source areas (McDowell et al. Citation2014); and the use of retention dams / bunding and controlled drainage systems (Tan and Zhang Citation2011; Levine et al. Citation2017) to reduce overland and subsurface flow (respectively) from getting to the stream unattenuated.
The effectiveness of each of the groups of mitigation actions for N and P was assessed at the typology (viz. farm) scale and aggregated to yield a national-scale effectiveness by typology. Where possible, effectiveness was assessed by manipulating relevant management settings in the Overseer file for each of the constructed typology farms. Where Overseer functionality did not allow this, we assumed a standard effectiveness based on the mean efficacies in published studies as described in . After determining the suitability of an action to a typology, actions were bundled and applied in the order of most to least cost-effective according to the method of McDowell et al. (Citation2018). Bundling actions had the effect of buffering uncertainty in actions with few data with those that had more data. The mean effectiveness for actions were spatially weighted where single or multiple actions within a bundle only applied to part of a farm. For instance, the strategic grazing of cropland was assumed to only apply to 10% of the property that represented critical source areas; hence, the 65% reduction for P resulted in a spatial weighting for that action of 6.5% at the farm scale. The spatial coverage of developing strategies was applied at the rate recommended by their developers (see Supplementary Table S3 and typology-specific order and effectiveness in Tables S4–S7).
Estimates of sediment erosion in 2015 (current) were produced for each typology via the NZeem® model over a 15-m resolution (Dymond et al. Citation2010). The mitigation of erosion in New Zealand focuses on (1) reducing hillslope erosion (landslides, gullies, earthflows) using combinations of spaced-tree planting or land retirement as part of Whole Farm Plans (WFPs), and (2) reducing bank erosion by fencing out stock and riparian planting (Basher Citation2013). A fully implemented WFP was assumed to reduce erosion from hillslopes by 70% with space-planted trees (Douglas et al. Citation2013); riparian retirement was assumed to reduce bank erosion by 80% (Dymond et al. Citation2010, Citation2016). For the 2035 (potential) estimate, it was assumed that all remaining untreated erodible pastoral farmland, defined as Land Use Capability Class 6e, and 7e by Lynn et al. (Citation2009), was mitigated with implemented WFPs. The fencing-out of stock was assumed for all remaining permanent streams.
Mapping the effectiveness of actions relative to potential policy
Individual typologies were intersected with some 560,000 river catchments, as defined by the River Environment Classification (REC) (Snelder et al. Citation2005). Estimated total N (TN) and total P (TP) loads for each REC catchment, for the period 2013–2017, were extracted from Snelder et al. (Citation2018). These represented the catchment loads of TN and TP in the 2015 current scenario. Loads were intersected with the effective mitigation potential for typologies within the catchment according to the 2015 and 2035 (potential) scenarios. Where more than one typology intersected a catchment, an area-weighted average was generated. The area-weighted percentage reduction for the 2015 and 2035 potential scenarios were applied to these loads, resulting in catchment-specific, mitigated loads. We left nutrient losses for native or exotic forestry within a catchment unchanged as these land uses contributed less TN and TP to catchment loads than other land uses and therefore did not need to be mitigated (McDowell and Wilcock Citation2008; Baillie and Neary Citation2015). The mitigated load therefore only applied to the area of land in dairy or sheep/beef (plus 66% of arable land).
Results and discussion
Potential to mitigate N and P with established actions
The dairy and sheep/beef typologies covered approximately 1.48M of the 2.25 M ha of land under dairy and 8.26M of the 9.33 M ha under sheep/beef (Supplementary Tables S1 and S2) (Beef+Lamb New Zealand Economic Service Citation2018; Livestock Improvement Corporation Limited & DairyNZ Citation2019). The typologies, and the area covered by them, represent the best information set we have that describes pastoral land use pressures on water quality for landscapes that have contrasting soil and climate (vulnerability) attributes. Although no indication of representativeness, the area-weighted mean N yield for dairy (31 kg N ha−1 yr−1) and P yield for sheep/beef typologies (0.6 kg P ha−1 yr−1) in the 2015 potential scenarios () were similar to that measured from 54 New Zealand dairy and sheep/beef farmed catchments from the early 1970s to 2008 of 27 catchments (McDowell and Wilcock Citation2008). This suggests that the yield predicted were, at least, of a similar magnitude to those observed; more analysis of the accuracy of N and P yields for typologies is given in Monaghan et al. (Citation2020a)
Table 2. National estimates of nitrogen (N), phosphorus (P) and sediment loads and yields for sheep/beef, dairy and a national overall area-weighted mean for loads and yields under the current rate of implementation (2015 current) and if current and developing actions were fully implemented (2015 potential and 2035 potential). No estimate is given for the potential mitigation of sediment in 2015.
The effect of the full implementation of established mitigation actions (2015 potential) and developing mitigation actions (2035 potential) on N, P and sediment yields and loads for each typology are given in Supplementary Tables S8–S10. When modelled in Overseer, the efficacy of established mitigation actions often have interdependencies, for example, improved accounting and use of nutrients contained within FDE will reduce the need for fertiliser nutrient applications. Consequently, presenting the effect of a single action is hard to distinguish. Instead, we present the combined effect of established mitigation actions by typology as yields in and .
Figure 1. Estimated nitrogen (N), phosphorus (P) and sediment yields for selected dairy typologies in 2015 (2015 current) and after assuming full implementation of established mitigation actions in 2015 (2015 potential), or of developing mitigation actions in 2035 (2035 potential).
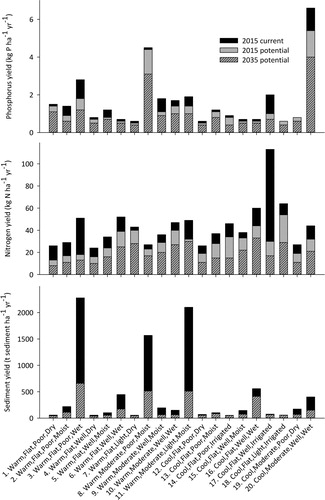
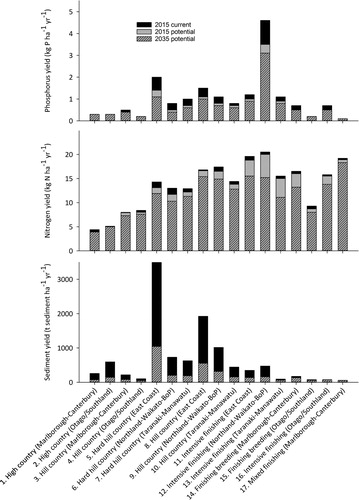
Figure 2. Estimated nitrogen (N), phosphorus (P) and sediment yields for each sheep/beef typology in 2015 (2015 current) and after assuming full implementation of established mitigation actions in 2015 (2015 potential), or of developing mitigation actions in 2035 (2035 potential).
Owing to the greater number (and effectiveness) of mitigation actions available and greater yields, more N and, to a lesser extent, P was mitigated from dairy than sheep/beef land uses ( and ). The efficacy of established actions used in the 2015 potential scenario is discussed in detail in Monaghan et al. (Citation2020b). Dairy typologies that exhibited the greatest decrease in N and P yields following the full implementation of established actions were often wet or irrigated (e.g. Typologies 3 and 17; ) where actions such as better scheduling of irrigation or FDE applications are considered to be most effective (Monaghan et al. Citation2009, Citation2010).
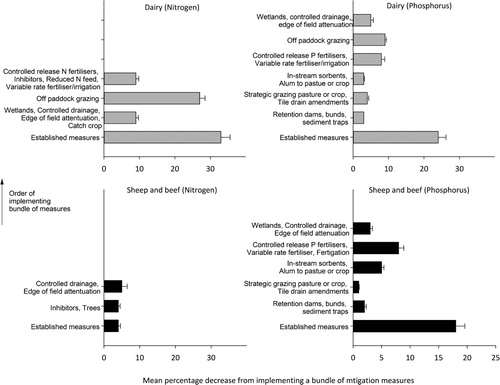
Figure 3. Mean (error bars are the standard error of the difference across all sector typology units) decreases in nitrogen (N) or phosphorus (P) yields predicted in 2035 for dairy and sheep/beef typologies associated with the full implementation of bundles of established and developing mitigation actions. Bundles are modelled in the order of least to most cost effective from the bottom to top as per McDowell et al. (Citation2018).
The typologies where reductions on sheep/beef was greatest were those associated with steep slopes where less effort has gone into fencing-off streams from stock (Typologies 5–10; ), or where there is potential to reduce soil Olsen P concentrations in finishing operations (e.g. Typology 12).
The key difference between the contaminant yields and loads for the 2015 current and potential scenarios is the rate of uptake of established actions. Defining the level of current uptake of mitigation actions involves considerable uncertainty as it often relies on self-reported statistics. For example, actions such as fencing out stock from streams were listed to be > 90% complete in most regions for many years (Ministry for Primary Industries Citation2013). However, subsequent auditing of these values put the rate of qualifying streams (i.e. those wider than 1 m and deeper than 30 cm) at 42% (Sanson and Baxter Citation2011). We used the best possible industry statistics of uptake via DairyBase to define the 2015 current scenario, and because the established actions do capture areas of the farm or practices that lose much N and P, there are considerable gains still to be made by fully adopting them (i.e. 2015 potential scenario).
Potential to mitigate N and P with established and developing actions
The area-weighted contaminant yields for the 2035 potential scenario for dairy (19 kg N ha−1 yr−1, 0.5 kg P ha−1 yr−1, 139 t sediment km−2 yr−1) and sheep /beef (10.4 kg N ha−1 yr−1, 0.5 kg P ha−1 yr−1, 222 t sediment km−2 yr−1) were less than those in the 2015 potential scenario (). We remind the reader that we assumed no land use change nor change in farm practices of the base farm typologies. Like the 2015 potential scenario, there were more mitigations and a greater potential to decrease contaminant yields from dairy compared to sheep/beef farmed land. The marked decrease in contaminant losses afforded by implementing developing actions indicates that considerable losses occur from areas not addressed by established actions and that we now have a better understanding of loss pathways and how losses can be mitigated. For instance, although it was known that most contaminant losses come from a minority of a farm’s area (termed critical source areas; CSAs) (Gburek et al. Citation2002), only recently has the technology been made available to identify CSAs and how they vary across the landscape (McDowell et al. Citation2015).
The efficacy of actions on sheep/beef land was also often different to that on dairy land (). For instance, on average, strategic grazing of cropland to avoid wet times of the year was more effective in reducing P yields from dairy land (4%) than from sheep/beef (2%). This might be due to the relatively large amount of crop areas and associated P loss (e.g. 10% of the farm that contributes 30–40% of the farm’s P loss) for dairy farms associated with the grazing of forage (cropland or pasture) through the wetter months (Monaghan et al. Citation2017), whereas sheep/beef farms carry fewer relative stock numbers over this period.
Geographically, areas with the greatest N and P loads (not yields) in the 2035 potential scenario from dairy land were concentrated in warm, flat, well drained areas with good rainfall in the North Island (e.g. Typology 5), or in cool, flat well-drained areas in the South Island (Typology 17) (Supplementary Table S8). For sheep/beef land use, high N, P and sediment loads were associated with steeper country on the east coast of the North Island (Typologies 5, 8 and 9), or for more intensively stocked areas of the South Island (Typology 14) (Supplementary Tables S9 and S10). Loads of N and P lost in 2035 from sheep/beef land accounted for 73 and 82% of losses across New Zealand, respectively (), because of a greater areal extent and greater relative gains in mitigating losses from dairy typologies (). For sediment, losses from sheep/beef land use accounted for 91% in the 2015 current scenario decreasing to 86% in the 2035 scenario.
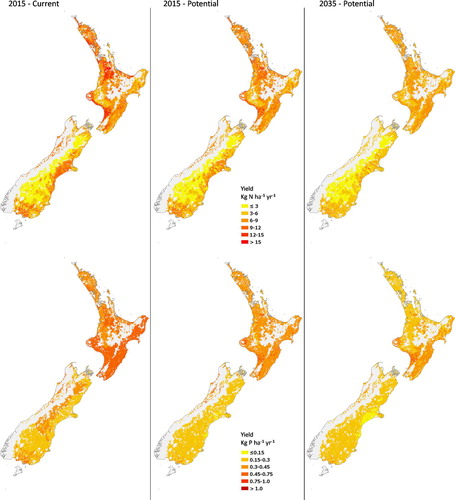
Following full implementation of established actions (i.e. 2015), loads of N and P decreased by up to 16 and 23%, respectively (). Upon implementing additional developing mitigation actions by 2035, the national loads of N and P (2035 potential scenario) from pastoral land were up to 34 and 39% less than the base load estimated for 2015 (; ).
Figure 4. Average current (2015) and potential catchment yield (2015 and 2035) (kg/ha/yr) of N (top) and P (bottom) after applying all farm-scale mitigation actions to farm typologies.
Limitations of the study
Our estimates of N, P and sediment yields and loads, and their mitigation, come with several caveats and assumptions that could restrict their accuracy and use under certain circumstances. These caveats can be categorised into uncertainty around the representativeness of typologies, the spatial and temporal resolution of inputs and model error.
The typologies represent a compromise of using the best available data on farm management and edaphic factors that control contaminant losses. We recognise that there are other factors that control losses such as anion storage capacity or the frequency of runoff events (for P) which were not able to be included (Morton et al. Citation2003; Sharpley et al. Citation2008). Nevertheless, for areas where we had observed data, Monaghan et al. (Citation2020a) showed that the predicted pattern of loss (i.e. coefficient of determination), if not always the magnitude of loss, was similar to that measured at a farm to small catchment scale. As a result, our analysis is intended to give a national picture of losses and should not be used to infer losses from a specific farm.
We also recognise that empirical models like Overseer (for N and P) or NZeem® (sediment) rely on adequate data to estimate losses and that catchment-scale processes which determine the final load of contaminants reaching the receiving environment were not accounted for. For example, attenuation processes within aquifers can substantially decrease N loads in some areas (Close et al. Citation2016; Rivas et al. Citation2017). The same magnitude of change is possible for the sorption of P from the water column (Weigelhofer et al. Citation2018) or through sediment deposition (Vale et al. Citation2016). To more accurately account for this, process-based models, able to represent scale specific attributes and processes (Dymond et al. Citation2016) may have helped, but too few data were available at the national scale to fully support this approach.
In addition to considering mitigations at the same spatial scale, it is known that the effects of mitigations decrease or take longer to become effective with greater distance from the point of implementation (Macintosh et al. Citation2018). This is caused by different rates of implementation across a catchment or catchment processes (Meals et al. Citation2010; Van Meter and Basu Citation2017). We assumed that farm-scale mitigations would eventually result in catchment scale decreases of a similar magnitude, and that catchment-scale attenuation processes remain unchanged. The 2035 scenario is considered to reflect a reasonable length of time for developing actions to be adopted and become effective at a catchment-scale considering that the average time to peak adoption of agricultural innovation in Australasia is around 16–20 years (Botha et al. Citation2015; Kuehne et al. Citation2017). However, it is also likely that some typologies would be subject to long lag-times, which will increase the time before changes in water quality following the adoption of mitigation actions are observed downstream. For instance, tortuous flow paths in the central plateau of the North Island can lead to lag times of 60–100 years between N being lost from the root zone and a significant proportion appearing in nearby streams (Morgenstern and Daughney Citation2012; Clague et al. Citation2019). This may mean that in these areas our estimates of effectiveness are optimistic.
Finally, it is likely that the effectiveness of some actions may not perform as expected in one region compared to another. This is more likely for developing mitigations that are not captured in mechanistic models like Overseer. This could mean that the effectiveness of actions is either over or underestimated. Past research using the mean of effectiveness has also employed upper and lower bounds representing standard errors (McDowell Citation2014). Although some of the developing actions have repeated trials from which standard errors could be calculated, many such as the strategic grazing of pastures of crops did not. Instead of excluding these actions we chose to include them within bundles of actions.
We also note that the efficacy of some mitigation actions may decline with time naturally or due to a changing climate. For example, most constructed wetlands will accumulate sediment and P though deposition. However, the rate of sediment and P accumulation decreases with time (Braskerud Citation2002; Vymazal Citation2018). In addition, once the wetland becomes anaerobic, it not only removes N via denitrification, reducing conditions lead to the dissolution of P associated with iron and manganese, causing the wetland to become a source, not sink, of dissolved P (Ann et al. Citation1999). Predictions of climate change are that the frequency of high intensity storms by 2050 are set to increase. We have not taken this effect into account, but it is likely to decrease the effectiveness of mitigating losses, especially of sediment (Lu et al. Citation2013).
These caveats mean that our estimates are only an approximation of relative losses and only pertain to the typologies shown. Although contaminant yields and loads cannot be referenced to specific farms, they can be used to identify, at a coarse spatial scale, where opportunities lie for further investigation into the modelling and mitigation of N, P and sediment losses at catchment and regional scales. Such studies are essential in predicting the likelihood of meeting water quality objectives, and therefore the efficacy of any proposed remedial actions.
Conclusions
If all current established mitigation actions had been implemented by 2015, the potential percentage decreases in national loads of N and P would have been 16 and 23%, respectively. A greater proportion of this could have been achieved from land under dairying (34% for N and 26% for P) because of its greater per hectare yield and the number of mitigation actions available. If all developing mitigation actions were implemented by 2035 the national load of N, P and sediment from pastoral land could be decreased from 2015 baseline (i.e. estimated current state) by 34, 39 and 66%, respectively. These data may inform investment and planning by the rural sector as part of an assessment of the potential for mitigation actions to meet catchment water quality objectives; or whether a change in land use or land intensity is required.
Supplemental Material
Download MS Word (109 KB)Acknowledgements
Components of this work were funded by DairyNZ (development of dairy typology and load framework, and DairyBase). We appreciate the help of Beef and Lamb for providing some of the data used to make the sheep/beef typologies.
Disclosure statement
No potential conflict of interest was reported by the authors.
Correction Statement
This article has been corrected with minor changes. These changes do not impact the academic content of the article.
Additional information
Funding
References
- AgResearch. 2016. OVERSEER® nutrient budgets. version 6.2.2. Hamilton, New Zealand: AgResearch – Fertiliser Association of New Zealand – Ministry for Primary Industries.
- Andersen E, Elbersen B, Godeschalk F, Verhoog D. 2007. Farm management indicators and farm typologies as a basis for assessments in a changing policy environment. J Environ Manage. 82(3):353–362.
- Ann Y, Reddy KR, Delfino JJ. 1999. Influence of redox potential on phosphorus solubility in chemically amended wetland organic soils. Ecological Engineering. 14(1–2):169–180.
- Baillie BR, Neary DG. 2015. Water quality in New Zealand’s planted forests: a review. New Zealand Journal of Forestry Science. 45(1):7.
- Basher LR. 2013. Erosion processes and their control in New Zealand. In: Dymond J, editor. Ecosystem services in New Zealand. Lincoln: Manaaki Whenua Press; p. 363–374.
- Beef+Lamb New Zealand Economic Service. 2018. Compendium of New Zealand Farm Facts. 32 p.
- Beef and Lamb New Zealand. 2018. Farm classes [accessed 2019 April 23]. https://beeflambnz.com/data-tools/farm-classes.
- Bewsell D, Monaghan RM, Kaine G. 2007. Adoption of stream fencing among dairy farmers in four New Zealand catchments. Environmental Management. 40(2):201–209.
- Botha N, Turner JA, Sinclair S, Brazendale R, Dirks S, Blackett P, Lambert G. 2015. Assessing the economic impact of a co-innovation approach: the case of dairy heifer rearing in New Zealand. ImpAR Conference 2015. Impacts of Agricultural Research – Towards an Approach of Societal; Pairs, France. p. 1–15.
- Box LA, Edwards GR, Bryant RH. 2017. Milk production and urinary nitrogen excretion of dairy cows grazing plantain in early and late lactation. New Zealand Journal of Agricultural Research. 60(4):470–482.
- Braskerud BC. 2002. Design considerations for increased sedimentation in small wetlands treating agricultural runoff. Water Science and Technology. 45(9):77–85.
- Christensen C, Hedley M, Hanly J, Horne D. 2012. Nitrogen loss mitigation using duration-controlled grazing: field observations compared to modelled outputs. Proceedings of the New Zealand Grassland Association. 74:115–119.
- Clague JC, Stenger R, Morgenstern U. 2019. The influence of unsaturated zone drainage status on denitrification and the redox succession in shallow groundwater. Science of the Total Environment. 660:1232–1244.
- Close ME, Abraham P, Humphries B, Lilburne L, Cuthill T, Wilson S. 2016. Predicting groundwater redox status on a regional scale using linear discriminant analysis. Journal of Contaminant Hydrology. 191(Supplement C):19–32.
- DairyNZ. 2018. DairyBase [accessed 2018 April 11]. https://www.dairynz.co.nz/business/dairybase/.
- de Klein CAM, Letica SA, Macfie PI. 2014. Evaluating the effects of dicyandiamide (DCD) on nitrogen cycling and dry matter production in a 3-year trial on a dairy pasture in South Otago, New Zealand. New Zealand Journal of Agricultural Research. 57(4):316–331.
- Di HJ, Cameron KC. 2002. The use of a nitrification inhibitor, dicyandiamide (DCD), to decrease nitrate leaching and nitrous oxide emissions in a simulated grazed and irrigated grassland. Soil Use and Management. 18(4):395–403.
- Di HJ, Cameron KC, Shen JP, Winefield CS, O’Callaghan M, Bowatte S, He JZ. 2009. Nitrification driven by bacteria and not archaea in nitrogen-rich grassland soils. Nature Geosci. 2(9):621–624.
- Doody DG, Archbold M, Foy RH, Flynn R. 2012. Approaches to the implementation of the Water Framework Directive: targeting mitigation measures at critical source areas of diffuse phosphorus in Irish catchments. Journal of Environmental Management. 93(1):225–234.
- Douglas GB, Mcivor IR, Manderson AK, Koolaard JP, Todd M, Braaksma S, Gray RAJ. 2013. Reducing shallow landslide occurrence in pastoral hill country using wide-spaced trees. Land Degradation & Development. 24(2):103–114.
- Dymond JR, Betts HD, Schierlitz CS. 2010. An erosion model for evaluating regional land-use scenarios. Environmental Modelling & Software. 25(3):289–298.
- Dymond JR, Herzig A, Basher L, Betts HD, Marden M, Phillips CJ, Ausseil A-GE, Palmer DJ, Clark M, Roygard J. 2016. Development of a New Zealand SedNet model for assessment of catchment-wide soil-conservation works. Geomorphology. 257(Supplement C):85–93.
- Gburek W, Drungil C, Srinivasan M, Needelman B, Woodward D. 2002. Variable-source-area controls on phosphorus transport: bridging the gap between research and design. Journal of Soil & Water Conservation. 57(6):534–543.
- Kuehne G, Llewellyn R, Pannell DJ, Wilkinson R, Dolling P, Ouzman J, Ewing M. 2017. Predicting farmer uptake of new agricultural practices: a tool for research, extension and policy. Agricultural Systems. 156:115–125.
- Land Information New Zealand. 2018. Tenure review: process and properties. [accessed 2019 April 23]. https://www.linz.govt.nz/crown-property/crown-pastoral-land/tenure-review-process-and-properties.
- Ledgard SF, Luo J, Sprosen MS, Wyatt JB, Balvert SF, Lindsey SB. 2014. Effects of the nitrification inhibitor dicyandiamide (DCD) on pasture production, nitrous oxide emissions and nitrate leaching in Waikato, New Zealand. New Zealand Journal of Agricultural Research. 57(4):294–315.
- Legg W, Abbas K, Alfaro D, Dosov B, Fraser N, Grace D, Habib R, Job-Schmitt C, Simela L, Zhong F. 2016. Sustainable agricultural development for food security and nutrition: what roles for livestock? High Level Panel of Experts on Food Security and Nutrition (HLPE).
- Levine B, Paterson J, Burkitt L. 2017. Phosphorus mitigation project: mitigation of surface P runoff using detainment bunds. In: Currie LD, Hedley MJ, editors. Science and policy: nutrient management challenges for the next generation. Palmerston North: Fertilizer and Lime Research Centre, Massey University. http://flrc.massey.ac.nz/workshops/17/Manuscripts/Paper_Levine_2017.pdf
- Livestock Improvement Corporation Limited, DairyNZ. 2019. New Zealand Dairy Statistics 2018–19. 60 p.
- Lu XX, Ran LS, Liu S, Jiang T, Zhang SR, Wang JJ. 2013. Sediment loads response to climate change: a preliminary study of eight large Chinese rivers. International Journal of Sediment Research. 28(1):1–14.
- Lynn IH, Manderson AK, Page MJ, Harmsworth GR, Eyles GO, Douglas GB, Mackay AD, Newsome PJF. 2009. Land use capability survey handbook. A New Zealand handbook for the classification of land. 3rd ed. Hamilton, Lincoln, Lower Hutt: AgResearch, Landcare Research, GNS Science. 163 p.
- Macintosh KA, Mayer BK, McDowell RW, Powers SM, Baker LA, Boyer TH, Rittmann BE. 2018. Managing diffuse phosphorus at the source versus at the sink. Environmental Science & Technology. 52(21):11995–12009.
- Malcolm B, Teixeira E, Johnstone P, Maley S, de Ruiter J, Chakwizira E. 2016. Catch crops after winter grazing for production and environmental benefits. Agronomy New Zealand. 45:99–108.
- Manderson A, Mackay A, Lambie J, Roygard J. 2013. Sustainable land use initiative by Horizons. New Zealand Journal of Forestry Science. 57(4):4–8.
- McDowell RW. 2014. Estimating the mitigation of anthropogenic loss of phosphorus in New Zealand grassland catchments. Science of the Total Environment. 468–469: 1178–1186.
- McDowell RW. 2015. Treatment of pasture topsoil with alum to decrease phosphorus losses in subsurface drainage. Agriculture, Ecosystems & Environment. 207:178–182.
- McDowell RW. 2017. Does variable rate irrigation decrease nutrient leaching losses from grazed dairy farming? Soil Use and Management. 33(4):530–537.
- McDowell RW, Cosgrove GP, Orchiston T, Chrystal J. 2014. A cost-effective management practice to decrease phosphorus loss from dairy farms. J Environ Qual. 43(6):2044–2052.
- McDowell RW, Drewry JJ, Muirhead RW, Paton RJ. 2005. Restricting the grazing time of cattle to decrease phosphorus, sediment and E. coli losses in overland flow from cropland. Soil Research. 43(1):61–66.
- McDowell RW, Hawke M, McIntosh JJ. 2007. Assessment of a technique to remove phosphorus from streamflow. New Zealand Journal of Agricultural Research. 50(4):503–510.
- McDowell RW, Houlbrooke DJ. 2009. Management options to decrease phosphorus and sediment losses from irrigated cropland grazed by cattle and sheep. Soil Use and Management. 25(3):224–233.
- McDowell RW, Lucci GM, Peyroux G, Yoswara H, Brown M, Kalmakoff I, Cox N, Smale P, Wheeler D, Watkins N, et al. 2015. An assessment of MitAgator: a farm-scale tool to estimate and manage the loss of contaminants from land to water. Transactions of the ASABE. 59(2):537–543.
- McDowell RW, Norris M. 2014. The use of alum to decrease phosphorus losses in runoff from grassland soils. J Environ Qual. 43(5):1635–1643.
- McDowell RW, Schallenberg M, Larned S. 2018. A strategy for optimizing catchment management actions to stressor–response relationships in freshwaters. Ecosphere. 9(10):e02482.
- McDowell RW, Sharpley AN, Bourke W. 2008. Treatment of drainage water with industrial by-products to prevent phosphorus loss from tile-drained land. J Environ Qual. 37(4):1575–1582.
- McDowell RW, Wilcock RJ. 2008. Water quality and the effects of different pastoral animals. New Zealand Veterinary Journal. 56(6):289–296.
- Meals DW, Dressing SA, Davenport TE. 2010. Lag time in water quality response to best management practices: a review. J Environ Qual. 39(1):85–96.
- Ministry for Primary Industries. 2013. The dairying and clean streams accord: snapshot of progress 2011/2012. 12 p.
- Ministry for Primary Industries. 2017. Draft regulatory impact statement: stock exclusion. 34 p.
- Ministry for Primary Industries. 2018. Erosion control funding programme. [accessed 2019 April 23]. https://www.mpi.govt.nz/funding-and-programmes/forestry/sustainable-land-management-and-hill-country-erosion-programme/.
- Ministry for the Environment. 2020. National policy statement for freshwater management 2020. 70 p.
- Monaghan R, Manderson A, Basher L, Smith C, Burger D, Meenken E, McDowell RW. 2020a. Quantifying contaminant losses to water from pastoral landuses in New Zealand I. Development of a spatial framework for assessing losses. New Zealand Journal of Agricultural Research. Submitted.
- Monaghan R, Manderson A, Basher L, Spiekermann R, Dymond J, Smith C, Muirhead R, Burger D, McDowell R. 2020b. Quantifying contaminant losses to water from pastoral landuses in New Zealand II. The effects of some farm mitigation actions over the past two decades. New Zealand Journal of Agricultural Research. Submitted.
- Monaghan R, Mercer G, Smith C, Gray C, De Klein CA, Mapp N, Meenken E, Eikass H, Burger D. 2018. Benchmarking and mitigating contaminant losses to water, and GHG emissions to air, for key dairy farm typologies.
- Monaghan RM, Carey PL, Wilcock RJ, Drewry JJ, Houlbrooke DJ, Quinn JM, Thorrold BS. 2009. Linkages between land management activities and stream water quality in a border dyke-irrigated pastoral catchment. Agriculture, Ecosystems & Environment. 129(1–3):201–211.
- Monaghan RM, De Klein CAM. 2014. Integration of measures to mitigate reactive nitrogen losses to the environment from grazed pastoral dairy systems. The Journal of Agricultural Science. 152(SupplementS1):45–56.
- Monaghan RM, Houlbrooke DJ, Smith LC. 2010. The use of low-rate sprinkler application systems for applying farm dairy effluent to land to reduce contaminant transfers. New Zealand Journal of Agricultural Research. 53(4):389–402.
- Monaghan RM, Laurenson S, Dalley DE, Orchiston TS. 2017. Grazing strategies for reducing contaminant losses to water from forage crop fields grazed by cattle during winter. New Zealand Journal of Agricultural Research. 60(3):333–348.
- Morgenstern U, Daughney CJ. 2012. Groundwater age for identification of baseline groundwater quality and impacts of land-use intensification – The National Groundwater Monitoring Programme of New Zealand. Journal of Hydrology. 456–457:79–93.
- Morton JD, McDowell RW, Monaghan RM, Roberts AHC. 2003. Balancing phosphorus requirements for milk production and water quality. Proceedings of the New Zealand Grassland Association. 65:111–115.
- Parliamentary Commissioner for the Environment. 2015. Update report: water quality in New Zealand: land use and nutrient pollution. Wellington: Parliamentary Commissioner for the Enironment. p. 29.
- Payne T, White T. 2006. Deer farmers’ attitudes to fencing. Proceedings of the New Zealand Grassland Association. 68:189–192.
- Queen Elizabeth II National Trust. 2019. Benefits of protecting your land. [accessed 2019 April 23]. https://qeiinationaltrust.org.nz/protecting-your-land/.
- Rivas A, Singh R, Horne D, Roygard J, Matthews A, Hedley MJ. 2017. Denitrification potential in the subsurface environment in the Manawatu River catchment, New Zealand: indications from oxidation-reduction conditions, hydrogeological factors, and implications for nutrient management. Journal of Environmental Management. 197:476–489.
- Sanson R. 2005. The AgribaseTM farm location database. Proceedings of the New Zealand Society of Animal Production. 65:93–96.
- Sanson R, Baxter W. 2011. Stock exclusion survey. 18 p.
- Schipper LA, Robertson WD, Gold AJ, Jaynes DB, Cameron SC. 2010. Denitrifying bioreactors—an approach for reducing nitrate loads to receiving waters. Ecological Engineering. 36(11):1532–1543.
- Sharpley AN, Kleinman PJA, Heathwaite AL, Gburek WJ, Folmar GJ, Schmidt JP. 2008. Phosphorus loss from an agricultural watershed as a function of storm size. Journal of Environmental Quality. 37(2):362–368.
- Smith LC, Orchiston T, Monaghan RM. 2012. The effectiveness of the nitrification inhibitor dicyandiamide (DCD) for mimtigating nitrogen leaching losses from a winter grazed forage crop on a free drainainag soil in northern Southland. Proceedings of the New Zealand Grassland Association. 74:39–44.
- Snelder TH, Biggs BJF, Woods RA. 2005. Improved eco-hydrological classification of rivers. River Research and Applications. 21(6):609–628.
- Snelder TH, Larned ST, McDowell RW. 2018. Anthropogenic increases of catchment nitrogen and phosphorus loads in New Zealand. New Zealand Journal of Marine and Freshwater Research. 52(3):336–361.
- Steinfield H, Gerber P, Wassenaar T, Castel V, Rosales M, de Haan C. 2006. Livestock’s long shadow: environmental issues and options.
- Sunohara MD, Gottschall N, Wilkes G, Craiovan E, Topp E, Que Z, Seidou O, Frey SK, Lapen DR. 2015. Long-term observations of nitrogen and phosphorus export in paired-agricultural watersheds under controlled and conventional tile drainage. Journal of Environmental Quality. 44(5):1589–1604.
- Tan C, Zhang T. 2011. Surface runoff and sub-surface drainage phosphorus losses under regular free drainage and controlled drainage with sub-irrigation systems in Southern Ontario. Canadian Journal of Soil Science. 91(3):349–359.
- Tanner CC, Nguyen ML, Sukias JPS. 2005. Nutrient removal by a constructed wetland treating subsurface drainage from grazed dairy pasture. Agriculture, Ecosystems & Environment. 105(1):145–162.
- Vale SS, Fuller IC, Procter JN, Basher LR, Smith IE. 2016. Application of a confluence-based sediment-fingerprinting approach to a dynamic sedimentary catchment, New Zealand. Hydrological Processes. 30(5):812–829.
- Van Meter KJ, Basu NB. 2017. Time lags in watershed-scale nutrient transport: an exploration of dominant controls. Environmental Research Letters. 12(8):084017.
- Vymazal J. 2018. Does clogging affect long-term removal of organics and suspended solids in gravel-based horizontal subsurface flow constructed wetlands? Chemical Engineering Journal. 331:663–674.
- Weigelhofer G, Ramião JP, Pitzl B, Bondar-Kunze E, O’Keeffe J. 2018. Decoupled water-sediment interactions restrict the phosphorus buffer mechanism in agricultural streams. Science of the Total Environment. 628–629:44–52.
- White MD, Metherell AK, Roberts AHC. 2017. The use of variable rate fertiliser applications in NZ hill country. In: Currie LD, Hedley MJ, editors. Science and policy: nutrient management challenges for the next generation. Palmerston North: Fertilizer and Lime Research Centre, Massey University; p. 13.