
ABSTRACT
Land fragmentation is a growing issue in New Zealand, however, no consistent or regular national monitoring has been established. A methodology for assessing land fragmentation was applied nationally for the first time, revealing that the greatest proportion of fragmentation occurred on land used for diffuse rural residence (>0.40 to ≤2.0 ha) and small parcels (>2.0 to ≤8.0 ha) with a 128% and 73% increase, respectively, between 2002 and 2019. In New Zealand, the most highly productive land (Land Use Capability (LUC) class 1, 2 and 3) is most impacted by continued fragmentation with 38%, 28% and 17% of baseline area, respectively, occupied by medium sized parcels or smaller (≤40.0 ha) with a dwelling in 2019. Impacts were greatest for Auckland with 40%, 44% and 25% of the region’s LUC 1, 2 and 3 land, respectively, occupied by small sized parcels or smaller with a dwelling, increasing to 64%, 67% and 47%, respectively, when including parcels ≤ 40.0 ha. Protection of LUC class 1 and 2 land, particularly, requires national attention. This metric provides an opportunity to evaluate land fragmentation and development over time that could serve both the assessment of policy performance and environmental reporting at national and regional levels.
Introduction
Internationally, urban expansion and land fragmentation reduce the availability of agricultural land, food production and food security for local populations, as well as visual quality and greenspace of rural communities (Brabec and Smith Citation2002; Gardi et al. Citation2015; Nixon and Newman Citation2016). Loss of agricultural land has other consequences, such as increased pressure to convert natural or semi-natural land to agricultural use, such as in Africa, North America and Latin America (Harvey and Pilgrim Citation2011; Gardi et al. Citation2015).
Urban expansion and land fragmentation have been identified as a major threat to soil and potentially agricultural production in Europe (Gardi et al. Citation2015), Canada (Nixon and Newman Citation2016) and China (Song et al. Citation2015), often preferentially occupying high-quality soils (Zambon et al. Citation2018). Across 21 of the 27 European Union states, agricultural land area was estimated to have reduced by c. 70,000 ha per annum from 1990 to 2006 due to urban expansion, resulting in a loss of six million tonnes of wheat (Gardi et al. Citation2015). In Australia, urban sprawl is predicted to reduce local vegetable production from 82% to 21% of Greater Melbourne’s needs, where expected population growth by 2050 from 4 million to 7 million will require 60% more food (Sheridan et al. Citation2015).
In New Zealand, Māori have had a long connection and understanding of soil reaching back centuries to Polynesian migration, recognising soil as a taonga or treasured resource (Harmsworth Citation2020b; Harmsworth Citation2020a). Māori were the first in New Zealand to utilise what we now identify as highly productive land (Singleton Citation1988; Harmsworth Citation2020a) and were regarded as the first commercial orchardist and market gardener in the history of Auckland (Coleman Citation1967). In response to rapidly increasing European immigration in the eighteenth and nineteenth centuries extensive expansion in agriculture developed, as well as distribution of produce within New Zealand and later exports abroad. However, by the mid nineteenth century this began to change dramatically as the settler government enforced individualisation of land titles, and large areas of Māori land were confiscated, with a particular focus on prime agricultural land (Kingi Citation2008).
Today in New Zealand, it is widely recognised that highly productive land (Land Use Capability (LUC) classes 1–3), characterised as versatile for growing a range of crops, is a scarce and finite resource. National mapping of land use capability (LUC) estimates only 5.2% of New Zealand’s total land area has negligible or slight physical limitations for arable and horticultural use (described as LUC classes 1 and 2), increasing to 14.4% when including LUC class 3 land, defined as having moderate physical limitations (Lynn et al. Citation2009; Rutledge et al. Citation2010). This land is of particular importance in the New Zealand context for domestic food production requirements, which has previously been raised by rural industry (Horticulture New Zealand Citation2017). Relying on inter-regional and overseas supplies of basic food staples can create vulnerabilities in a societies’ food system. This is particularly apparent where there are increasing uncertainties surrounding the state of natural resources such as the availability of highly productive land, water scarcity and extreme weather events that can affect regional, national and global food production. The latter is particularly relevant with the current COVID-19 pandemic, which has highlighted the importance of food security and resilience with the disruption of food systems around the world (UNSCN Citation2020). Highly productive land is also important due to its contribution as a major export earner for New Zealand. Horticulture exports, in particular, have nearly doubled from $3.4 billion to $6.2 billion between 2010 and 2019 (Aitken and Warrington Citation2019). There is also growing global demand for dairy products, for which production is heavily reliant on highly productive land resources in New Zealand (Vogeler et al. Citation2014; Ministry for Primary Industries Citation2020b).
Pressures confronting highly productive land have been a long-standing issue dating back to the 1960s in New Zealand, with the historical location of cities often reflecting proximity to this finite resource for local food production needs (Hunt Citation1959; Coleman Citation1967; Cox Citation1968; Leamy Citation1975). In recent years, further concern has been raised on the potential effects of urban expansion and rural land fragmentation in the surrounding areas of some large cities, such as Auckland, Hamilton and Wellington (Rutledge et al. Citation2010; Mackay et al. Citation2011; Andrew and Dymond Citation2012; Curran-Cournane et al. Citation2016b; Curran-Cournane et al. Citation2018). Horticulture has been traditionally located close to labour supply and markets, which coupled with the lower costs of developing flat land and public concern about housing affordability, means horticultural land is typically more vulnerable to urban expansion than other rural sectors (Greenhalgh et al. Citation2017; Curran-Cournane et al. Citation2018). For example, from 2002 to 2016, New Zealand’s land area used for vegetables decreased 29%, from about 100,000 ha to about 70,000 ha (Ministry for Primary Industries & Ministry for Environment Citation2019). In Auckland, most of the contiguous highly productive land is located in and around Pukekohe and Franklin, and coupled with local climate, provides optimal growing conditions for vegetable production (Curran-Cournane et al. Citation2014; Citation2016a). Yet in 2019, it was calculated that legacy and current Auckland Unitary Plan zones have allowed various forms of development types to occupy at least 34%, 38% and 19% of LUC class 1, 2 and 3 land, respectively (Curran-Cournane Citation2019).
Internationally, several monitoring metrics have been developed, such as ‘landscape fragmentation’ due to transport infrastructure and sealed areas (Jaeger et al. Citation2008; European Environment Agency Citation2019), relative consumption of high-quality farmland (Song et al. Citation2015), and density of new urban areas (Hasse and Lathrop Citation2003). In New Zealand, there has been no nationally consistent, regular monitoring, evaluation or reporting on the status of highly productive land nor the land use pressures confronting this resource. While various regional efforts have been undertaken to develop metrics to monitor land fragmentation (Waikato Regional Council Citation2013; Curran-Cournane et al. Citation2014; Citation2016a; Citation2016b; Hart et al. Citation2013), methods and data consistency vary across regions. National one-off attempts have also been applied and approaches vary (Rutledge et al. Citation2010; Andrew and Dymond Citation2012), making it difficult to report on current state and trends (Ministry for the Environment & Statistics New Zealand Citation2018).
Recognising this long-standing issue, the Land Monitoring Forum (LMF), a Regional Council Special Interest Group formed by Local Government New Zealand, initiated development of guidelines to regularly monitor land fragmentation in a consistent way (Rutledge et al. Citation2015), with some preliminary application presented by Hill et al. (Citation2018) and Jones et al. (Citation2018). Land fragmentation in the current setting refers to any division of one or more aspects of a land resource available for land-based primary production, such as through subdivision and residential development including expansion of urban areas, that can restrict the current or future range of possible land uses (modified from Rutledge et al. Citation2015). At a generalised level, the objective of the guidelines was to focus on identifying land potentially available for land-based primary production and monitor the effect of ongoing fragmentation and development of land, particularly highly productive land. The term ‘development’ in the context of this study is all-encompassing considering both the expansion of urban areas as well as the occupancy of a dwelling on land parcels. While Rutledge et al. (Citation2015) set out the rationale and method for establishing a land fragmentation indicator, it did not go as far as conducting the analysis. The objectives of this study were to refine this method and implement this work nationally, specifically to: (1) describe a robust and consistent methodology that can be applied at the national and regional level; and (2) for the first time, apply and report the results of land fragmentation and development analysis for a 17-year period spanning 2002–2019.
Methodology
The approach builds upon the methodology developed by Rutledge et al. (Citation2015), to assess current and future land supply for land-based primary production. Improvements to the existing methodology included the use of several new geospatial data layers at different timesteps, quality assurance procedures, a parcel size classification, and nationwide implementation of the whole procedure. In addition to a national summary, three high growth regions – Auckland, Waikato and Canterbury – were explored for regional variation.
The data layer used to represent New Zealand’s cadastral land base was the New Zealand Primary Parcels – the Land Information New Zealand (LINZ) cadastral dataset – which is New Zealand’s official system to record and locate boundaries of land under various tenure systems (LINZ Citation2020b). For this study, datasets from the 2001/2002 period were compared to those of 2018/2019, nominally defined as the 2002 and 2019 timesteps based on the date of the NZ Primary Parcels layer. The 2002 reference timestep was chosen due to data availability – prior to this, linkages between land titles and cadastral survey registries were separately managed; they were brought together in the Landonline system in 2001 (LINZ Citation2020a).
A geospatial modelling analysis was performed using the ESRI ArcGIS platform and associated Python modelling code, in which the NZ Primary Parcels layer was filtered by a series of national geospatial data layers to identify areas of land that may have a restriction for primary production, as described in . These series of steps identified land-use restrictions arising from biophysical features (e.g. roads and water bodies), land ownership (e.g. legally protected natural areas), and urban areas. A key principle of this method was the use of open-source national scale datasets for each level of analysis. Benefits of public data include uniform, authoritative and independent characteristics, and the avoidance of issues including lack of access, inconsistent data, or restricted use (Rutledge et al. Citation2015). The other key principle was that datasets must have different temporal versions, with the likelihood of future versions for possible land fragmentation monitoring reiterations.
Table 1. Steps involved in geospatial analysis of LINZ Primary Parcels layer to identify land that may have a restriction for primary production.
Following the identification of land that may have a restriction for land-based primary production, the direct effects of land fragmentation and development were then assessed for the remaining land parcels by identifying changes in the definition () and area of these land parcels through subdivision or changes in the parcel intent designation. Applying the methodology allows for the determination of monitoring changes in urban area, as well as fragmentation of the land supply for land-based primary production with the following metrics:
Changes in the summed area of parcels, and parcel counts, classified into specified parcel size class thresholds, with or without a dwelling (defined in ).
Changes in parcel size class attributes associated with highly productive land (defined here as LUC classes 1–3).
Table 2. Parcel size class definitions.
The parcel size class boundaries are broadly based on historical parcel areas used in New Zealand, based on units of acres. For example, 2 ha is slightly smaller than 5 acres; 4 ha, 10 acres; 8 ha, 20 acres; and 40 ha is slightly smaller than 100 acres. The classes also broadly correlate to groupings of different land use recorded in the Agribase® dataset (AsureQuality Citation2020). Rural residential and horticultural land use tend to be predominantly in the small parcel size class. Unpublished analysis of Agribase® 2020 showed a similar pattern to that found by Rutledge et al. (Citation2015), when analysing Agribase® 2014 data. The ‘broad acre’ farm types (dairy, sheep and beef, arable and forestry) were shown by Rutledge et al. (Citation2015) to be predominantly classed in the medium to large parcel size classes as outlined in .
The development and land fragmentation of urban areas and parcel size classes were also analysed according to the Land Use Capability (LUC) classification in Lynn et al. (Citation2009). The New Zealand Land Resource Inventory (NZLRI) LUC classification was produced and mapped across New Zealand from 1975 into the 1980s. Versatility is implied in the LUC classification system (i.e. it encompasses the soil, climatic, erodibility and topographic limitations or advantages of the land and soil attributes for a parcel of land). It treats class 1 land as the most versatile LUC class with versatility decreasing down the scale towards LUC class 8 land (Lynn et al. Citation2009). The focus is on LUC classes 1–3, which are proposed as the default basis for the mapping of highly productive land (HPL) in New Zealand through the National Policy Statement for Highly Productive Land (Ministry for Primary Industries & Ministry for Environment Citation2019). It is noted that prior to this there was no nationally consistent method for defining HPL, so care needs to be taken in comparing results with previous research using different methods. The fragmentation and development of LUC classes 1, 2 and 3 were also analysed individually because when considered collectively the dominance of LUC class 3 land can dilute effects on LUC classes 1 and 2 (Table A1).
One limitation of the LUC mapping was that areas that were already developed for urban use were not mapped for LUC, but rather denoted as ‘town’. Therefore the development of urban areas in 2002 and 2019 that are reported in this research are not the total urban area, but the ‘new’ urban areas that have occurred since the original LUC mapping, as the main focus is on reporting land fragmentation on LUC land between the two timesteps. When comparing change for specific LUC classes, the relative scale of these changes are also compared to baseline LUC areas for years 2002 and 2019, where the baseline LUC areas were defined as the land potentially available to support primary production, after the extraction of potential restrictions as defined in Table A1. The ‘new’ urban area extent as considered in this research (analytical step 2 in and what coincided with mapped areas of LUC) was not excluded from this extraction process in order to determine how its expansion affects ‘baseline’ LUC areas across the two timesteps.
Results
Changes in development and parcel size classes 2002–2019
Expansion of ‘new’ urban area that occurred on land mapped as LUC classes 1–7, increased 29% (22,121 ha) from 76,755 ha in 2002 to 98,876 ha in 2019 (). As a result, the total New Zealand urban area increased 13% to 206,565 ha in 2019 (data not shown). In 2019, half of New Zealand’s urban area expansion was located in Auckland, Waikato and Canterbury ().
Table 3. Change in land area (with percentage change in parentheses) across urban and parcel size classes with a dwelling between 2002 and 2019.
Outside of the mapped urban area, the number of diffuse urban parcels (0.0 to ≤0.40 ha) increased 48% from 69,592 in 2002 to 103,212 in 2019 (). The area of land in the diffuse urban residential category increased 70% (4,426 ha) nationally, and 96%, 45% and 42% in the Waikato, Auckland and Canterbury regions, respectively ().
Figure 1. Parcel type counts with a dwelling in 2002 and 2019 in New Zealand and select regions.
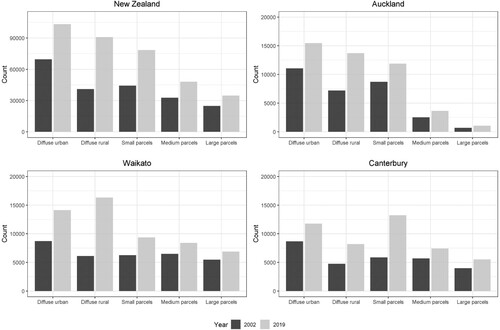
The greatest proportional change occurred in the area of land used for diffuse rural residential development (>0.40 to ≤2.0 ha) and small sized parcels (>2.0 to ≤8.0 ha) with a dwelling, which increased by 128% and 73%, respectively, between 2002 and 2019 (). The number of parcels in each category increased by a similar magnitude (). The change differs between regions, with diffuse rural residential development in the Waikato increasing proportionally more than twice as much as in Canterbury, whilst Canterbury had an increase in small parcels that was proportionally over three times greater than in Auckland and Waikato ( and and ). Fragmentation and development predominately occurred in close surrounding of urban areas, satellite towns, and roading axes notwithstanding the extent of additional fragmentation beyond these zonal boundaries as illustrated in .
Figure 2. Change in urban areas and parcel size classes, with or without a dwelling, for selected areas in Auckland (A and B), Waikato (C and D) and Canterbury (E and F) in 2002 and 2019. ‘Extracted land’ is that per analytical steps 1, 3 and 4 and ‘urban area’ is that per step 2 in . CBD denotes central business district.
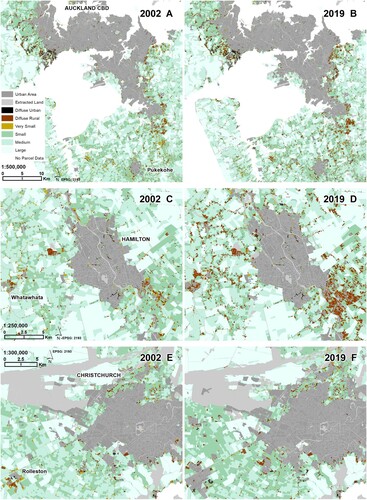
Table 4. Change in land area (percentage in parentheses) of Land Use Capability (LUC) class 1–3 and 4–7 categories across urban and parcel size classes with a dwelling between 2002 and 2019.
Between years 2002 and 2019, parcels with dwellings in the medium (>8.0 to ≤40.0 ha) and large (>40.0 ha) sized parcel classes increased in total area by 45% and 47%, respectively (), with the total number of parcels with dwellings increasing by 47% and 40%, respectively ().
The observed increase in both the number of parcels and total area in all parcel size classes was a consistent trend of ongoing land fragmentation at both the national and selected regional levels. This is likely associated with multiple activities, including the fragmentation within parcels of larger size, as well as the development of land previously without a dwelling (). For example, the area of LUC class 1–7 land without a dwelling decreased by 26% from 11,463,389ha in 2002–8,523,426 ha in 2019 ().
Table 5. Change in land area (percentage in parentheses) of Land Use Capability (LUC) class 1–3 and 4–7 categories across parcel size classes without a dwelling between 2002 and 2019.
Overall, the national average non-urban parcel size with a dwelling decreased from 33.5 ha in 2002 to 28.0 ha in 2019, a 16% reduction, based on the area of land potentially available for primary production divided by the total parcel count ( and ).
Fragmentation and development of highly productive land and changes from 2002 to 2019
Except for large sized parcels, most of the fragmentation and development across all parcel sizes in New Zealand occurred on highly productive land (LUC classes 1–3) (). The rate of urban area expansion was also greatest on LUC 1–3 land, with c.25% more development since 2002 compared to the change on LUC 4–7 land (). In the Auckland and Waikato regions, the rate of expansion of the urban area onto LUC 1–3 land was at least double the rate of expansion on LUC 4–7 land ().
In 2019, more than half of the land area comprising the diffuse urban, rural residential development, small parcels (with a dwelling) and medium parcels (with a dwelling), occupied LUC 1–3 land in New Zealand (). There was an additional 28% and 25% decrease of LUC 1–3 and LUC 4–7 land without a dwelling between 2002 and 2019 (). Collectively, the trend suggests a large degree of fragmentation and development associated with all parcel classes during this 17-year period that disproportionally occurred on highly productive land. This is, for example, demonstrated by the growth of the small parcels in Canterbury, with an expansion of over 23,000 ha since 2002, with growth occurring three times greater on highly productive land (, Figure A1 and ).
When considering LUC class 1, 2 and 3 land individually, in 2019 all forms of fragmentation and development disproportionately coincided with LUC class 1 land followed by LUC 2 and 3 land in New Zealand. Compared to the national baseline areas (Table A1 – C), 15%, 10% and 6% of LUC 1, 2 and 3 land, respectively, was occupied by small sized parcels or smaller with a dwelling in 2019 ( and Table A2). This increased to 38%, 28% and 17%, respectively, when medium sized parcels or smaller with a dwelling were considered ( and Table A2). In contrast, only 5.2% of baseline LUC 4–7 land was occupied by medium sized parcel classes or less with a dwelling in 2019. Further fragmentation is also evident with an additional 724,129 ha or 21% of baseline LUC class 1–3 land (vs 8.3% of baseline LUC 4–7) occupied by medium sized parcels or smaller without a dwelling in 2019 ().
Figure 3. Cumulative effect of urban area and fragmentation of parcel size classes (with a dwelling) on baseline Land Use Capability (LUC) areas in 2002 and 2019.
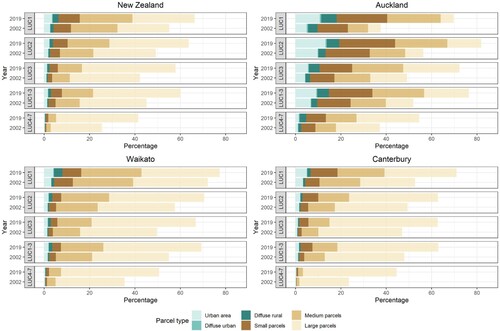
The extent of change on highly productive land has also been substantial in New Zealand. Between 2002 and 2019 the area of land occupied by medium sized parcels or smaller with a dwelling increased by 20%, 32% and 47% on LUC 1, 2 and 3 land, respectively (). A similar trend was observed at a regional level, but was most pronounced for Auckland with 40%, 44% and 25% of LUC 1, 2 and 3 land, respectively, occupied by small sized parcels or smaller with a dwelling in 2019, increasing to 64%, 67% and 47%, respectively, when medium sized parcels or smaller with a dwelling were considered (). The latter reflects an increase of 100%, 38% and 44% on LUC 1, 2 and 3 land, respectively, since 2002. Only a small proportion (6%) of large sized parcels with a dwelling in Auckland occupy LUC 1 land in 2019. In contrast, large sized parcels occupied approximately one-third of LUC 1 land in Waikato (34%) and Canterbury (32%); although Canterbury experienced a large degree of development on LUC class 1 land between 2002 and 2019 ().
Discussion
Implications of land fragmentation and development on potential primary production
The greatest proportional change in New Zealand occurred on land used for diffuse rural residential development and small parcels with a dwelling, with much of this occurring on highly productive land ( and ). Demand for lifestyle block living has been considered a key driver of land fragmentation, as are the financial gains associated with rural residential subdivision (Hart et al. Citation2013). While rural residential development is not necessarily viewed as a negative process in its own right, issues can arise with scattered, in-situ or sporadic development which can reinforce the demand for further fragmentation of rural land over time, therefore creating a cumulative effect (Hart et al. Citation2013). Over time, cumulative land fragmentation in rural production zones can subject commercial farming practices to increased reverse sensitivity pressures, which will not only impact negatively on operations but potentially on farm productivity (Curran-Cournane et al. Citation2016a; Citation2016b). Rural residential expansion can also be an issue where it coincides with highly productive land, with Andrew and Dymond (Citation2012) previously estimating that lifestyle blocks occupied 10% of New Zealand’s LUC class 1 and 2 land, effectively shifting the land use on these sites out of commercial primary production.
New Zealand is a net food exporter (Rush and Obolonkin Citation2020) and is the world’s largest exporter of milk products (Ledgard et al. Citation2020), with growing demand as the global population continues to increase. The global population is projected to reach 10 billion by 2050 which will require sustenance of a healthy diverse diet that is sustainably grown (Willett et al. Citation2019). In New Zealand, population growth reached 5 million in 2020, taking only 17 years to reach from 4 million in 2003 – and is forecast to reach 6 million by the 2040s (Statistics New Zealand Citation2020b). Global and national literature repeatedly indicate that shifting the population towards more a sustainable diet is needed to ensure both health and climate benefits (Clark et al. Citation2019; Swinburn et al. Citation2019; Willett et al. Citation2019; Drew et al. Citation2020). Such shifts in diet are largely dependent on highly productive land, that food categories such as outdoor vegetable production, grains and a variety of fruit crops are limited to. Thus, the soil resource is still as important as ever, but at the same time is becoming increasingly vulnerable to land fragmentation and development ( and Table A2). The global outbreak of COVID-19 has reinforced the importance of the reliable production of domestic basic food staples that highly productive land is pertinent to.
Recent targets have been set to add $44 billion in export earnings over the next decade by the primary sector to help with New Zealand’s economic recovery (Ministry for Primary Industries Citation2020a) – an ambitious target considering primary industries generated just over $46 billon in export revenue in 2019 (Ministry for Primary Industries Citation2020b). Increasing production in the primary sector will place greater importance on the availability, as well as the sustainable management, of highly productive land. To date, evidence suggests that the soil resource, in general, has not always been well managed, with soil quality issues such as soil compaction and the excessive use of fertiliser persisting for over 20 years in some regions (Taylor et al. Citation2017; Curran-Cournane Citation2020). It is likely that ongoing land fragmentation and development will see increased intensification on the remaining land resource, and consequential challenges in maintaining soil quality. Therefore, moves towards more sustainable land and soil use and management are incredibly important in achieving environmentally positive primary sector outcomes as pressures to increase productivity continue.
The results of the current study show that by 2019 one-third of New Zealand’s most versatile land (LUC 1 and 2) is now occupied by medium sized parcels or smaller parcels with a dwelling. This has implications in terms of options and choices for land-based primary production for current and future generations. For example, whilst recognising a large degree of variation can exist across rural sectors and regions, various forms of pastoral farming such as dairy, sheep and beef as well as certain outdoor vegetable and arable growing operations can require large areas of land to operate, ranging from >80 to several 100 ha (Statistics New Zealand Citation2016; Curran-Cournane Citation2017). Dairy farms typically operate on LUC class 1–4 land, with model simulations demonstrating greater operating farm profits generated from LUC class 1 and 2 land with profits declining on class 3 and 4 land (Vogeler et al. Citation2014; Vogeler et al. Citation2016). The latter is attributed to the generation of greater pasture production yields with less inputs required on higher LUC class land (Vogeler et al. Citation2014; Vogeler et al. Citation2016; Hicks and Curran-Cournane Citation2017). Research also consistently shows lower contaminant leaching on deep soils of LUC 1 and 2, compared to shallow and stony soils of lower capability, highlighting the importance of highly productive land to meeting freshwater quality objectives (Carrick et al. Citation2013; McLeod et al. Citation2014).
Implications for policy
Over the 2002–2019 period, land fragmentation and development disproportionately coincided with LUC class 1 land followed by classes 2 and 3 land. In response to the ongoing concern over the loss and fragmentation of highly productive land highlighted in the ‘Our Land’ national environmental report (Ministry for the Environment & Statistics New Zealand Citation2018), the Minister for the Environment announced in 2018 the instigation of work towards a proposed National Policy Statement for Highly Productive Land (NPS-HPL). A discussion document followed with an overarching objective to ensure ‘Highly productive land is protected for use in land-based primary production both now and for future generations’ (Ministry for Primary Industries & Ministry for Environment Citation2019). National policy statements (instruments issued under section 52(2) of the Resource Management Act 1991) enable government to prescribe objectives and policies for matters of national significance. The intention of the NPS-HPL is to ensure the protection of this remaining finite resource from effectively irreversible urban and rural residential expansion and fragmentation, as well as issues associated with reverse sensitivity.
Auckland, Waikato and Canterbury have Regional Policy Statement provisions that essentially, and at a generalised level, use the land use capability classification to instruct the protection of LUC 1 (Auckland); LUC 1 and 2 land (Canterbury); LUC 1, most subclasses of LUC 2, and some subclasses of LUC 3 land for Waikato; or LUC 2 and 3 where practicable in Auckland from inappropriate subdivision, use, and development (Auckland City Citation2008; Waikato Regional Council Citation2012; Environment Canterbury Citation2013; Auckland Council Citation2016; Waikato Regional Council Citation2018). Considering the impacts of fragmentation and development, particularly on LUC 1 and 2 land, the results of this study raise questions on the effectiveness of these policies on their own, notwithstanding other potentially influencing factors.
This reiterates the importance of the proposed overarching NPS-HPL, as well as measures to ensure its implementation and effectiveness, of which the latter could be evaluated against future updates of this land fragmentation metric. Future monitoring of this metric can also be specifically applied at the regional and territorial scale. For medium and high growth regions, identifying areas for future growth could be guided by future updates of this metric to avoid ongoing pressures of fragmentation and development of highly productive land. Regions that have already identified these ‘live zones’, for example, urban or countryside living zones that are not yet built on, could underestimate the amount of highly productive land impacted by land fragmentation and development in the current study.
When considering examples of international policy, British Columbia (BC), in Canada, is one of the oldest examples where land use regulation has legislated the Agricultural Land Reserve (ALR). The ALR, established in 1973 (Androkovich Citation2013), attempts to avoid land fragmentation and safeguard highly versatile farmland from development, which was previously identified as an ongoing issue for the region (Nixon and Newman Citation2016). Despite a 5% loss of original reserve area, the ALR, as a whole, has been regarded as being successful in maintaining local food production, sustaining the economic importance of the agricultural sector, and ensuring environmental protection (Androkovich et al. Citation2008; Nixon and Newman Citation2016).
While less focussed on highly productive land, and more on fragmentation as a whole, Inostroza et al. (Citation2013) developed multiple metrics of spatial fragmentation monitoring over a 20-year period for South America that indicated an increasing trend towards urban sprawl (Inostroza et al. Citation2013). It signalled the need for an adequate urban development spatial strategy that can be achieved with the lowest cost and highest efficiency possible to accommodate for many cities forecast to double in size by 2035 (Inostroza et al. Citation2013). Not only was the information considered important in terms of ensuring the long-term availability of the finite land resource, it was proposed to be used to help inform what acceptable degrees of sprawl and fragmentation are.
Implications for future monitoring and reporting
The development of this metric is one that allows, for the first time, monitoring and reporting on the status of land fragmentation and development for all parcel classes, beyond previously published literature that has been largely focused on the expansion of urban areas and rural residential development (Rutledge et al. Citation2010; Andrew and Dymond Citation2012; Curran-Cournane et al. Citation2014). The impact of continued expansion of urban areas as well as diffuse urban and rural residential development onto LUC classes 1–3 is important, with definite differences in how this is occurring across different regions ( and ). However, it is considered that the cumulative fragmentation effects of small and medium sized parcel classes also warrants the same, or arguably a greater level of future attention, particularly on LUC class 1 and 2 land as it impacts a larger proportion of this finite resource that can limit options and choices of the land for future generations.
The development of this land fragmentation metric is one that is reproducible, clearly and objectively defined, and based on publicly available data that collectively enables future regular monitoring and reporting. This fits criteria set by Statistics New Zealand for the provision of additional indicators needed for improving state of the environment reporting (Ministry for the Environment & Statistics New Zealand Citation2019), and allows filling a key knowledge gap identified by the Parliamentary Commissioner for the Environment (Citation2019). Sound and objective definitions for describing diffuse residential development and a range of parcel size classes have been established that will allow consistent and comparable reporting over time. Some regions have their own specific land use capability classification systems that could be used as an alternative at the regional level (Agriculture New Zealand Citation1994; Hicks and Vujcich Citation2017), but because highly productive land is a national asset there is a rationale and need for national co-ordination of its definition, mapping and monitoring. Not only could this metric guide policy effectiveness monitoring and evaluation at national and regional levels, it could be established as a core indicator as part of the Environmental Reporting Act 2015 as well as other national reporting platforms such as Land Air Water Aotearoa.
Conclusion
A large amount of development on New Zealand’s highly productive land has been observed between 2002 and 2019, ranging from the growth of urban areas to diffuse urban and rural residential fragmentation. The greatest proportional change occurred for the latter, resulting in an area increase of 128% over the 17-year period. Most of this fragmentation and development occurred on highly productive land – a limited and finite resource.
However, the results of the study highlighted that highly productive land was most impacted by the fragmentation and development of small and medium parcel size classes, which arguably warrants greater attention. Nationally, this equates to 38%, 28% and 17% of LUC 1, 2 and 3 land, respectively, being occupied by medium sized parcels or smaller with a dwelling in 2019. A similar trend was observed at a regional level, but was most pronounced for Auckland with 40%, 44% and 25% of LUC 1, 2 and 3 land, respectively, occupied by small sized parcels or smaller with a dwelling in 2019, increasing to 64%, 67% and 47%, respectively, when including medium sized parcels.
Such trends are the result of either the fragmentation within parcels of larger size, as well as the development of existing land parcels that previously did not have a dwelling. This can create a cumulative effect and may reinforce the demand for further fragmentation that, over time, can compromise commercial rural operations that require large areas of land to operate, impacting options and choices for future generations.
Ongoing fragmentation and development is clearly disproportionately affecting the availability of New Zealand’s best farmland, particularly the highly versatile but scare LUC 1 and 2 land. Currently, there are no national policies that protect this finite resource from continued fragmentation and development. The trends shown in this research also raise questions on the effectiveness of current polices related to the protection of LUC 1, 2 and 3 land at the regional level. This metric enables consistent and regular reporting over time to evaluate continuous fragmentation and development, particularly of a scarce and finite soil resource, that could serve both the assessment of future policy performance and environmental reporting at national and regional levels.
Figure S1
Download JPEG Image (1.7 MB)
Supplementary Information
Download MS Word (451.5 KB)Acknowledgements
The Ministry for the Environment and Statistics New Zealand are thanked for supporting this research. This research was also supported by Manaaki Whenua Landcare Research’s Strategic Science Investment Funding from the Ministry of Business, Innovation and Employment’s Science and Innovation Group. Waikato Regional Council and Olliver & Co are also thanked with supporting access to historical input datasets. The authors would like to thank the reviewers for their role which helped improve the quality of the manuscript.
Disclosure statement
No potential conflict of interest was reported by the author(s).
Additional information
Funding
Related Research Data
References
- Agriculture New Zealand 1994. Classification system for productive land in the Tasman District. Report prepared for the Tasman District Council by Agriculture New Zealand Richmond. 06 December 1994.
- Aitken AG, Warrington IJ. 2019. FreshFacts. New Zealand Horticulture. https://www.freshfacts.co.nz/files/freshfacts-2019.pdf
- Andrew R, Dymond JR. 2012. Expansion of lifestyle blocks and urban areas onto high-class land: an update for planning and policy. Journal of the Royal Society of New Zealand. 43:128–140.
- Androkovich RA. 2013. British Columbia's agricultural land reserve: economic, legal and political issues. Land Use Policy. 30:365–372.
- Androkovich R, Desjardins I, Tarzwell G, Tsigaris P. 2008. Land preservation in British Columbia: An empirical analysis of the factors underlying public support and willingness to pay. Journal of Agricultural and Applied Economics. 40:999–1013.
- AsureQuality. 2020. Agribase® 2020. https://www.asurequality.com/services/agribase/.
- Auckland City. 2008. Auckland City Council Regional Policy Statement ACRPS Chapter 2 – Regional Overview and Strategic Direction. http://www.aucklandcity.govt.nz/council/documents/regionalplans/aucklandcouncilregionalpolicystatement/ACRPS%20Chapter%202.pdf.
- Auckland Council. 2016. Auckland Unitary Plan Operative in Part (15 November 2016) - B2 Urban Growth and Form. https://unitaryplan.aucklandcouncil.govt.nz/Images/Auckland%20Unitary%20Plan%20Operative/Chapter%20B%20RPS/B2%20Urban%20Growth.pdfand B9 Rural Environment https://unitaryplan.aucklandcouncil.govt.nz/Images/Auckland%20Unitary%20Plan%20Operative/Chapter%20B%20RPS/B9%20Rural%20environment.pdf
- Brabec E, Smith C. 2002. Agricultural land fragmentation: the spatial effects of three land protection strategies in the eastern United States. Landscape and Urban Planning. 58:255–268.
- Carrick S, Palmer D, Webb T, Scott J, Lilburne L. 2013. Stony soils are a major challenge for nutrient management under irrigation development. In: Currie LD, Christensen CL eds Accurate and efficient use of nutrients on farms http://flrc.massey.ac.nz/publications.html. Occasional Report No. 26. Palmerston North, New Zealand, Fertilizer and Lime Research Centre, Massey University. 8 p.
- Clark MA, Springmann M, Ja H, Tilman D. 2019. Multiple health and environmental impacts of foods. Proceedings of the National Academy of Sciences. 116:46. doi:10.1073/pnas.1906908116.
- Coleman BP. 1967. The effect of urbanisation on agriculture. In: Whitelaw J S., editor. Auckland in ferment. Auckland: New Zealand Geographical Society; p. 102–111.
- Cox J. 1968. Town and Country Planning. In: Soils of New Zealand, part 1. New Zealand Soil Bureau Bulletin. 26(1):119–123.
- Curran-Cournane F. 2017. Evidence in Chief of Dr Fiona Curran-Cournane on behalf of Auckland Council before the Environment Court at Auckland ENV-2016-304-000111. 20 December 2017.
- Curran-Cournane F. 2019. Evidence in Chief of Dr Fiona Curran-Cournane on behalf of Auckland Council before the Environment Court at Auckland ENV–2016–AKL-304–000199. 20 December 2019.
- Curran-Cournane F. 2020. Differences in soil quality and trace elements across land uses in Auckland and changes in soil parameters from 1995–2017. Auckland Council Technical Report TR2020/001.
- Curran-Cournane F, Cain T, Greenhalgh S, Samarasinghe O. 2016b. Attitudes of a farming community towards urban growth and rural fragmentation- An Auckland case study. Land Use Policy. 58:241–250.
- Curran-Cournane F, Golubiewski N, Buckthought L. 2018. The odds appear stacked against versatile land: can we change them? New Zealand Journal of Agricultural Research. doi: 10.1080/00288233.2018.1430590.
- Curran-Cournane F, Lawrence G, Fredrickson C. 2016a. Tracking the progress of the Auckland Plan rural subdivision target (2013 – March 2016). Auckland Council Working Report 2016/003.
- Curran-Cournane F, Vaughan M, Memon A, Fredrickson C. 2014. Trade-offs between high class land and development: recent and future pressures on Auckland’s valuable soil resources. Land Use Policy. 39:146–154.
- Drew J, Cleghorn C, Macmillan A, Mizdrak A. 2020. Healthy and climate-friendly eating patterns in the New Zealand context. Environmental Health Perspectives. 128:017007–1-017007–017013.
- Environment Canterbury. 2013. Canterbury Regional Policy Statement 2013 - revised February 2017. Canterbury: Environment Canterbury Regional Council.
- European Environment Agency. 2019. Landscape fragmentation pressure and trends in Europe. https://www.eea.europa.eu/data-and-maps/indicators/mobility-and-urbanisation-pressure-on-ecosystems-2/assessment.
- Gardi C, Panagos P, Van Liedekerke M, Bosco C, De Brogniez D. 2015. Land take and food security: assessment of land take on the agricultural production in Europe. Journal of Environmental Planning and Management. 58:898–912.
- Greenhalgh S, Samarasinghe O, Curran-Cournane F, Wright W, Brown P. 2017. Using ecosystem services to underpin cost benefit analysis: Is it a way to protect finite soil resources? Ecosystem Services. 27:1–14.
- Harmsworth G. 2020a. Te Ao Māori: relationships with soil. Soil News 68:4. New Zealand Soil Science Society.
- Harmsworth G. 2020b. Chapter Two - Oneone Ora, Tangata Ora: Soils and Māori Health and Wellbeing. In: Jessica Hutchings, Jo Smith, editor. Te Mahi Oneone Hua Parakore: A Māori Soil Sovereignty and Wellbeing Handbook.
- Hart G, Rutledge D, Price R 2013. Guidelines for monitoring land fragmentation: Review of knowledge, issues, polices and monitoring. Prepared by Landcare Research LC1705 for the Regional Council Land Monitoring Forum http://www.landcareresearch.co.nz/__data/assets/pdf_file/0010/71938/Guidelines_monitoring_land_fragmentation_Oct_2013.pdf.
- Harvey M, Pilgrim S. 2011. The new competition for land: food, energy, and climate change. Food Policy. 36:S40–S51.
- Hasse JE, Lathrop RG. 2003. Land resource impact indicators of urban sprawl. Applied Geography. 23:159–175.
- Hicks DL, Curran-Cournane F. 2017. Matching farm production data to land use capability for Auckland. Auckland Council Technical Report TR 2017/020.
- Hicks DL, Vujcich V. 2017. Farm-scale land use capability classification for Auckland. Auckland Council Technical Report TR2017/016.
- Hill R, Jones H, Borman D. 2018. Local scale land fragmentation on high class soils in the Waikato region. Paper presented at the NZSSS Biennial Conference, Napier Conference Centre, Napier, December 2018.
- Horticulture New Zealand. 2017. New Zealand domestic vegetable production: the growing story 2017 Horticulture New Zealand http://www.hortnz.co.nz/assets/Media-Release-Photos/HortNZ-Report-Final-A4-Single-Pages.pdfNew
- Hunt DT. 1959. Market gardening in metropolitan Auckland. New Zealand Geographer. 15:130–155.
- Inostroza L, Baur R, Csaplovics E. 2013. Urban sprawl and fragmentation in Latin America: A dynamic quantification and characterization of spatial patterns. Journal of Environmental Management. 115:87–97.
- Jaeger J, Bertiller R, Schwick C, Müller K, Steinmeier C, Ewald K, Ghazou IJ. 2008. Implementing landscape fragmentation as an indicator in the Swiss monitoring system of sustainable development (Monet). Journal of Environmental Management. 88:737–751.
- Jones H, Hill R, Curran-Cournane F, Borman D 2018. Loss of versatile land available for production. Two regional examples of a nationally consistent monitoring approach Auckland and Waikato. New Zealand Soil Science Society Conference, Napier, 06 December, 2018.
- Kingi T 2008. Ahuwhenua: Māori Land and Agriculture. Land ownership and Māori agriculture. Te Ara Encyclopedia of New Zealand. https://teara.govt.nz/en/ahuwhenua-maori-land-and-agriculture/page-2
- Leamy M. 1975. Competition for productive land in New Zealand. New Zealand Agricultural Science. 9:91–97.
- Ledgard SF, Falconer SJ, Abercrombie R, Philip G, Hill JP. 2020. Temporal, spatial, and management variability in the carbon footprint of New Zealand milk. Journal of Dairy Science. 103:1031–1046.
- LINZ. 2020a. Types of property ownership and boundary data. Land Information New Zealand, https://www.linz.govt.nz/data/linz-data/property-ownership-and-boundary-data/types-lds-property-ownership-and-boundary-data.
- LINZ. 2020b. Land Information New Zealand. New Zealand Primary Parcels (Survey & Title). https://data.linz.govt.nz/layer/772-nz-primary-parcels/
- LINZ. 2020c. Land Information New Zealand Data service. https://data.linz.govt.nz/
- LRIS. 2020. Manaaki Whenua Landcare Research LRIS portal https://lris.scinfo.org.nz/
- Lynn I, Manderson A, Page M, Harmsworth G, Eyles G, Douglas G, Mackay A, Newsome P. 2009. Land Use Capability Survey Handbook. A New Zealand handbook for the classification of land- 3rd edition. Hamilton/Lincoln/Lower Hutt: AgResearch Ltd/Landcare Research New Zealand Ltd/Institute of Geological and Nuclear Sciences Ltd.
- Mackay A, Stokes S, Penrose M, Clothier B, Goldson S, Rowarth J. 2011. Land: Competition for future use. New Zealand Science Review. 68:67–71.
- McLeod M, Aislabie J, McGill A, Rhodes P, Carrick S. 2014. Leaching of Escherichia coli from stony soils after effluent application. Journal of Environmental Quality. 43:528–538.
- Ministry for Primary Industries. 2020a. Fit for a Better World. Accelerating our economic potential. Ministry for Primary Industries https://www.mpi.govt.nz/dmsdocument/41031-fit-for-a-better-world-accelerating-our-economic-potential
- Ministry for Primary Industries. 2020b. SOPI: Situation and Outlook for Primary Industries March 2020. https://www.mpi.govt.nz/dmsdocument/39935-situation-and-outlook-for-primary-industries-sopi-march-2020.
- Ministry for Primary Industries, Ministry for Environment. 2019. Discussion document on a proposed National Policy Statement for Highly Productive Land. Ministry for Primary Industries. August 2019.
- Ministry for the Environment. 2017. National planning standards: Zones and overlays – spatial layers in plans. Discussion paper C. Publication number: ME 1319. Ministry for the Environment. 41 p.
- Ministry for the Environment, Statistics New Zealand 2018. Our Land. 2018. Data to 2017 At a Glance. New Zealand's Environmental Reporting Series. New Zealand Government.
- Ministry for the Environment, Statistics New Zealand. 2019. New Zealand’s Environmental Reporting Series: Environment Aotearoa 2019. Available from www.mfe.govt.nz and www.stats.govt.nz.
- Nixon DV, Newman L. 2016. The efficacy and politics of farmland preservation through land use regulation: Changes in southwest British Columbia’s Agricultural Land Reserve. Land Use Policy. 59:227–240.
- Parliamentary Commissioner for the Environment. 2019. Focusing Aotearoa New Zealand’s environmental reporting system November 2019 https://www.pce.parliament.nz/publications/focusing-aotearoa-new-zealand-s-environmental-reporting-system.
- QEII. 2020. QEII National Trust digital boundaries. https://qeiinationaltrust.org.nz/publications-and-resources/gis-data/.
- Rush E, Obolonkin V. 2020. Food exports and imports of New Zealand in relation to the food-based dietary guidelines. European Journal of Clinical Nutrition. 74:307–313.
- Rutledge D, Price R, Hart G. 2015. National Guidelines for Monitoring and Reporting Effects of Land Fragmentation. Prepared by Landcare Research LC 2144 for the Regional Council Land Monitoring Forum http://www.landcareresearch.co.nz/__data/assets/pdf_file/0013/106132/Guidelines_monitoring_land_fragmentation_2015.pdf.
- Rutledge DT, Price R, Ross C, Hewitt A, Webb T, Briggs C. 2010. Thought for food: impacts of urbanisation trends on soil resource availability in New Zealand. Proceedings of the New Zealand Grassland Association. 72:241–246.
- Sheridan J, Larsen K, Carey R. 2015. Melbourne's foodbowl: Now and at seven million. Victorian Eco-Innovation Lab, The University of Melbourne. http://www.ecoinnovationlab.com/wp-content/attachments/Melbournes-Foodbowl-Now-and-at-seven-million.pdf.
- Singleton PL. 1988. Cultivation and soil modification by the early Māori in the Waikato. New Zealand Soil News. 36:49–57. New Zealand Soil Science Society.
- Song W, Pijanowski BC, Tayyebi A. 2015. Urban expansion and its consumption of high-quality farmland in Beijing, China. Ecological Indicators. 54:60–70.
- Statistics New Zealand. 2016. Agriculture Production Survey 2016 farmcount and farmsize by farmtype at National and Auckland regional levels - Custom Report. Agricultural Production Statistics. Statistics New Zealand.
- Statistics New Zealand. 2020a. StatsNZ 2020 Dwelling Address ClassificationV3.0.0. http://aria.stats.govt.nz/aria/#ClassificationView:uri=http://stats.govt.nz/cms/ClassificationVersion/CARS7323
- Statistics New Zealand. 2020b. New Zealand’s population passes 5 million (May 2020). Statistics New Zealand https://www.stats.govt.nz/news/new-zealands-population-passes-5million#:~:text=New%20Zealand's%20resident%20population%20provisionally,reaching%204%20million%20in%202003.%22.
- Swinburn BA, Kraak VI, Allender S, Atkins VJ, Baker PI, Bogard JR, Brinsden H, Calvillo A, De Schutter O, Devarajan R, et al. 2019. The global syndemic of obesity, undernutrition, and climate change: The Lancet Commission report. Lancet. 393:791–846.
- Taylor M, Cox N, Littler R, Drewry J. 2017. Trends in soil quality monitoring data in the Waikato region 1995-2015. Waikato Regional Council Technical Report 2017/26.
- UNSCN. 2020. United National System Standing Committee on Nutrition - Recent News 31 July 2020 https://www.unscn.org/en/news-events/recent-news?idnews=2039.
- Vogeler I, Cichota R, Beautrais J. 2016. Linking Land Use Capability classes and APSIM to estimate pasture growth for regional land use planning. Soil Research. doi:10.1071/SR15018.
- Vogeler I, Vibrat R, Mackay A, Dennis S, Burggraaf V, Beautrais J. 2014. Modelling pastoral farm systems — scaling from farm to region. Science of the Total Environment. 482-483:305–317.
- Waikato Regional Council. 2012. Waikato Regional Council Proposed Regional Policy Statement. Part B 14 Soils. http://www.waikatoregion.govt.nz/Council/Policy-and-plans/Regional-Policy-Statement/Regional-Policy-Statement-Review/Proposed_Regional_Policy_Statement/PART-B/14-Soils/Policy-142High-class-soils-/.
- Waikato Regional Council. 2013. Land and soil: monitoring and reporting. Rural Subdivision. https://www.waikatoregion.govt.nz/environment/land-and-soil/land-and-soil-monitoring/rural-subdivision-report-card/.
- Waikato Regional Council. 2018. Waikato Regional Policy Statement: Te Tauākī Kaupapahere Te-Rohe O Waikato. Waikato Regional Council, Hamilton: Policy 14.2 High class soils.
- Willett W, Rockström J, Loken B, Springmann M, Lang T, Vermeulen S, Garnett T, Tilman D, DeClerck F, Wood A, et al. 2019. Food in the anthropocene: the EAT–Lancet Commission on healthy diets from sustainable food systems. Lancet. 43:447–492.
- Zambon I, Benedetti A, Ferrara C, Salvati L. 2018. Soil matters? A multivariate analysis of socioeconomic constraints to urban expansion in Mediterranean Europe. Ecological Economics. 146:173–183.
Appendix
Figure A1. Distribution of Land Use Capability classes for selected areas in (A) Auckland, (B) Waikato (C) and Canterbury as per Table A1 – A. CBD denotes central business district.
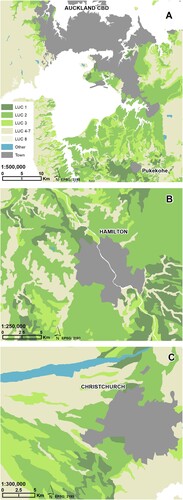
Table A1. National and regional baseline areas by Land Use Capability (LUC) class, pre and post selected modifications for years 2002 and 2019 (with proportions in parentheses).
Table A2. Proportion of urban area and parcel size classes with a dwelling in 2019 by Land Use Capability (LUC) classes.