
 ?Mathematical formulae have been encoded as MathML and are displayed in this HTML version using MathJax in order to improve their display. Uncheck the box to turn MathJax off. This feature requires Javascript. Click on a formula to zoom.
ABSTRACT
Edge-of-field mitigations (EoFM) can reduce agricultural nutrient losses to surface water. To determine the feasibility and cost-effectiveness of EoFM, we developed a spatial–economic modelling approach and applied it in the Waituna Lagoon Catchment (Southland, New Zealand) to evaluate reductions in nitrogen (N) and phosphorus (P) loads, utilising three EoFMs: constructed wetlands, woodchip bioreactors and aluminised zeolite filters. Cost-effectiveness per targeted nutrient was calculated using a strategy that considers nutrient reduction potential and implementation costs of EoFM across all farms (catchment-collective approach), and a strategy requiring each farm to mitigate individually using their most cost-effective EoFM mitigations (farm-based approach). Our modelling showed that the load received from potentially EoFM eligible sub-catchments is 46% and 27% for overall N and overall P load, respectively. EoFM can achieve substantial reductions using a catchment-collective approach (max. 24% overall N load; max. 15% overall P load), but cannot on their own provide the reductions required to achieve the desired outcome (59% overall N and 53% overall P load). Catchment-collective approaches for EoFM placement become more cost effective than farm-based approaches when larger nutrient reductions are required (N >33%; P >30%; N&P combined load >16%, based on the received load from potentially EoFM eligible subcatchments).
Introduction
Eutrophication of freshwater systems due to increases in plant nutrients nitrogen (N) and phosphorus (P) is a persistent global problem affecting environmental, social, economic and cultural values of our water resources (e.g, Foley et al. Citation2005; Howarth Citation2008; Wurtsbaugh et al. Citation2019). The main sources of nutrients are diffuse losses from land-use activities such as agriculture, and/or point sources of urban and industrial wastewater (e.g. Novotny Citation2003; Vilmin et al. Citation2018). High concentrations of nutrients can increase the likelihood of excessive algal production, water column hypoxia and loss of biodiversity in downstream receiving water bodies (e.g. Makarewicz et al. Citation2007; Weijters et al. Citation2009; Díaz and Rosenberg Citation2011).
Agriculture in New Zealand (NZ) intensified markedly between ∼1990 and 2015, with the expansion of dairy farming in particular (MacLeod and Moller Citation2006; PCE Citation2015; Snelder et al. Citation2018). Over this period, the area of land used for dairy production increased around 70% (from 1.0 to 1.7 million ha) and annual milk solids production increased more than threefold (from 0.57 to 1.75 M tonnes) (DairyNZ & LIC Citation2019). These numbers both reflect the areal expansion and the more intensive use of existing dairyland. Pastoral agriculture now represents 38% of New Zealand’s total land area, supporting approximately 4.0 million beef cattle, 6.2 million dairy cattle, 25.7 million sheep and 0.8 million deer (Stats NZ Citation2020). Diffuse nutrient loads in runoff from agricultural land use have consequently increased, impacting water quality in New Zealand’s streams, rivers, lakes and estuaries (Gluckman et al. Citation2017).
Understanding the source and transport pathways of nutrients is required to support the selection of appropriate mitigation actions to reduce nutrient loading across different landscapes. Many studies focus on the effects of various on-farm good management practices (GMP), like optimising fertiliser placement to match crop nutrient uptake efficiency, maintaining soil phosphorus levels at the agronomic optimum, reducing runoff from critical source areas, the use of feed pads (i.e. off pasture infrastructure) and improving the disposal of farm dairy effluent to land (e.g. Baligar et al. Citation2001; Monaghan et al. Citation2021).
In addition to these preventive farm system mitigations (FSM), considerable effort has focused on methods that intercept and reduce contaminant loads before they enter adjacent surface water bodies. These methods are referred to as edge-of-field mitigations (EoFM) and include: constructed treatment wetlands (Tanner and Sukias Citation2011; Kadlec Citation2012; Crumpton et al. Citation2020), riparian buffers (Jaynes and Isenhart Citation2019; Stutter et al. Citation2019; Vidon et al. Citation2019), peak run-off and detention structures (Marttila et al. Citation2010; Levine et al. Citation2021) and denitrifying bioreactors (Schipper et al. Citation2010; Christianson et al. Citation2012).
To meet the nutrient reduction targets, a combination of FSM and EoFM may be required. McDowell and Nash (Citation2012) state that the cost of removal of nutrients increases with mitigations further from the source, hence source control (preventative) FSMs are likely to be more cost effective. However, EoFM may be favoured by farmers, due to landscape fit and aesthetics (Bewsell and Brown Citation2009). Although EoFM options require land area and resources for implementation and maintenance, they can reduce nutrient loads while also delivering other ecosystem services (Stutter et al. Citation2019). For example, constructed wetlands and riparian buffers can provide biodiversity, biomass, nutrient extraction and downstream water temperature benefits (Kadlec Citation2012).
While there is some information on the overall cost-effectiveness of individual EoFM in New Zealand, a remaining key challenge is to optimise their placement within catchments and quantify their expected cumulative water quality benefits. EoFM placement optimisation has been tested at realistic scales in Britain and the USA (Tomer et al. Citation2015; Vinten et al. Citation2017), however, most still require in-field assessment and/or intensive manual data processing (Correll Citation2005; Carty et al. Citation2008; Schipper et al. Citation2010). Automated EoFM placement optimisation would aid water resource managers to determine the most optimal nutrient reduction plans under the set limitations and determine its cost.
This paper aimed to design and test a systematic modelling approach for: (1) selecting optimal locations for EoFM in agricultural catchments; (2) determining the most cost-effective EoFM option from the individual farmer’s perspective and (3) determining the most cost-effective options from the catchment-collective perspective. In a catchment-collective perspective (catchment-collective approach), the cost-effectiveness per targeted nutrient is calculated on a strategy considering nutrient reduction potential and implementation costs between farms, whereas under an individual farmer’s perspective (farm-based approach) a strategy is used requiring all farms to select the most cost-effective EoFM for each potential EoFM site per targeted nutrient and implement them consecutively to meet the nutrient reduction required. A farm-based approach can be regarded as a ‘blanket’ approach to EoFM placement based on site characteristics, often used by Regional Councils as it is easier to implement and considered more equitable. The targeted nutrient is varied by mitigation to reduce (1) combined N and P loads (focus N&P), (2) solely the N load (focus N) and (3) solely the P load (focus P). The most cost-effective mitigation options are derived under the set limitations of the EoFMs considered, their characteristics (e.g. placement, efficacy and costs) and landscape topography. This study thereby takes a spatial and economic approach to determine the most cost-effective mitigation options based on a continuous scale of catchment-wide nutrient reduction shown in an abatement curve. We hypothesise that such an approach can support the allocation of resources for on-farm mitigation of nutrient losses from agricultural catchments and that a catchment-collective approach for EoFM placement allows for a better optimised resource allocation in comparison to a farm-based approach.
We focused on the agricultural catchment that drains to the Waituna Lagoon, in Southland, New Zealand. In this case study, we considered three EoFMs; constructed wetlands, woodchip bioreactors and zeolite filters, as these mitigations had previously been assessed as potentially suitable for application in this area (Tanner et al. Citation2013; McKergow et al. Citation2015; Hudson et al. Citation2017; Hudson et al. Citation2019) and as these mitigations target N and/or P as these nutrients are overallocated in this catchment (Lagoon Technical Group for Environment Southland Citation2013). The methodology developed for this case study could also be applied to assess a broader range of EoFMs (e.g. Tanner et al. Citation2020). Our methodology makes use of an existing lumped, steady-state water quality model (Van den Roovaart et al. Citation2014; time period : mid-2012 to mid-2013, quarterly timestep ; hydrology input : WFLOW rainfall-runoff model with kinematic wave, 25 × 25 m spatial resolution, 1 d timestep) that estimates land parcel-based nutrient input, in-stream attenuation, and nutrient loads to the lagoon. We spatially defined topographical run-off and shallow groundwater flow catchments to find locations within farming land parcel boundaries suitable for EoFM placement. We then use this to determine likely load removal and implementation and maintenance costs of placing the considered EoFMs. Based on this information, EoFMs are ranked leading to a nutrient abatement cost curve based on cost-effect EoFM placement prioritisation in the catchment. This abatement cost curve is produced for both the farm-based approach as the catchment-collective approach.
Materials and methods
Catchment characteristics
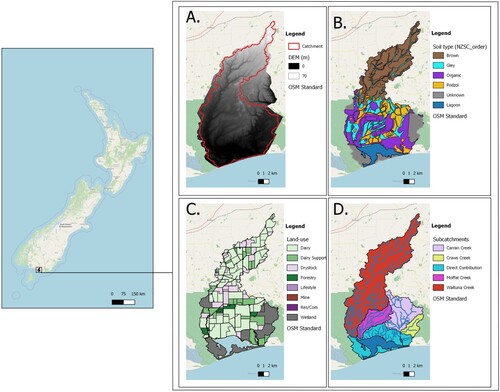
Waituna Lagoon in Southland, New Zealand, is internationally classified as an ICOLL – Intermittently Closed and Open Lakes and Lagoons. The lagoon is located in the Awarua wetlands, which is part of the Ramsar Convention since 1976. The lagoon is separated from the sea by a sand barrier that is intermittently opened to manage lagoon water levels and the effects of flooding in the lower catchment (approx. once per year). The lagoon is fed by three major tributaries: Waituna Creek, Moffat Creek and Carran Creek (), and combined with smaller tributaries has a total watershed area of 20,000 ha, of which the lagoon and surrounding wetland occupy 3500 ha (McDowell et al. Citation2016). Dairying (i.e. pasture-grazed dairy cows; 48% of catchment), drystock (e.g. sheep, beef cattle; 12%) and dairy support (e.g. winter grazing crops for dairy cows; 12%) make up more than 70% of the total catchment land area (Van den Roovaart et al. Citation2014). The soils present in the catchment are predominantly brown soils upstream, a mixture of organic, gley and podzol in the middle catchment, and mostly organic soils in the downstream area (S-MAP NZ digital soil database: Manaaki Whenua – Landcare Research Citation2019). Catchment topography is gently undulating to flat with a difference in elevation of approximately 65 meters (McDowell et al. Citation2016). Mean annual rainfall is 1050 mm, mean evaporation 772 mm and mean temperature 9.5°C (Macara Citation2013; McDowell et al. Citation2016). Artificial drainage using tile or mole-pipe drains is widely applied to enhance and protect agricultural production (Monaghan et al. Citation2005; McDowell et al. Citation2016), particularly in the middle and lower half of the catchment, where soils are less permeable and groundwater levels higher.
Figure 1. Overview of the spatial location of the Waituna Lagoon Catchment (Southland, New Zealand) and spatial data used to establish EoFM feasibility. Shown are the DEM (A), soil type (B), landuse (C) and contributing creeks (D).
Nutrient load
In 2013, a technical advisory group tasked with reviewing the state of declining water quality in the Waituna lagoon recommended that annual catchment nutrient loads be reduced to <125 tonnes per year for N and <7.7 tonnes per year for P, to prevent further degradation and improve lagoon ecological condition (Schallenberg et al. Citation2017). Using a catchment-wide water quality model, Van den Roovaart et al. (Citation2014) estimated the catchment nutrient loads to the Lagoon calculated for the years 2012–2013 (attenuated load to lagoon: ∼302 tonnes N per year and ∼16.5 tonnes P per year). Based on these model results, an approximate reduction of >59% of the total catchment N load and >53% of the total catchment P load would be required over time to meet these targets. Van den Roovaart et al. (Citation2014) calculated the nutrient load using a water quality model that assesses the fate and transport of catchment N and P loads based on input per land parcel. This land parcel-based data was used in this study to determine the nutrient load draining to potential EoFM placement locations. In Van den Roovaart et al. (Citation2014), the agricultural sources of N and P were calculated annually using OVERSEER (Wheeler et al. Citation2006) and distributed seasonally based on measured nutrient loads in the Waituna Creek. Non-agricultural sources were assumed to be constant over the year.
EoFM options
Three EoFM options were considered to be most feasible for implementation in the Waituna Lagoon catchment; constructed wetlands for N and P removal, woodchip bioreactors for denitrification of nitrate-N and modified zeolite filters for binding phosphate-P using a commercially available aluminised zeolite product (Aqual-PTM, Blue Pacific Minerals, Tokoroa, New Zealand). The EoFM considered in this study are used for the treatment of runoff, shallow groundwater flow and/or subsurface artificial drainage before the effluent is released to surface water.
Nutrient reduction efficiency results from an in-field trial with a woodchip bioreactor, an in-field trial with a zeolite filter and a wetland modelling study (Tanner et al. Citation2013; McKergow et al. Citation2015; Hudson et al. Citation2017; Hudson et al. Citation2019) are applied in this study. The EoFM considered were a 3% relative to catchment area proportionally sized constructed wetland (3% wetland), a 5% proportionally sized constructed wetland (5% wetland), and a proportionally sized woodchip bioreactor (woodchip bioreactor) or modified zeolite filter (zeolite filter) based on field trial dimensions (woodchip bioreactor: 0.11%; zeolite filter: 0.07%; see for more details).
Spatial catchment classification tool
Suitable EoFM locations were determined using an automated, spatial on-farm-catchment classification tool developed specifically for this study. This tool defines potential EoFM locations using a combination of Python (van Rossum and Drake Citation1995) and GRASS GIS (Neteler et al. Citation2012) routines based on a masked Digital Elevation Map (DEM) layer to determine on-farm-catchments based on the watershed algorithm (Ehlschlaeger Citation1989) and likely flow pathways. An on-farm-catchment is classified as having an outflow location to surface water (first or higher order stream) located within a farming land-use land parcel. The upstream area of these on-farm-catchments is not limited by farm boundaries and can thereby cross multiple land parcels. The characteristics for each on-farm-catchment consist of farm/land use, area drained, potential wetland (re)construction area and potential bioreactor/filter placement locations and presence of tile drainage. Bioreactor and filter placement locations were located at the outflow location of the on-farm-catchment and placement is only considered when tile drainage is present (see ). All mitigations are placed centralised in an on-farm catchment, making the mitigations mutual exclusive. These characteristics are used to estimate the nutrient load received and removal efficacy of each EoFM.
Table 1. Estimated proportion (%) of N and P loads intercepted by different EoFM devices in on-farm catchments with and without tile drainage based on nutrient losses in drainage in a nearby catchment (Monaghan et al. Citation2016) and using the upper limit of a EoFM efficiency study in Southland (Hughes et al. Citation2013). In Equation (1), these values are used as a factor, i.e. for wetlands this is 0.9 for tile drained and 0.5 for non-tile drained; and for other EoFM, it is 0 or 0.9.
A DEM layer (obtained from Environment Southland) aggregated to a 5 × 5-m scale was used to reduce computational load. A mask consisting of a 2-km buffer around the property was used to limit the DEM extent to reduce computational time, based on the assumption that on-farm-catchments are not expected to extend further than 2 km in radius from the land parcel boundary where the outflow to surface water is located. Surface water was defined based on shapefiles available through the Land Information New Zealand (LINZ) data service (LINZ Citation2020a, Citation2020b). For each on-farm catchment, drainage properties and land-use type were derived from land-use information from Environment Southland (Rutledge et al. Citation2016), which was updated with 2013 farm survey data collected by DairyNZ.
We limited our assessment of suitable on-farm catchments to those with a minimum catchment area of 5 ha (≥5 ha catchments), as we expected that smaller catchments provide a limited benefit relative to mitigation costs. Using the Fuzzy Landscape Analysis GIS method (FLAG, Roberts et al. Citation1997; Summerell et al. Citation2004), potential sites for constructed wetlands and their contributing catchment areas were determined. This method assessed low-lying areas based on the shape and curvature of the landscape provided by a DEM, originally developed to determine likely waterlogged areas. The FLAG method’s main assumption is that the water table follows the topography of the landscape. For potential sites for constructed wetlands to be considered they needed to be located at the centralised outflow location of the on-farm catchment, hence being able to capture the complete upstream load.
There is no central registration system to record the presence and location of tile drains for the Waituna Lagoon Catchment. Tile drainage strongly impacts nutrient pathways (King et al. Citation2015; Williams et al. Citation2015; Monaghan et al. Citation2016) and it was, therefore, necessary to estimate the presence of tile drainage. To do this, we assumed based on expert advice (Dr. Ross Monaghan, pers. comm. 2017) that where more than 30% of an on-farm-catchment is a low slope area (<4°), based on the DEM layer, and consists of poorly- or imperfectly-drained soils (namely, relevant soil types of the Organic, Brown or Gley soil orders within the catchment), the whole on-farm-catchment was classified as tile drained. The soil layer was sourced from SMAP (Landcare Research Citation2019).
Estimating load reductions from EoFM placement on farming land
Nutrient load reduction potential by the implementation of an EoFM is dependent on the nutrient load draining from the on-farm catchment. In this study, nutrient load was calculated based on the geometric contribution of each land use and farm-type land parcel to the specific on-farm catchment, where the contribution of nutrients by the land parcel to the Waituna Lagoon Catchment is based on the load input from the water quality model (Van den Roovaart et al. Citation2014). Wetland and filter/bioreactor placement locations are all near the centralised outflow of the on-farm-catchment and therefore it was assumed that when placing these mitigations could potentially capture the entire load of the on-farm-catchment for treatment.
The fate and transport of nutrients are highly affected by the presence of artificial drainage which by-passes natural soil attenuation processes (Skaggs and van Schilfgaarde Citation1999; Monaghan et al. Citation2016). The partitioning of the N and P load reaching the EoFM by tile drain, overland flow and subsurface flow was estimated based on the results of a comprehensive study of nutrient losses in drainage in a nearby catchment by Monaghan et al. (Citation2016; ) and the upper limit of an EoFM efficiency study in Southland by Hughes et al. (Citation2013). For constructed wetlands, an on-farm-catchment with or without tile drainage results in the fraction of N load delivered to the wetland of 50% and 90% and the fraction of the P load of 100% and 90%, respectively. We assume woodchip bioreactors and zeolite filters to be EoFM designed to only intercept (and treat) subsurface drainage. Therefore these mitigations are only considered applicable to tile-drained farm catchments, where they were estimated to intercept 90% of the N and P load (). The estimates for the load exported through run-off and artificial drainage are specific to the Waituna Lagoon Catchment area and are high when compared to load export values measured elsewhere (Barkle et al. Citation2021, TN : 9.2–22.1%, Tatuanui and Waharoa). The influent load to the constructed wetland was then determined using Equation (1):
(1)
(1)
where:
Linfl = Influent load to the EoFM (kg N or P/year);
Lcatch = Load draining from the on-farm-catchment (kg N or P/year);
T = Indication if on-farm-catchment is expected to contain tile-drains (binary, yes (1) or no (0));
Ptiled = EoFM-specific capturing of the load when tile drains are present (fraction, );
Puntiled = EoFM-specific capturing of the load when tile drains are absent (fraction, ).
The effectiveness of both the EoFM constructed wetland and woodchip bioreactors was mainly dependent on seasonality, as a change in flow and temperature alters nutrient treatment potential ( and ). We used a percentage removal rate instead of a fixed removal rate derived from the field trial values as this allows us to scale mitigations to other on-farm catchments. Woodchip bioreactors were assumed not to mitigate significant amounts of P. The effectiveness of modified zeolite filters depended on the proportion of the P load presents as dissolved reactive phosphorus (DRP), which is altered by hydrology and hydrochemistry (e.g. presence of Fe) (Hudson et al. Citation2017). Although zeolite-based P filters have the potential to adsorb ammonium-N from drainage flows (Nguyen and Tanner Citation1998), this was not considered in the present study as this only constitutes a small fraction of the N normally exported from pastoral agriculture in New Zealand. The removed nutrient load by each EoFM device was calculated using Equation (2):
(2)
(2) where
Lrem = Removed load by EoFM (kg N or P/year);
Li = Influent load EoFM for season i (kg N or P/year derived by Equation 1);
Ri = Reduction factor EoFM for season i (fraction, and , for N and P, respectively);
Table 2. Seasonal nitrogen load reductions (% of influent load removed) by EoFM devices.
Table 3. Seasonal phosphorus load reductions (% of influent load removed) by EoFM devices.
i = One of four seasons, winter, spring, summer or autumn.
Estimating EoFM cost
The costs associated with constructed wetlands are presented as annualised costs comprising construction, maintenance and the investment rate. The construction costs for constructed wetlands were based on New Zealand estimates scaled according to Kadlec and Wallace (Citation2009) for wetlands larger than 1 ha, and corresponded well with costings undertaken independently by an experienced agricultural engineer (detailed in Tanner et al. Citation2015). The maintenance costs account for periodic checking of inlets and outlets, and clearance of any blockages; checking structural integrity of any embankments, dams and high-level overflow; weed management around the wetland; and maintenance of gates and fences. Without dredging and biomass harvesting of treatment wetlands, they become a P source over time, however, this has been incorporated in the life span of the mitigation. The maintenance cost is approximated on a base cost of $300/ha (for wetland >1 ha).
The costs of the woodchip bioreactor and modified zeolite filters considered are based on an experimental setup in the Waituna Lagoon Catchment and thereby potentially higher than a non-experimental setup (McKergow et al. Citation2015; Hudson et al. Citation2017). The costs of both the woodchip bioreactor and modified zeolite filter were based on the assessment by an experienced agricultural engineer (Tanner et al. Citation2015).
For each mitigation type, an investment opportunity cost of 8% was added to account for the cost of capital. In our model, the costs were separated based on design and bringing in material and equipment to the construction site (initial costs), the used material and manual labour (construction costs), costs for repairs and maintenance (maintenance costs) and an investment opportunity cost (cost of capital). The associated costs for EoFM and their estimated lifetime are summarised in and .
Table 4. Price of EoFM by size of device. In Equation (3), mitigation cost is used on m2 basis, but costs are shown based on the field-trial size as the relative efficiency by size varies greatly between these mitigations. Sources are McKergow et al. (Citation2015) and Tanner et al. (Citation2013) updated to 2017. The difference between these costs has been explained in Section 2.6.
Table 5. Price of EoFM as shown in translated to price per ha of contributing catchment. Only the costs that vary per EoFM size are shown.
For all EoFM options, no allowances were made for potential positive economic gains from mitigation construction; for example via increased land value, enhanced aesthetic, associated tax deductions or subsidies. Additionally, the loss of potential income by land occupied by the mitigation was not taken into account, as we assume that the construction will take place on land with low productivity.
Based on the costs listed in , the annual cost per EoFM is calculated using Equation (3):
(3)
(3) where
Cmit = annual cost of EoFM (NZD/year);
Cint = Initial cost of EoFM (NZD, derived from );
Cconstr = Construction cost of EoFM (NZD/m2, derived from );
Cmaint = Maintenance cost of EoFM (NZD/year/m2, derived from );
Smit = Size of EoFM (m2);
D = Depreciation time of the EoFM (years, );
I = Investment rate (fraction, set to 0.08 (8%)).
Using the output of Equations (2) and (3), the cost per kg of nutrient removed was calculated for each EoFM type. This was done by dividing the annual removed nutrient load (Equation 2) with the annual EoFM cost (Equation 3).
EoFM ranking
Using Equations (1–3), the potential nutrient load reduction and costs of implementation for the considered mitigations were calculated for all on-farm catchments larger than 5 ha. For each on-farm-catchment, all four EoFM options are considered, but only the best ‘single’ option can be applied for mitigation. By ranking the EoFM options per on-farm-catchment on their cost-effectiveness an abatement cost curve (Hart and Brady Citation2002; Beaumont and Tinch Citation2004; Doole Citation2012; Muller Citation2017) was determined for EoFM application which describes the cost of achieving a given level of nutrient loss mitigation. Using this cost-minimising abatement curve, the order of best cost-effective location of EoFM investment and type of EoFM was determined. This ranking is calculated for N and P removal costs by using Equations (4) and (5) in a dedicated R script (R Core Team Citation2014).
The abatement curves were determined using two approaches, primarily operating at two scales. The farm-based approach was focused on selecting the most cost-effective mitigation for each individual on-farm catchment. In this approach, the most cost-effective mitigation for N reduction is chosen by sorting the cost price per kg N reduced for all four EoFM options, starting with the lowest cost price, and omitting non-nitrogen mitigating EoFM (phosphorus filter), non-applicable EoFM (i.e. bioreactors/filters due to absence of tile drain, wetlands due to missing of suitable area) and lesser effective EoFM. This procedure was performed per on-farm catchment and the same procedure is used to determine the most cost-effective EoFM for reducing P. When both N and P are of equal importance to mitigate, a proxy is derived to determine the combined reduction of N and P load for the Waituna Lagoon Catchment by the EoFM, as shown in Equation (4):
(4)
(4) where
Cperc = Cost per percentage load reduction of N and P (NZD/%);
Cmit = Annual cost of EoFM (NZD/year);
Lcatchment = Load available for mitigation with EoFM in the entire catchment for N and P (kg/year);
lrem = Potential load removed by EoFM in on-farm-catchment for N and P (kg/year).
The catchment-collective approach was focused on optimising the cost-effectiveness at the scale of the entire catchment instead of each individual on-farm catchment. This approach considers that the implementation of mitigations was undertaken on a catchment scale with costs shared by all contributing landowners, allowing for a best ‘bang for buck’ for total load reduction, regardless of cost applied at the on-farm-catchment scale. In contrast to the farm-based approach, there is not a direct ranking order for the implementation of the most cost-effective EoFM per on-farm catchment based on a continuous scale of reduction, but mitigations in on-farm catchments can be re-assessed when a higher reduction threshold is set. To determine these alternative options, the marginal cost of nutrient reduction is calculated in relation to the better optimised EoFM of that specific on-farm catchment. The marginal cost in this case is the change in total costs in relation to the change in nutrient load mitigated that arises from choosing an alternative mitigation for that on-farm catchment. The comparison of alternative mitigations occurs in sequence, so the second-best option is compared to the best option and the third-best option is compared to the second-best option and so on. This comparison informs when the required nutrient reduction could require altering the mitigation choice for an on-farm catchment, because an alternative mitigation would be more cost effective on a catchment scale. For example, implementing a woodchip bioreactor on both on-farm-catchment A and B might, from a farmer’s perspective, be the optimal EoFM for each location. In this example the cost of placement is the same, however, based on the nutrient load reaching the EoFM, the removed nutrient load may be different. In this case, placing a wetland in on-farm catchment A and no mitigation in on-farm-catchment B may be more cost effective for nutrient load reduction from a catchment perspective, even though the overall costs are equal between both choices, the wetland in comparison treats a larger summed nutrient load. Hence, the mitigation placed on-farm-catchment A compensates for nutrient load reductions that cannot be achieved as cost effectively at on-farm-catchment B. This illustrates the potential catchment-collective benefit of implementing an alternative EoFM. By also considering the marginal cost of EoFM annual costs and marginal costs of removed loads from alternative mitigations, in addition to the annual costs and removed loads for the most effective mitigations a decision can be made on which mitigation to implement next. This mitigation might then be cost effective on a catchment scale to implement, but a less cost-effective mitigation from a farmer’s perspective. These marginal costs are derived by Equation (5). By using these catchment-scale annual costs and removed loads as input in Equation (4) this determines the cost per additional load reduction when N and P are both parts of the nutrient reduction objective.
(5)
(5) Emargin = Catchment-collective approach cost per additional load reduction by change to less cost-effective EoFM in on-farm catchment for N or for P (NZD/kg); a = Farm-based approach more cost-effective EoFM for on-farm catchment for N or P (–); b = Farm-based approach less cost-effective EoFM for on-farm catchment for N or P (–); Cmit = Annual cost of EoFM (NZD/year); Lrem = Potential load removed by EoFM for substance for N or P (kg/year).
Results
Spatial catchment results
A total of 4670 separate on-farm catchments comprising 13,800 ha (69%) of the Waituna Lagoon catchment were identified. Of these, 596 on-farm catchments were greater than 5 ha, accounting for 9400 ha (47%) of the total catchment area ().
Figure 2. Presence and characterisation of on-farm-catchments in the Waituna Lagoon Catchment. Per on-farm-catchment larger or equal to 5 hectares (ha), the outflow location, potential wetland area and presence of artificial drainage are shown. Inset 1 focusses on a larger than 5 ha artificially drained on-farm-catchment with a large potential wetland area near the outflow location. Inset 2 focusses on a larger than 5 ha on-farm-catchment area with no artificial drainage and a potential wetland area near the outflow location. The outflow locations are at first or higher order streams.
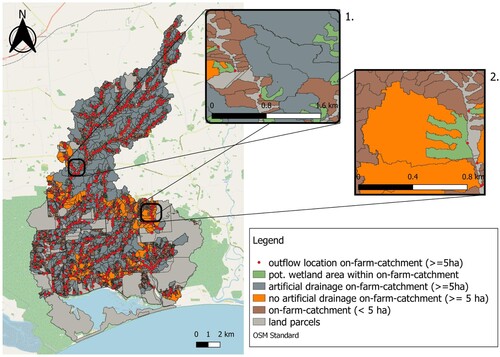
Most (90%) of the identified on-farm-catchments >5 ha were deemed to have a suitable area for constructed wetlands (median wetland area 1.15 ha, area range 0.15 ha to 10.55 ha, ) and 83% had sufficient area for a constructed wetland 5% or greater. The majority (81%) of on-farm-catchments >5 ha contained artificial drainage and were thereby considered potential for bioreactor and filter placement. A small number (<3%) of on-farm-catchments >5 ha did not have any mitigation potential (i.e. <3% of on-farm-catchment wetland area, no tile drainage).
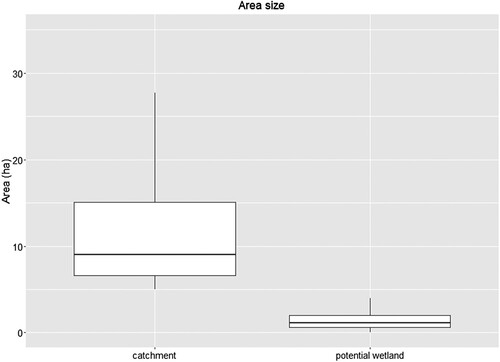
Figure 3. Boxplots showing the range of sizes for the on-farm-catchment area (catchment, selected for >5 ha) and available potential wetland area located in >5 ha on-farm-catchments (pot. wetland). On the boxplot, the middle line indicates the median, the upper box the 75 percentile, the lower box the 25 percentile, end of the top line the 95 percentile and end of bottom line 5 percentile.
EoFM cost ranges
As the cost of mitigations are related to catchment size and a fixed initial cost is applied per mitigation, catchment size decreases the cost of the mitigation per ha as shown in .
Figure 4. Price per hectare mitigated per EoFM for on-farm-catchments (selected for >5 ha). 3% wetland (orange), 5% wetland (red), woodchip filter (blue) and zeolite filter (black). The dots on the lines are on-farm-catchment sizes where potential EoFM can be applied based on location suitability in the Waituna Lagoon Catchment.
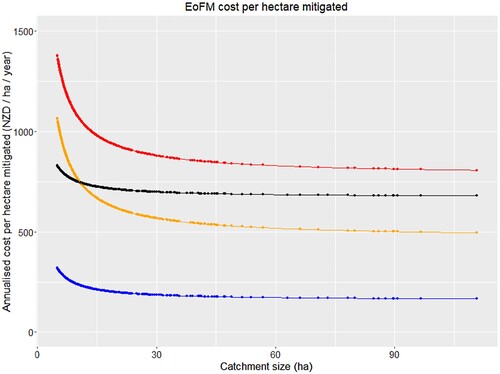
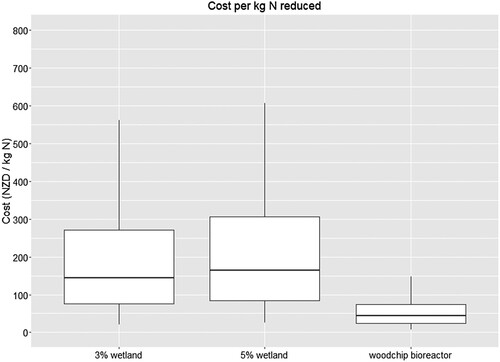
The median annualised cost per kg of N reduction for a 3% wetland is $140 NZD/year (25–75th percentiles: $76–$280 NZD/year) for applicable catchments, for 5% wetland $170 NZD/year (25–75th percentiles: $85–$320 NZD/year) and for woodchip bioreactors $44 NZD/year (25–75th percentiles: $24–$73 NZD/year) ().
Figure 5. Distribution of cost per kg N reduced for constructed wetland and denitrifying bioreactor EoFM when applied to applicable on-farm-catchments in the Waituna Lagoon Catchment. Outliers are omitted from the figure. On the boxplot, the middle line indicates the median, the upper box the 75 percentile, the lower box the 25 percentile, end of the top line the 95 percentile and end of bottom line 5 percentile.
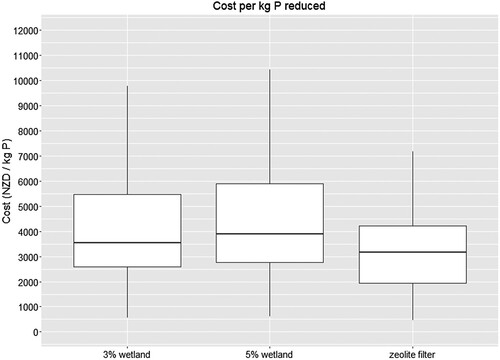
For P, the median annualised cost of reduction per kg for 3% wetland is $3700 NZD/year (25–75th percentiles: $2600–$5800 NZD/year) for applicable catchments, for 5% wetland $4100 NZD/year (25–75th percentiles: $2800–$6200 NZD/year) and for zeolite filters 3200 NZD/year (25–75th percentiles: $1900–$4200 NZD/year) ().
Figure 6. Distribution of cost per kg P reduced for each when applied to applicable on-farm-catchments in the Waituna Lagoon Catchment. Outliers are omitted from the figure. On the boxplot, the middle line indicates the median, the upper box the 75 percentile, the lower box the 25 percentile, end of the top line the 95 percentile and end of bottom line 5 percentile.
Establishment of cost abatement curves for EoFM
The estimated annual nutrient load coming from >5 ha catchments amenable to EoFM placement (i.e. 581 catchments) was 138.0 tonnes of N and 4.5 tonnes of P. This equates to 46% and 27% of the total N and P load, respectively, for the Waituna Lagoon catchment.
Applying the farm-based approach, with no preference for mitigating either N or P (focus N&P), the lowest cost combinations of investment in EoFM as a function of catchment load reduced are shown in (A). For this approach, the maximum mitigation of incoming load is reached at a combined N and P mitigation of 30%, with a 41% N reduction and 20% P reduction ($340 NZD per ha mitigated; $3.1M NZD total catchment cost), when 581 of the on-farm catchments comprise 261 of 3% wetlands, none with 5% wetlands, 308 with woodchip bioreactors and 12 with zeolite filters) ().
Figure 7. Optimal investment in EoFM based on farm-based cost-effectiveness approach (Farm) and catchment-based cost-effectiveness approach (Watershed) for N and P reduction of the received load for >5 ha on-farm-catchments in the Waituna Lagoon Catchment independent of EoFM used for mitigation. These abatement curves are shown with no preference for mitigating either N or P (A), mitigating with focus on N (B) and mitigating with focus on P (C). The dotted reference lines indicate the approach threshold when the farmer-based abatement curve becomes less cost effective on a catchment scale compared to the catchment-based abatement curve.
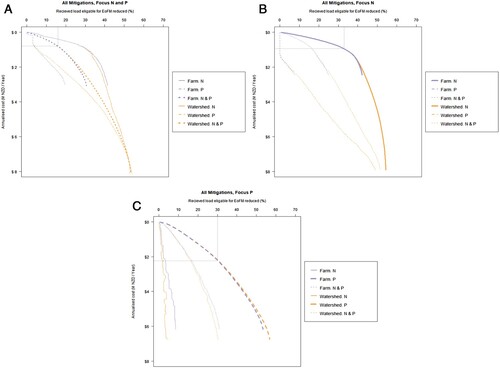
Table 6. Overview of abatement curve maximum for EoFM placement in the Waituna Lagoon Catchment. These results are assessed for an N & P, N and P focused mitigation placement strategy and a farm-based and catchment-collective cost-effective mitigation placement strategy. The approach threshold indicates when the farm-based approach becomes less cost-effective compared to the catchment-collective approach.
This same analysis of results was followed for the catchment-collective approach and the scenarios focusing on the reduction of N (focus N) and P (focus P) separately as shown in . The lowest cost combinations of investment in EoFM as a function of nutrient load reduction following the farm-based or catchment-collective approach with solely aiming at reducing N (focus N) is shown in (B) and for P (focus P) in (C). A visualisation of EoFM use based on the investment is shown for catchment-collective approach scenarios in .
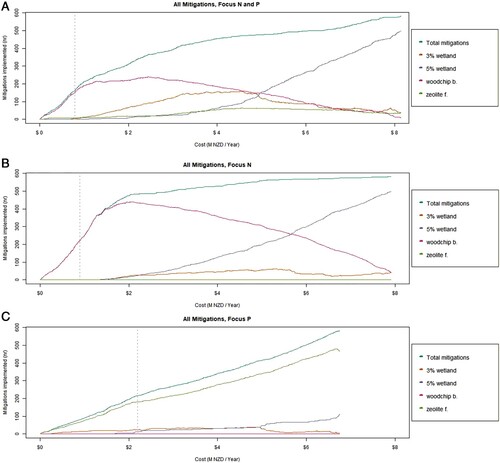
Figure 8. EoFM selection is based on a catchment-based approach for N reduction and P reduction in the Waituna Lagoon Catchment with focus on both nutrient loads (A), mitigation with focus on N (B) and mitigation with focus on P (C). The dotted reference lines indicate the approach threshold when the farmer-based abatement curve becomes less cost effective on a catchment scale compared to the catchment-based abatement curve.
When comparing the abatement curves in for the farm-based approach and the catchment-collective approach in all three scenarios (N&P mitigation, N mitigations and P mitigation) a moment of transition (approach threshold) can be seen when the catchment-collective approach becomes more cost effective on a catchment scale than the farm-based approach. The nutrient reduction values, costs and mitigation selection where this approach threshold takes place as shown in .
shows that while using the catchment-collective approach a change occurs in preferred mitigations for all scenarios. These changes in the mitigation strategies (exchanging of mitigations) all started after the approach threshold has been reached. When there is no preference for mitigating either N or P (focus N&P) mitigation is started with woodchip bioreactors (till approx. $3.2 M NZD/year), then changed out for 3% wetlands and 5% wetlands (till approx. $4.9 M NZD/year) and eventually both are taken over by 5% wetlands and to a lesser extent zeolite filters. When focusing on the reduction of N (focus N) mitigation is started with woodchip bioreactors (till approx. $2 M NZD/year) and slowly changed to 5% wetlands and to a lesser extent 3% wetlands. When focussing on the reduction of P (focus P) mitigation is started with zeolite filters and to a lesser extent 3% wetlands (till approx. $2 M NZD/year) after which in addition to mainly zeolite filters several 5% wetlands are added, eventually in exchange for 3% wetlands.
The results indicate that the maximum proportion of the total nutrient load from the Waituna Lagoon catchment mitigated by EoFM is 25% for nitrogen, which is based on EoFM removing 54% of the load coming from the >5 ha catchments. For phosphorus, the maximum reduction of the total catchment P load is 15% (57% reduction of load coming from >5 ha catchments). When both nutrients are mitigated simultaneously the N load reduced is 24% (53% reduction of load coming from the >5 ha catchments) and P load reduced is 15% (54% reduction of load coming from the >5 ha catchments).
Discussion
This study applied a flexible methodology to support a screening-level assessment of EoFM placement in an agricultural catchment using the Waituna Lagoon catchment in Southland as a case study. The assessment is comprised of three components: a spatial catchment classification tool that assesses the feasibility of EoFM placement in the wider catchment based on on-farm-catchment topographic characteristics, a farm-based approach for identifying EoFM selection based on cost-effectiveness, and a catchment-collective approach for assessing cost-effective EoFM placement at the whole of catchment scale. EoFM placement optimisation has been successfully tested at realistic scales before (Tomer et al. Citation2015; Vinten et al. Citation2017) and so have cost abatement curves for nutrient reduction (Doole Citation2012), but to our knowledge not based on spatial EoFM allocation while considering cross land parcel boundary on-farm-catchments and comparing the different outcome of a ‘blanket’ farm-based approach or a more sophisticated catchment-collective approach for cost-effectiveness.
This study suggests that based on the spatial catchment classification tool, the catchment has significant potential for EoFM placement with 47% of the catchment area draining to EoFM suitable locations with the potential to capture up to 46% and 27% of the overall catchment N and P load, respectively. These locations are generally suitable for all four EoFM options considered based on the dominance of artificial drainage in the catchment and suitable wetland area in the catchment. In total there are about 580 on-farm-catchments larger than 5 ha that can be mitigated with EoFM, suggesting significant potential based on the catchment characteristics.
There are some simplifications and limitations to our analysis. Our spatial methodology is based on the topography of the landscape to determine potential EoFM locations. Due to the resolution of the DEM small elevations and water barriers can be missed whereby on-farm-catchments are made larger, this can result in relatively flat and low-lying areas that the runoff direction is different from reality. The method does not take into account the geological soil structure which can divert groundwater flow and alter runoff. The presence of tile drains is currently based on assumptions as, historically, tile drains have not been systematically registered when they were applied in-field. These assumptions are supported by findings in Pearson (Citation2015) and Manderson (Citation2018), who present a more elaborate, but similar approach to determine both tile and surface drains for catchments in New Zealand. The proportion of tile drained, subsurface and overland flow were estimated based on expert advice. These estimates however are similar in order of magnitude to values reported in other scientific studies (King et al. Citation2015; Williams et al. Citation2015).
Based on these three scenarios applied (N, P, N&P), the largest nutrient load reduction is achieved by optimising EoFM placement using a catchment-collective approach. The largest N load reduction achieved was a 54% reduction of on-farm-catchment load (75 tonnes N per year; 25% of the overall catchment load) at an estimated cost of $7.9 million NZD annually. The largest reduction in P load was 57% (2.5 tonnes P per year: 15% of the overall catchment load) at an estimated cost of $6.8 million NZD annually. The largest combined load (N&P) reduction achieved was a 53% reduction of on-farm-catchment N load (74 tonnes N per year; 24% of the overall catchment N load) and a 54% reduction of on-farm-catchment P load (2.4 tonnes P per year; 15% of the overall catchment P load) with an estimated cost of $8.1 million NZD annually. When the scenarios are compared, similar nutrient reductions are achieved when an N&P focussed scenario is used rather than an N or P focus scenario alone, with a better value for money as both nutrients are reduced. However, when the objective is to reach the maximum N or P load mitigatable with EoFM placement, the N focus and P focus scenario should be used, respectively.
The catchment-collective approach allows for the largest nutrient reductions due to greater flexibility in EoFM placement relative to a farm-based approach, although this scenario does not reflect the most cost-effective mitigations from an individual farmer’s perspective. Up to a threshold of overall catchment nutrient reduction (N: >33%, P: >30%; N & P: >16%) the catchment-collective approach is like the cost-effectiveness of the farm-based approach, beyond, it becomes more cost-effective. This effect can be seen in the focus N&P and focus N scenarios, where under a certain pressure to mitigate, woodchip bioreactors are exchanged for more constructed wetlands at locations where both suitable wetland area and tile drainage is present in on-farm-catchments. Even though the woodchip bioreactor is more cost effective to mitigate N from a farmer’s perspective, constructed wetlands mitigate a larger load in comparison to placing woodchip bioreactors on less than optimal on-farm catchments. The results also suggest 5% wetland cannot compete in cost and P load reduction relative to the zeolite filter, as this shift in mitigations is not seen in the focus P scenario. This is also apparent from the cost of mitigation per hectare shown in , where the zeolite and 5% wetland cost per catchment size lines don’t intersect and from where the 5% wetland is not considered for the focus P scenario under the farm-based approach.
The costs, lifetime and efficiencies of EoFM used in this study are derived from field assessments and trials specific to the Waituna Lagoon Catchment (Tanner et al. Citation2013; McKergow et al. Citation2015; Hudson et al. Citation2017) and expert knowledge, however, the developed framework could easily be updated if more actual data became available. The lifetime of a field-scale woodchip bioreactor operating under fluctuating flows may have been overstated and could be closer to 15 years instead of the 20 years assumed in the present study. Woodchip bioreactors have in a recent study also been proven to remove substantial fractions of P from artificial drainage (up to 89% DRP removal; Rivas et al. Citation2020), this P removal was not considered in this study. In addition, the zeolite filter used in the field trials was a pumped system and thereby bypassed a varying proportion of the on-farm-catchment flow (Hudson et al. Citation2017). As was found in later assessment, the P concentrations in agricultural drainage water are often too low for effective removal by the modified zeolite filter media (Dr. Craig Depree, pers. comm., 2020). This has likely caused the load reduction rates for the modified zeolite filter to be overly optimistic. For wetlands, the summer and winter efficacy for nitrate-N reduction derived from Tanner et al. (Citation2013) were used for the periods spring & summer and winter & autumn, respectively, which likely led to an overestimation of nutrient load reductions. For 3% wetlands, this results in a 57% annual N removal in the present study, whereas Tanner et al. (Citation2013) predicted 36% annual N removal. The application of summer removal efficacies to spring thereby overestimated the annual N load reduction because of higher spring nitrogen loads (i.e. on average 30% of annual load in spring vs 20% in summer) and reduced wetland efficacy at lower spring water temperatures. The annual estimates are, however, still within the overall removal efficacies reported for N removal from wetlands (Tanner et al. Citation2010). All costs referenced reflect the year 2017, whereas the costs of wetlands have been derived as early as 2013/14. Inflation, however, has been relatively low over the intervening period, hence these costs are still found to be applicable.
With regard to the case study catchment, EoFM alone is unlikely to be sufficient to reach the recommended nutrient reduction targets for the Waituna Lagoon catchment, as in this study only half of the suggested N reduction and a quarter of the required P reduction can be mitigated with EoFM placement based on the maximum treatment achievable. As well, when the limits of reduction by EoFM are reached the cost increases substantially, as seen in . In addition to EoFM, additional mitigations can be sought in FSM (Wustenberghs et al. Citation2008; McDowell and Nash Citation2012), trans-property boundary mitigations as instream wetlands and riparian vegetation (Hill Citation1996) or land use change (McDowell et al. Citation2020). These latter mitigations were outside the scope of this study.
Conclusions
Our modelling shows that a large reduction can be made using the catchment-collective approach (max. 23% overall N load; max. 14% overall P load), but the required reductions cannot be reached solely with EoFM, meaning that other within-farm mitigations or land use change would be required. In addition, when larger nutrient reductions are required, a catchment-collective approach was more cost-effective than a farm-based approach in targeting where EoFM should be placed (N: >33%; P: >30%; N&P combined load: >16%, based on the received load from >5 ha on-farm catchments). Overall, this study highlights that, based on a case study application to the Waituna Lagoon Catchment in New Zealand, the model developed in this study is useful to compare abatement curves for required investment and nutrient reduction objectives. This methodology has potential to be applied in other agricultural catchments to determine investment strategies in EoFM for nutrient reduction and provide a useful tool for farmers and water resource managers to evaluate mitigation investment decisions.
Supplementary material
Download MS Word (33.7 KB)Acknowledgements
The modelling presented here was developed during a secondment of MPW to DairyNZ. The authors acknowledge the use of output from the Waituna Lagoon catchment water quality model, developed by Deltares and DairyNZ. We wish to express our appreciation for the valuable information on tile drainage provided Dr. Ross Monaghan (AgR); bioreactor/filter field-trial results by Dr. Lucy McKergow and Dr. Neale Hudson (NIWA); Dr. Craig Depree is thanked for improving the manuscript, Dr. Thomas W. Stephens for R support and Dr. Simon Groot for coordinating the secondment of MPW to DairyNZ which resulted in this study. We acknowledge and thank the Waituna farming community for background data used as input to these studies.
Disclosure statement
DairyNZ is funded by the New Zealand Dairy Industry via a levy on dairy farmers to invest in research, resource development, extension, and advocacy to promote sustainable dairy farming.
Additional information
Funding
References
- Baligar VC, Fageria NK, He ZL. 2001. Nutrient use efficiency in plants. Communications in Soil Science and Plant Analysis. 32(7–8):921–950.
- Barkle G, Stenger R, Moorhead B, Clague J. 2021. The importance of the hydrological pathways in exporting nitrogen from grazed artificially drained land. Journal of Hydrology. 597(August 2020):126218. doi:10.1016/j.jhydrol.2021.126218.
- Beaumont NJ, Tinch R. 2004. Abatement cost curves: a viable management tool for enabling the achievement of win–win waste reduction strategies? Journal of Environmental Management. 71(3):207–215.
- Bewsell D, Brown M. 2009. Involvement and decision making on-farm: the use of wintering feedpads and nitrogen inhibitors on dairy farms in New Zealand. Extension Farming Systems Journal. 5(2):81–90.
- Carty A, Scholz M, Heal K, Gouriveau F, Mustafa A. 2008. The universal design, operations and maintenance guidelines for farm constructed farm wetlands (FCW) in temperate climates. Bioresource Technology. 99:6780–6792.
- Christianson LE, Bhandari A, Helmers MJ. 2012. A practice-oriented review of woodchip bioreactors for subsurface agricultural drainage. Applied Engineering in Agriculture. 28(6):861.
- Correll DL. 2005. Principles of planning and establishment of buffer zones. Ecological Engineering. 24:433–439.
- Crumpton WG, Stenback GA, Fisher SW, Stenback JZ, Green DIS. 2020. Water quality performance of wetlands receiving nonpoint-source nitrogen loads: nitrate and total nitrogen removal efficiency and controlling factors. Journal of Environmental Quality. 49(3):735–744.
- DairyNZ, LIC. 2019. New Zealand dairy statistics 2018/2019. Hamilton, New Zealand.
- Díaz RJ, Rosenberg R. 2011. Introduction to environmental and economic consequences of hypoxia. International Journal of Water Resources Development. 27:71–82.
- Doole GJ. 2012. Cost-effective policies for improving water quality by reducing nitrate emissions from diverse dairy farms: an abatement-cost perspective. Agricultural Water Management [Internet]. 104:10–20. doi:10.1016/j.agwat.2011.11.007.
- Ehlschlaeger C. 1989. Using the AT search algorithm to develop hydrological models from digital elevation data. In: Proc Int Geogr Inf Syst Symp ‘89. Baltimore; p. 275–281.
- Foley JA, DeFries R, Asner GP, Barford C, Bonan G, Carpenter SR, Chapin FS, Coe MT, Daily GC, Gibbs HK, et al. 2005. Global consequences of land use. Science (80). 309(5734):570–574.
- Gluckman P, Cooper B, Howard-Williams C, Larned S, Quinn J. 2017. New Zealand’s fresh waters: values, state, trends and human impacts. Office of the Prime Minister’s Chief Science Advisor, Auckland, New Zealand.
- Hart R, Brady M. 2002. Nitrogen in the Baltic Sea—policy implications of stock effects. Journal of Environmental Management. 66(1):91–103.
- Hill AR. 1996. Nitrate removal in stream riparian zones. Journal of Environmental Quality. 25:743–755.
- Howarth RW. 2008. Coastal nitrogen pollution: a review of sources and trends globally and regionally. Harmful Algae. 8:14–20.
- Hudson N, Baddock E, McKergow L, Heubeck S, Tanner CC, Scandrett J, Burger D, Wright-Stow A, Depree C. 2019. Efficacy of a denitrification woodchip filter: three years of field trials. In: Nutrient loss mitigations for compliance in agriculture. In: L.D. Currie, C.L. Christensen, editors. Occasional Report No. 32. Palmerston North, New Zealand: Fertilizer and Lime Research Centre, Massey University; http://flrc.massey.ac.nz/publications.html.
- Hudson N, McKergow L, Baddock E, Scandrett J. 2017. Waituna Wetland – evaluation of nutrient mitigation options : Nitrogen and Phosphorus filters (Draft report 23 May 2017) [Internet]. Report for DairyNZ, NIWA, Hamilton, New Zealand. https://www.dairynz.co.nz/media/5795473/waituna-wetland_evaluatipon-of-nutrient-mitigation-options_nitrogen-and-phosphours-filters_niwa_2017.pdf.
- Hughes A, Semadeni-Davies A, Tanner C. 2013. Nutrient and sediment attenuation potential of wetlands in Southland and South Otago dairying areas. NIWA Client Report HAM-2013-016, March 2013 prepared for Pastoral 21 Research Group under contract to AgResearch.
- Jaynes DB, Isenhart TM. 2019. Performance of saturated riparian buffers in Iowa, USA. Journal of Environmental Quality. 48(2):289–296. doi:10.2134/jeq2018.03.0115.
- Kadlec RH. 2012. Constructed marshes for nitrate removal. Critical Reviews in Environmental Science and Technology. 42:934–1005.
- Kadlec RH, Wallace S. 2009. Treatment wetlands, 2nd ed. Boca Raton, FL: CRC Press.
- King KW, Williams MR, Macrae ML, Fausey NR, Frankenberger J, Smith DR, Kleinman PJA, Brown LC. 2015. Phosphorus transport in agricultural subsurface drainage: a review. Journal of Environmental Quality. 44:467–485.
- Lagoon Technical Group for Environment Southland. 2013. Ecological guidelines for waituna lagoon. Invercargill, New Zealand: Environment Southland.
- Landcare Research. 2019. S-map - New Zealand’s national digital soil map. [Internet]. https://smap.landcareresearch.co.nz/.
- Levine B, Sukias JPS, Tanner CC, Burkitt L, Paterson J, Horne D. 2021. The ability of detainment bunds to decrease surface runoff leaving pastoral catchments: investigating a novel approach to agricultural stormwater management. Agricultural Water Management. 243. doi:10.1016/j.agwat.2020.106423
- LINZ. 2020a. New Zealand River Centrelines (Topo, 1:50k) [Internet]. [accessed 2014 Jun 4]. https://data.linz.govt.nz/layer/50327-nz-river-centrelines-topo-150k/.
- LINZ. 2020b. New Zealand Drain Centrelines (Topo, 1:50k) [Internet]. [accessed 2014 Jun 4]. https://data.linz.govt.nz/layer/50262-nz-drain-centrelines-topo-150k/.
- Macara G. 2013. The climate and weather of southland. Hamilton, New Zealand: NIWA.
- MacLeod CJ, Moller H. 2006. Intensification and diversification of New Zealand agriculture since 1960: An evaluation of current indicators of land use change. Agriculture, Ecosystems & Environment. 115:201–218.
- Makarewicz JC, D’Aiuto PE, Bosch I. 2007. Elevated nutrient levels from agriculturally dominated watersheds stimulate metaphyton growth. Journal of Great Lakes Research. 33:437–448.
- Manderson A. 2018. Mapping the extent of artificial drainage in New Zealand. Hamilton, New Zealand: Maanaki Whenua:Landcare Research.
- Marttila H, Vuori K-M, Hökkä H, Järnsen J, Kløve B. 2010. Framework for designing and applying peak runoff control structures for peatland forestry conditions. Forest Ecology and Management. 260(8):1262–1273. doi:10.1016/j.foreco.2010.06.032.
- McDowell RW, Nash D. 2012. A review of the cost-effectiveness and suitability of mitigation strategies to prevent phosphorus loss from dairy farms in New Zealand and Australia. Journal of Environmental Quality. 41(3):680–693.
- McDowell RW, Norris M, Cox N. 2016. Using the provenance of sediment and bioavailable phosphorus to help mitigate water quality impact in an agricultural catchment. Journal of Environmental Quality. 45(4):1276–1285.
- McDowell RW, Pletnyakov P, Lim A, Salmon G. 2020. Implications of water quality policy on land use: A case study of the approach in New Zealand. Marine and Freshwater Research. 72(4):451–455.
- McKergow L, Tanner C, Baddock E, Pattinson P, Burger D, Scandrett J. 2015. The ‘nitrate catcher’ – design and installation of a bioreactor to monitor nitrate-N removal from drainage water [internet]. Prepared for DairyNZ and living waters. Hamilton, New Zealand: NIWA. https://www.dairynz.co.nz/media/5795471/the-nitrate-catcher-design-and-installation-of-a-bioreactor-to-monitor-nitrate-n-removal-from-drainage-water_niwa_2015.pdf.
- Monaghan R, Manderson A, Basher L, Smith C, Burger D, Meenken E, McDowell R. 2021. Quantifying contaminant losses to water from pastoral landuses in New Zealand. I. Development of a spatial framework for assessing losses at a farm scale. New Zealand Journal of Agricultural Research. 64(3):344–364. doi:10.1080/00288233.2021.1936572.
- Monaghan RM, Paton RJ, Smith LC, Drewry JJ, Littlejohn RP. 2005. The impacts of nitrogen fertilisation and increased stocking rate on pasture yield, soil physical condition and nutrient losses in drainage from a cattle-grazed pasture. New Zealand Journal of Agricultural Research. 48(2):227–240.
- Monaghan RM, Smith LC, Muirhead RW. 2016. Pathways of contaminant transfers to water from an artificially-drained soil under intensive grazing by dairy cows. Agriculture, Ecosystems & Environment. 220:76–88. doi:10.1016/j.agee.2015.12.024.
- Muller C. 2017. Modelling dairy farm systems: processes, predicaments and possibilities. In: L.D. Currie, L.L. Burkitt, editors. Occasional report No. 30. fertilizer and lime research centre. Palmerston North, New Zealand: Massey University; p. 1–15.
- Neteler M, Bowman MH, Landa M, Metz M. 2012. GRASS GIS: A multi-purpose open source GIS. Environmental Modelling & Software. 31:124–130. https://grass.osgeo.org/.
- Nguyen ML, Tanner CC. 1998. Ammonium removal from wastewater using natural New Zealand zeolites. New Zealand Journal of Agricultural Research. 41:427–446.
- Novotny V. 2003. Water quality: diffuse pollution and watershed management, 2nd ed. New York, NY: John Wiley & Sons.
- PCE. 2015. Water quality in New Zealand: land use and nutrient pollution- Update report. Parlimentory commissioner for the environment. Wellington, New Zealand.
- Pearson L. 2015. Artificial subsurface drainage in Southland. Invercargill, New Zealand.
- R Core Team. 2014. R: A language and environment for statistical computing. Viena, Austria.
- Rivas A, Barkle G, Moorhead B, Clague J, Stenger R. 2020. Nitrate Removal Efficiency and Secondary Effects of a Woodchip Bioreactor for the Treatment of Agricultural Drainage [Internet]. (32):1–10. http://flrc.massey.ac.nz/publications.html.
- Roberts BDW, Dowling TI, Walker J. 1997. FLAG : A Fuzzy Landscape Analysis GIS Method for Dryland Salinity Assessment [Internet]. Technical Report No. 8/97. CSIRO, Canberra, Australia. https://publications.csiro.au/rpr/download?pid=procite:9dc37c7e-7bb8-42ca-92da-896e88b64a8f&dsid=DS1.
- Van den Roovaart J, Meijers E, Goorden N, Burger D. 2014. Development of a water quality modelling framework for the Waituna Catchment [Internet]. Delft, The Netherlands: Deltares. https://www.dairynz.co.nz/media/5795468/development-of-a-water-quality-modelling-framework-for-the-waituna-catchment_deltares_2014.pdf.
- van Rossum G, Drake, Jr., FL. 1995. Python reference manual. Amsterdam, the Netherlands.
- Rutledge DT, Manderson AK, Lilburne L, Ausseil A-G, Belliss S, Price R. 2016. Methodology for a GIS-based Land Use Map for Southland : a review. Envirolink advice grant: ESRC274. Hamilton, New Zealand: Maanaki Whenua: Landcare Research.
- Schallenberg M, Hamilton DP, Hicks AS, Robertson HA, Scarsbrook M, Robertson B, Wilson K, Whaanga D, Jones HFE, Hamill K. 2017. Multiple lines of evidence determine robust nutrient load limits required to safeguard a threatened lake/lagoon system. New Zealand Journal of Marine and Freshwater Research. 51(1):78–95.
- Schipper LA, Robertson WD, Gold AJ, Jaynes DB, Cameron SC. 2010. Denitrifying bioreactors–An approach for reducing nitrate loads to receiving waters. Ecological Engineering. 36(11):1532–1543.
- Skaggs RW, van Schilfgaarde J. 1999. Agricultural drainage. Madison, Wisconsin, USA: American Society of Agronomy.
- Snelder TH, Larned ST, McDowell RW. 2018. Anthropogenic increases of catchment nitrogen and phosphorus loads in New Zealand. New Zealand Journal of Marine and Freshwater Research. 52:336–361.
- Stats NZ. 2020. Agricultural production statistics: June 2021 (final).
- Stutter M, Kronvang B, Ó hUallachaín D, Rozemeijer JC. 2019. Current insights into the effectiveness of riparian management, attainment of multiple benefits, and potential technical enhancements. Journal of Environmental Quality. 48(2):236.
- Summerell GK, Dowling TI, Wild JA, Beale G. 2004. FLAG upness and its application for mapping seasonally wet to waterlogged soils. Soil Research. 42(2):155–162.
- Tanner C, Sukias J, Burger D. 2015. Realising the value of remnant farm wetlands as attenuation assets. In: Occas Rep No 28. Palmerston North, New Zealand: Fertilizer and Lime Research Centre, Massey University; p. 1–9.
- Tanner CC, Hughes A, Sukias J. 2013. Assessment of potential constructed wetland sites within the Waituna Catchment. Report prepared for Environment Southland and DairyNZ [Internet]. Hamilton, New Zealand. https://www.dairynz.co.nz/media/5795469/assessment-of-potential-constructed-wetland-sites-within-the-waituna-catchment_niwa_2013.pdf.
- Tanner CC, McKergow LA, Goeller BC, Woodward KB, Sukias JPS, Craggs RJ, Matheson FE. 2020. The spectrum of edge-of-field to waterway mitigation options for nutrient management in farmed landscapes. In: Nutrient Management in Farmed Landscapes. Christensen CL, Horne DJ, Singh R, editors. Occasional Report No. 33. Farmed Landscapes Research Centre, Massey University, Palmerston North, New Zealand.
- Tanner CC, Sukias J, Yates CR. 2010. New Zealand guidelines: constructed wetland treatment of tile drainage. Hamilton, New Zealand: NIWA Information Series No. 74.
- Tanner CC, Sukias JPS. 2011. Multi-year nutrient removal performance of three constructed wetlands intercepting drainage flows from grazed pastures. Journal of Environmental Quality. 40:620–633.
- Tomer MD, Porter SA, Boomer KMB, James DE, Kostel JA, Helmers MJ, Isenhart TM, McLellan E. 2015. Agricultural conservation planning framework: 1. Developing multipractice watershed planning scenarios and assessing nutrient reduction potential. Journal of Environmental Quality. 44(3):754–767.
- Vidon PG, Weish MK, Hassanzadeh YT. 2019. Twenty years of riparian zone research (1997–2017): where to next? Journal of Environmental Quality. 48(2):248–260. doi:10.2134/jeq2018.01.0009.
- Vilmin L, Mogollón JM, Beusen AHW, Bouwman AF. 2018. Forms and subannual variability of nitrogen and phosphorus loading to global river networks over the 20th century. Global and Planetary Change. 163:67–85.
- Vinten A, Sample J, Ibiyemi A, Abdul-Salam Y, Stutter M. 2017. A tool for cost-effectiveness analysis of field scale sediment-bound phosphorus mitigation measures and application to analysis of spatial and temporal targeting in the Lunan Water catchment, Scotland. Science of The Total Environment. 586:631–641. doi:10.1016/j.scitotenv.2017.02.034.
- Weijters MJ, Janse JH, Alkemade R, Verhoeven JTA. 2009. Quantifying the effect of catchment land use and water nutrient concentrations on freshwater river and stream biodiversity. Aquatic Conservation: Marine and Freshwater Ecosystems. 19:104–112.
- Wheeler DM, Ledgard SF, Monaghan RM, McDowell RW, de Klein CAM. 2006. OVERSEER nutrient budget model—what it is, what it does. In: Implementing sustainable nutrient management strategies in agriculture. Occasional Report No. 19, Currie, L.D. and Hanly, J.A. (eds.) FLRC, Massey University, Palmerston North, New Zealand.
- Williams MR, King KW, Fausey NR. 2015. Contribution of tile drains to basin discharge and nitrogen export in a headwater agricultural watershed. Agricultural Water Management. 158:42–50.
- Wurtsbaugh WA, Paerl HW, Dodds WK. 2019. Nutrients, eutrophication and harmful algal blooms along the freshwater to marine continuum. WIRES Water. 6:e1373.
- Wustenberghs H, Broekx SKVH, Claeys D, Heygere DT, Hooghe DJ, Dessers R, Huysmans T, Lauwers L, Meynaerts E, Vercaemst P. 2008. Cost-benefit analysis of abatement measures for nutrient emission from agriculture. 12th Congr Eur Assoc Agric Econ EAAE. 2008(February):1–5.