
ABSTRACT
The current New Zealand greenhouse gas inventory predictions assume that dairy cows consume pasture only, but the use of supplemental feeds, including concentrates, on New Zealand dairy farms has increased greatly in recent decades. The objective of this study was to evaluate the effect of feeding graded levels of concentrates on methane (CH4) emissions in lactating dairy cows within a pastoral system. Early lactation dairy cows (n = 72) were allocated (n = 18 per treatment) to receive 0, 2, 4 and 6 kg dry matter (DM) of treatment concentrates per day during milking. The cows grazed pasture ad libitum and CH4 emissions were measured in the paddocks using automated emissions monitoring systems called ‘GreenFeed’. Gross CH4 emissions (g/d) were similar for cows across the four dietary treatments, while CH4 emissions intensity (g/kg fat and protein corrected milk production (FPCM) and milk solids production) linearly decreased with increasing concentrate inclusion in the diet (P < 0.02). The CH4 intensity decreased linearly (r2 = 0.42) and quadratically (r2 = 0.53) with increasing FPCM production.
Introduction
Enteric methane (CH4) emissions from ruminant livestock account for approximately 35% of New Zealand’s total greenhouse gas (GHG) emissions, and 73.1% of total agricultural emissions (MfE Citation2020). Currently, the calculation of enteric CH4 production from cattle in New Zealand assumes that cattle only consume a grazed ryegrass-based pasture. Furthermore, the current New Zealand specific CH4 emissions factor (g/kg dry matter intake; DMI), and updates, are based on measurements of CH4 in cattle fed pasture only (Jonker et al. Citation2017a; Pickering et al. Citation2021). However, the number of cows and amount of milk produced in low-input pasture-based systems (>90% home-grown feed) have drastically decreased in the last decade from about 55% to 25% of the total dairy cow population (DairyNZ Citation2019). During the same period, the number of dairy cows in higher-input systems (21% to 50% imported feed) has increased from about 10% to 30% of the total dairy cow population. A survey estimated that annual non-pasture feed intake on New Zealand dairy farms has increased from 4.2% of DMI in 1990–1991 to 18% of DMI in 2014–2015 (DairyNZ Citation2016). Eighty percent of the non-pasture feed DMI was silages, grains and other concentrates including palm kernel expeller. Based on the above information, it is likely that nationally approximately 18% of enteric CH4 production of dairy cows is produced from non-pasture feeds, and at individual dairy farms, this could be as high as 50% of enteric CH4 produced from non-pasture feeds. The objective of the current study was to evaluate the effect of feeding graded levels of concentrates on CH4 emissions in early lactation dairy cows within a pastoral system.
Materials and methods
The experiment was carried out with 72 early lactation dairy cows (Friesian × Jersey) that calved between 23 July and 28 August 2022 (average ± standard deviation, 512 ± 48 kg body weight; 4.1 ± 0.3 body condition score; 113 ± 17 days in milk; 185 ± 58 breeding worth; 223 ± 109 production worth). The study was carried out between early September and mid-November 2022 at Dairy Farm No. 4, Massey University, Palmerston North, New Zealand. The experiment adhered to the guidelines of the 1999 New Zealand Animal Welfare Act and the AgResearch Code of Ethical Conduct and animal manipulations were approved by the AgResearch Animal Ethics Committee (#288).
The 72 cows (4.0 ± 1.2 years of age) were blocked by parity [parity 2, n = 20; parity 3, n = 15; and parities 4-6, n = 12] and then each block was randomly assigned to four dietary treatments (n = 18 per treatment) to receive concentrate pellets at 0, 2, 4 and 6 kg dry matter (DM)/cow/day (CON, LOW, MED and HIGH, respectively). After the random allocation, the average days in milk and production worth breeding value were checked for each treatment group to ensure these were similar across treatments. The treatment concentrate pellets consisted of 30% barley grain, 15% maize grain, 10% wheat broll, 25% palm kernel expeller, 8% soya hulls, 7% soybean meal and 5% molasses (Denver Stock Feeds Ltd, Palmerston North, NZ). The cows received their respective allocation of concentrates equally divided into two meals during milking at approximately 0700 and 1500 h in a 28-bale rotary milking platform with an in-shed feeding system (Waikato Milking Systems, Hamilton, New Zealand) with an individual electronic ear tag reader to identify cows and ensure the correct allocation of concentrate pellets to each cow. Concentrate refusals were monitored and recorded during each milking. The in-shed feeder was calibrated weekly during the study and concentrate samples for analysis were collected.
The cows of all treatments grazed as one group on ad-libitum ryegrass-based pasture with a new strip provided after each milking. Pasture offer samples were collected twice weekly and pre- and post- grazing pasture mass were estimated using a F200 rising plate meter (FarmWorks, Feilding, New Zealand). The plate meter clicks (0.5 cm/click) were multiplied by 120 + 1000 to estimate pasture mass (i.e. November plate meter equation for New Zealand; DairyNZ Citation2008). The cows received ∼2 kg DM/cow pasture silage with mineral mix [368 g/cow/day; 1.3% microminerals mix (AquaTrace 5, Nutritech, Auckland, New Zealand), 82.8% calcium carbonate (Lime Flour, Revensdown, Christchurch, NZ), 5.2% magnesium oxide and 10.5% sodium chloride (Salt) (Ravensdown, Christchurch, New Zealand)] before afternoon milking (samples were collected weekly for later analysis). The cows were transitioned from the pre-trial diet to the treatments over 10 days, followed by a full diet adaptation period of 14 days before measurements started over a five week period. However, only measurements of the last two weeks were analysed because the training of cows to use the GreenFeed units before the measurement period was delayed due to wet field conditions and there were technical issues with one of the units for some periods during the first three weeks of measurements, both resulting in low visitation to the GreenFeed units.
The milk production was measured at each milking with in-line milk meters and samples for milk composition analysis were collected weekly (morning and afternoon) and analysed at Te Ohu Rangahau Kai (AgResearch, Palmerston North, New Zealand) using a Foss MilkoScan (Foss Electric, Hillerød, Denmark). The milk information was used to calculate the 4% fat and 3.3% protein corrected milk production (FPCM) as: FPCM (kg/d) = [0.337 + (0.116 × % fat) + (0.06 × % protein)] × milk production (kg/d) (CVB Citation2010).
Enteric CH4 measurements at pasture were conducted using two mobile GreenFeed head chamber units (GF) (C-Lock Industries, Rapid City, SD, USA) as described previously (Waghorn et al. Citation2016; Jonker et al. Citation2019). The units consist of a concentrate feeder controlled by an electronic ear tag reader and a gas flow measurement system placed on trailers that are moved with the herd. The concentrate feeder was set to release 7 feed drops per visit (∼34 g per feed drop) with 25 sec between feed drops to encourage the cow to stay in the unit for at least 2 min. The waiting time until the same cow could receive another feed allocation was set at 2 h. The concentrates used in the GreenFeed units were Alpaca and Llama pellets (Dunstan Nutrition, Hamilton, New Zealand) The gas sensors, whole system and concentrate feeder were calibrated weekly and pellet samples were collected at this time for later analysis. The Alpaca pellet intake from cows that visited the GreenFeeds frequently were 0.7, 0.6, 0.5 and 0.6 kg DM/day for CON, LOW, MED and HIGH, respectively.
After the study, pasture and silage samples were freeze-dried and treatment and Alpaca pellets were oven-dried at 65 °C for 48 h before being ground to pass a 1-mm screen. Pasture were samples analysed by NIRS at Massey Nutrition Laboratory (Palmerston North, New Zealand) and the other samples were analysed by wet chemistry (and NIRS to estimate organic matter digestibility) at Hills Laboratory (Hamilton, New Zealand). The metabolisable energy (ME) of the feeds was estimated based on equations from the Feed Standards for Australian Livestock; equation 1.12 for pasture and silage and equation 1.18B for both concentrates (CSIRO Citation1990). Treatment concentrates had a chemical composition of (as g/kg DM) 89 g ash, 22 g lipids, 115 g crude protein (CP), 293 g neutral detergent fibre (NDF), 164 g acid detergent fibre (ADF), 396 g starch and 11.0 MJ ME/kg DM. The average pre- and post- grazing pasture masses were 3812 ± 484 and 2464 ± 266 kg DM/ha, respectively, and the pasture contained (as g/kg DM) 129 g ash, 188 g CP, 443 g NDF, 267 g ADF, 92 g soluble sugars and 10 MJ ME/kg DM. The pasture silage contained (as g/kg DM) 234 g ash, 32 g lipids, 159 g CP, 347 g NDF, 218 g ADF 9.0 MJ ME/kg DM. Alpaca pellets contained (as g/kg DM), 95 g ash, 127 g CP, 15 g lipids, 473 g NDF, and 269 g ADF 9.7 MJ ME/kg DM.
Data from 47 cows that visited the GreenFeed units during the last 14 days of the trial were used for statistical analysis. The number of visits to the GreenFeed units were unequal on each day and each hour of the day. Therefore, the CH4 emissions for each cow (g/d) were modelled using a mixed model that included GreenFeed unit, day within cow and hour in the day as random effects with the ‘modelbased’ package in R version 4.3 (R Core Team Citation2023). Then, all data were analysed using the ‘predictmeans’ package in R version 4.3 (R Core Team Citation2023) with treatment (CON, LOW, MED and HIGH) as a fixed effect. The polynomial effect of treatment was checked by a permutation test. A multiple treatment comparison was performed on the modelling results with P-value adjusted by the ‘BH’ method (Benjamini and Hochberg Citation1995) and least square means are presented. The significance of mean differences was declared at P < 0.05.
Results and discussion
Gross CH4 emissions (g/d) were similar for cows across the four dietary treatments () indicating that the likely increase in DMI due to the additive effect of concentrate supplementation (Bargo et al. Citation2003) did not increase emissions as would be expected (Jonker et al. Citation2017a). However, Arndt et al. (Citation2022) also reported (in a meta-analysis) that gross emissions remained similar when changing the ratio of forage to concentrates in grazing dairy cows. The CH4 emissions observed in the current study were in the higher range than previously observed in early lactation cows fed fresh ryegrass-based pasture with or without supplementation (Jonker et al. Citation2017a, Citation2017b; Beck et al. Citation2022). This likely reflects the generous pasture allocation in the current study. This generous pasture allocation likely also explains why milk production parameters (FPCM and milk solids [MS]) were statistically similar between treatments, as the substitution rate of pasture by concentrates generally increases with increasing pasture allowance (Bargo et al. Citation2003). The extra FPCM production per kg treatment concentrates fed was 0.35, 0.55, 0.47 kg/d for LOW, MED and HIGH, respectively, which again was a relatively small response compared to the range of 0.06–1.36 kg milk/kg concentrates observed in the meta-analysis of Bargo et al. (Citation2003).
Table 1. Means for number of visitations to the GreenFeed emissions monitoring unit, milk production and methane (CH4) emissions of early lactation dairy cows fed 0, 2, 4 or 6 kg DM of treatment concentrates per day (CON, LOW, MED and HIGH, respectively).
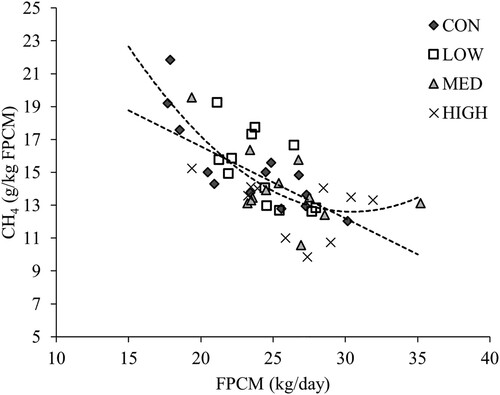
Although FPCM production only numerically increased by 0.7, 2.2 and 2.8 kg/cow/day for LOW, MED and HIGH, respectively, compared to CON, the CH4 emissions intensity (CH4, g/kg FPCM or MS) decreased linearly (P < 0.02) with increasing treatment concentrate inclusion in the diet, with CH4/FPCM tending to be 15% less in HIGH than in CON (P = 0.07). This is a similar reduction in CH4/FPCM to that reported in the meta-analysis of Arndt et al. (Citation2022) for grazing cows with concentrate supplementation and to that observed previously for early lactation dairy cows supplemented with 3 kg DM fodder beet bulbs per cow (Jonker et al. Citation2017b). The CH4/FPCM decreased linearly and quadratically with increasing FPCM production, which explained 53% of the variance in CH4/FPCM (), as has been reported previously (Gerber et al. Citation2011).
Figure 1. Relationship of fat and protein corrected milk production (FPCM) with methane (CH4) emissions intensity (g/kg FPCM) for early lactation dairy cows fed 0, 2, 4 or 6 kg DM of treatment concentrates per day (CON, LOW, MED and HIGH, respectively). Linear relationship: y = −0.4390x + 25.36 (r2 = 0.42; residual mean square error (RMSE) = 1.805); polynomial relationship: y = 0.0419×2 + −2554x + 51.53 (r2 = 0.53; RMSE = 1.602).
Implications, gross CH4 emissions remained similar as treatment concentrate inclusion increased by 2 kg DM increments from 0 to 6 kg DM day, while CH4 emission intensity (per kg FPCM and MS) linearly decreased with increasing treatment concentrate inclusion in the diet of early lactation dairy cows grazing ad libitum pasture. This suggests that under the conditions of the current study, the FPCM production per ha could be increased without increasing enteric CH4 emissions per ha. However, one would also need to consider that GHG emissions associated with concentrate production are double or more than that for pasture production (per kg feed DM) and nitrous oxide emissions also might be affected by concentrate supplementation (Ledgard et al. Citation2020). The GHG emissions and FPCM production responses ultimately will depend on the additive or substitutive effect of concentrate supplementation on the pasture intake, which is affected by pasture species, quality, height and mass; concentrates level and type; and cow genetic merit, production level and days in milk (Bargo et al. Citation2003).
Acknowledgements
Troy Bosher received a scholarship from AgResearch Limited, New Zealand for his MSc degree at Massey University. The authors thank the staff of Massey University Dairy Farm 4 for their help with the husbandry of the dairy cows during the study.
Disclosure statement
No potential conflict of interest was reported by the author(s).
Additional information
Funding
References
- Arndt C, Hristov AN, Price WJ, McClelland SC, Pelaez AM, Cueva SF, Oh J, Dijkstra J, Bannink A, Bayat AR, et al. 2022. Full adoption of the most effective strategies to mitigate methane emissions by ruminants can help meet the 1.5 °C target by 2030 but not 2050. Proceedings of the National Academy of Sciences. 119:e2111294119. doi: 10.1073/pnas.2111294119.
- Bargo F, Muller LD, Kolver ES, Delahoy JE. 2003. Invited review: production and digestion of supplemented dairy cows on pasture. Journal of Dairy Science. 86(1):1–42. doi: 10.3168/jds.S0022-0302(03)73581-4.
- Beck MR, Garrett K, Fleming AE, Maxwell TMR, Greer AW, Bunt C, Olejar K, Jonker A, Dynes R, Gregorini P. 2022. Effects of Lactobacillus fermented plant products on dairy cow health, production, and environmental impact. Animal Feed Science and Technology. 294:115514. doi: 10.1016/j.anifeedsci.2022.115514.
- Benjamini Y, Hochberg Y. 1995. Controlling the false discovery rate: a practical and powerful approach to multiple testing. Journal of the Royal Statistical Society: Series B (Methodological). 57:289–300.
- CSIRO. 1990. Feeding standards for Australian livestock. ruminants. Melbourne, Victoria, Australia: CSIRO Publications.
- CVB. 2010. ‘Centraal veevoeder bureau: tabellenboek veevoeding (Dutch feed table`s booklet CVB no. 49).’ (CVB: Lelystad, the Netherlands).
- DairyNZ. 2008. Using the rising plate meter (RPM). DairyNZ Farm fact 1-15, DairyNZ, Hamilton, New Zealand.
- DairyNZ. 2016. Feed use in the NZ dairy industry. A review of feed volumes consumed by New Zealand dairy cows since 1990-91, including future estimates to 2030-31. [accessed 2023 August 23]. https://www.mpi.govt.nz/dmsdocument/20897/direct.
- DairyNZ. 2019. 2018-19 Economic survey. [accessed 2023 August 23]. https://www.dairynz.co.nz/media/5793394/dairynz-economic-survey-2018-19.pdf.
- Gerber P, Vellinga T, Opio C, Steinfeld H. 2011. Productivity gains and greenhouse gas emissions intensity in dairy systems. Livestock Science. 139(1-2):100–108. doi: 10.1016/j.livsci.2011.03.012.
- Jonker A, Farrell L, Scobie D, Dynes R, Edwards G, Hague H, McAuliffe R, Taylor A, Knight T, Waghorn G. 2019. Methane and carbon dioxide emissions from lactating dairy cows grazing mature ryegrass/white clover or a diverse pasture comprising ryegrass, legumes and herbs. Animal Production Science. 59(6):1063–1069. doi: 10.1071/AN18019.
- Jonker A, Molano G, Koolaard J, Muetzel S. 2017a. Methane emissions from lactating and non-lactating dairy cows and growing cattle fed fresh pasture. Animal Production Science. 57(4):643–648. doi: 10.1071/AN15656.
- Jonker A, Scobie D, Dynes R, Edwards G, De Klein C, Hague H, McAuliffe R, Taylor A, Knight T, Waghorn G. 2017b. Feeding diets with fodder beet decreased methane emissions from dry and lactating dairy cows in grazing systems. Animal Production Science. 57:1445–1450. doi: 10.1071/AN16441.
- Ledgard SF, Falconer SJ, Abercrombie R, Philip G, Hill JP. 2020. Temporal, spatial, and management variability in the carbon footprint of New Zealand milk. Journal of Dairy Science. 103(1):1031–1046. doi: 10.3168/jds.2019-17182.
- MfE. 2020. New Zealand's Greenhouse Gas Inventory 1990-2018. [accessed 2023 August 23]. https://www.mfe.govt.nz/sites/default/files/media/Climate%20Change/new-zealands-greenhouse-gas-inventory-1990-2018-vol-1.pdf.
- Pickering N, Gibb J, Wear S, Fick J, Tomlin H. 2021. Methodology for calculation of New Zealand`s agricultural greenhouse gas emissions - Version 7. [accessed 2023 August 23]. https://www.mpi.govt.nz/dmsdocument/13906-detailed-methodologies-for-agricultural-greenhouse-gas-emission-calculation.
- R Core Team (2023). R: A language and environment for statistical computing. R Foundation for Statistical Computing, Vienna, Austria.
- Waghorn GC, Jonker A, Macdonald KA. 2016. Measuring methane from grazing dairy cows using GreenFeed. Animal Production Science. 56(3):252–257. doi: 10.1071/AN15491