
 ?Mathematical formulae have been encoded as MathML and are displayed in this HTML version using MathJax in order to improve their display. Uncheck the box to turn MathJax off. This feature requires Javascript. Click on a formula to zoom.
ABSTRACT
The lifetime productivity and efficiency of singleton- and twin-born ewe lambs born to one-year-old ewes were compared with twin-born ewe lambs born to mixed-age ewes. Romney ewe lambs either born as twins to mixed-age ewes (Heavier n = 135 and Control n = 135), or to one-year-old ewes as singletons (L1; n = 135) or twins (L2; n = 88) were included. The Heavier ewes weighed 47.9 ± 0.36 kg at ewe lamb breeding while Control ewes weighed 44.9 ± 0.38 kg. The lifetime number of lambs born and weaned, and the lifetime weight of lambs weaned were used to calculate both feed and ewe efficiency. Heavier ewes had greater lamb production as one-year-old ewes than L1, L2 and Control ewes, after which the yearly lamb production and efficiency did not differ between treatments. Heavier ewes had a greater lifetime number and weight of lambs weaned than L1 and L2 ewes but did not differ from Control ewes. The lower lifetime production of L1 and L2 ewes was driven by their low production as one-year-old ewes. Farmers, therefore, could select their replacements from ewes born to one-year-old ewes and have similar lamb production to ewes born to mixed-age ewes, providing they reach recommended pre-breeding live weights.
Introduction
Breeding ewe lambs at seven to nine months of age can have multiple advantages to sheep production systems. These include a greater number of lambs weaned per year and per ewe in her lifetime thus increasing profitability and productivity (Farrell et al. Citation2021; Young and Thompson Citation2021). It can also be used as a tool for early selection of replacement females (Edwards and Juengel Citation2017; Kenyon and Corner-Thomas Citation2022) thus potentially increasing the rate of genetic gain through increasing the selection pressure and a reduction in the generation interval (Edwards and Juengel Citation2017; Kenyon and Corner-Thomas Citation2022). In many farm systems, however, lambs born to ewe lambs are usually born a month later and are smaller and lighter at birth and weaning than those born to mature ewes (Corner et al. Citation2013). Combined, these can increase the difficulty in achieving the minimum target breeding live weight to allow for ewe lamb breeding (Kenyon and Corner-Thomas Citation2022) and may explain why farmers do not readily select them as replacement females (Kenyon Citation2012). Further, there is limited information on the lifetime performance of ewes born to one-year-old ewes.
Previous studies have shown that although both single- and twin-born ewe lambs, born to one-year-old ewes themselves, were lighter throughout their lifetime, the number of lambs they give birth to, wean, and their total litter weaning weight (WWT) did not differ from ewe lambs born to mixed-age ewes (Pettigrew et al. Citation2019). In their study, Pettigrew et al. (Citation2019) had a relatively low number of animals in each treatment, and ewe lambs born to one-year-old ewes were not bred until 18 months of age. Similar results were shown in a larger cohort of animals, that were bred for the first time as ewe lambs and followed over their first two years of production (Pettigrew et al. Citation2021). They showed that it was possible for ewe lambs born to one-year-old ewes to reach the minimum target breeding live weight of 39 kg at the start of breeding at approximately seven months of age (Pettigrew et al. Citation2021). There is, therefore, a potential gain in ewe efficiency through a greater weight of lamb weaned per unit of maternal weight. There is, however, limited information investigating the efficiency over a ewe’s lifetime.
A major driver of ewe lamb reproductive performance is ensuring they achieve between 40 and 65% of their mature live weight in order to reach puberty and achieve a minimum target live weight at their first breeding (Kenyon and Corner-Thomas Citation2022). The positive relationship between ewe lamb breeding live weight and reproductive performance is well documented (Gaskins et al. Citation2005; Kenyon, Thompson, and Morris Citation2014; Thompson et al. Citation2021; Paganoni et al. Citation2022). In New Zealand, the current target live weight at breeding recommended for Romney-type ewe lambs is 42 kg (Kenyon and Corner-Thomas Citation2022) for ewes with an expected mature weight of 65–70 kg. An increase in breeding live weight has been shown to improve ewe lamb performance, although a concurrent increase in ewe mature weight has also been reported (Haslin et al. Citation2021), which would increase lifetime feed consumption. Therefore, an optimal breeding live weight for ewe lambs is one that is a balance between the potential negative impact of heavier mature ewes, while still achieving a high level of reproductive performance as a ewe lamb.
To date, most studies have focused on the impacts of breeding ewe lambs on reproductive performance and efficiency compared to ewes bred for the first time at 18 months of age (Kenyon et al. Citation2011; González-García and Hazard Citation2016; Keady and Hanrahan Citation2022, Citation2021; Thomson et al. Citation2021, p. 2022). A series of recent studies reported the effects of breeding two cohorts of ewe lambs differing in live weight on their performance and efficiency over their first three breeding seasons (Haslin et al. Citation2019, Citation2021, Citation2022a, Citation2022b). The ‘Heavier’ group had a greater performance as ewe lambs than the ‘Control’ group (Haslin et al. Citation2019, p. 2022), however, at two and three years of age, their performance no longer differed (Haslin et al. 2022a, 2022b). Although the heavier group weaned a greater number of lambs overall, ewe efficiency and feed efficiency did not differ between groups over three years (Haslin et al. Citation2021). The lifetime impacts over five production years of the two treatment groups in terms of performance, efficiency and longevity have not been examined.
The three objectives of this study were to, firstly, compare the lifetime performance and longevity of singleton- and twin-born ewe lambs born to one-year-old ewes to that of twin-born ewe lambs born to mixed-age ewes. Secondly, to investigate the lifetime effect of breeding heavier ewe lambs born to mixed-age ewes on performance, ewe efficiency and feed efficiency. Thirdly, to determine the impact of the percentage of mature live weight achieved at ewe lamb breeding on the lifetime performance of ewes either born to one-year-old ewes or mixed-age ewes.
Material and methods
The study was conducted at Massey University’s Riverside farm (latitude: 40˚50’35 S, longitude: 175˚37’55 E), 10 km north of Masterton between January 2018 and January 2019, and Keeble farm (latitude: 41˚24’03 S, longitude: 175˚35’51 E), 5 km south of Palmerston North, New Zealand between January 2019, and December 2022. The study and all animal handling procedures were approved by the Massey University Animal Ethics Committee (MUAEC17/16).
Experimental design
The experimental design has been described in detail by Haslin et al. (Citation2021, 2022b) and Pettigrew et al. (Citation2021). The chronology, dates, and average age of the ewes at each of the main events of the study are presented in and . Briefly, 493 Romney ewe lambs born in the spring of 2017 were allocated to four treatment groups at weaning (approximately 82 days of age; January 2018; d82) based on the age of their dam, birth rank and live weight. Ewe lambs were either born to mixed-age ewes (twins only; n = 270), or to one-year-old ewes (singletons (L1) n = 135 or twins (L2) n = 88) were included in this study. Mixed-age dams (i.e. three years old and older) and one-year-old dams (bred at approximately eight months of age) were bred with the same rams and during the same period for 34 days to achieve lambs being born at a similar time (Pettigrew et al. Citation2021).
Figure 1. Treatment flow diagram to the breeding of ewe lambs at an average day 209 of age (based on information in Pettigrew et al. Citation2021a and Haslin et al. Citation2022b).
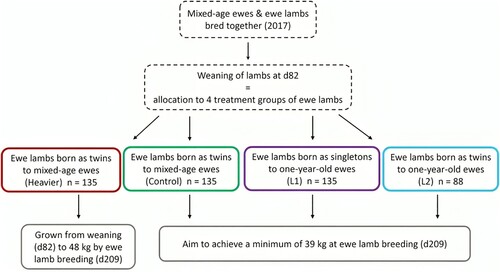
Table 1. Chronology of the main events of the five-year period (2018-2022) with average ewe age in days and dates.
The heaviest 135 singleton-born females among 184 lambs born to one-year-old ewes (L1) and all twin-born ewe lambs born to one-year-old ewes (L2; n = 88) present at weaning were selected for the study (Pettigrew et al. Citation2021). Post-weaning, L1 and L2 were offered concentrate feed until breeding at seven months of age (May 2018; d209), aiming to achieve a minimum live weight of 39 kg by breeding at d209 (Pettigrew et al. Citation2021).
Of the ewe lambs born to mixed-age ewes, 270 were selected from the heaviest female lambs present at weaning (d82) (Pettigrew et al. Citation2021b). At d82, these twin-born ewe lambs born to mixed-age ewes were allocated to one of the two treatments: Heavier (n = 135) and Control (n = 135) using a stratified random sampling procedure. The Heavier group was preferentially fed with a greater amount of concentrate feed than the Control group until ewe lamb breeding (d209) to ensure they were heavier, achieving 47.9 ± 0.36 kg (Haslin et al. 2022b). The Control group weighed 44.9 ± 0.38 kg at d209 (Haslin et al. 2022b).
At the start of ewe lamb breeding (d209), all ewe lambs (irrespective of treatment group) heavier than 39 kg were bred as a single cohort. A subset of ewe lambs that were lighter than 39 kg (L1 n = 40 and L2 n = 59) were not bred and grazed separately for 17 days. After 17 days (d226), ewe lambs were weighed again; those that were heavier than 39 kg (L1 n = 12 and L2 n = 7) were introduced to the rams until the end of breeding (d243), whereas those lighter than 39 kg (L1 n = 28 and L2 n = 52) were not bred and remained separated until d243. The latter were maintained in the study and bred for the first time at 19 months of age. At d243, all ewe lambs were combined into one cohort and managed together until the weaning of their fifth litter (December 2022; d1882; ). Ewes were bred at an average of seven (d209), 19 (d563; April 2019), 30 (d902; April 2020), 42 (d1251; March 2021) and 54 months of age (d1630; March 2022) for 34 days (). At each pregnancy diagnosis (d293, d656, d990, d1350 and d1711), the pregnancy status and the number of foetuses were determined by trans-abdominal ultrasound. Each year, pregnant ewes were allocated to lambing paddocks pre-lambing (d347, d697, d1046, d1396 and d1764), paddock selection was based on the number of foetuses (0, 1, 2, 3) and the period of conception (first or second 17-day period of the breeding period). Ewes from the four treatment groups were present in all lambing paddocks. Each year, any non-pregnant ewes were grazed separately from pre-lambing to weaning and re-joined the flock after weaning. During the lambing periods, ewes were checked twice daily to identify new-born lambs. Lambs were ear marked and their tail was removed in early lactation, at approximately 27 days of age (d390, d742, d1091, d1448 and d1817) and were weaned at approximately 92 days of age (d461, d796, d1155, d1522 and d1882). Ewes that were non-pregnant or whose entire litter died before weaning were not removed from the study.
Nutritional management
The nutritional management during the period prior to ewe lamb breeding (d209) and the first three years of production (2018, 2019 and 2020) was described in detail by Pettigrew et al. (Citation2021a) and Haslin et al. (Citation2022a, Citation2022b). Briefly, the four treatment groups grazed lucerne (Medicago sativa L.) for approximately 100 days post-weaning. Thereafter, they were grazed on ryegrass (Lolium perenne L.) and white clover (Trifolium repens L.) pastures under commercial New Zealand grazing conditions until the end of the study (d1882).
To ensure the maximum number of ewe lambs from L1 and L2 groups achieved a minimum of 39 kg at d209 and to achieve heavier ewe lamb breeding live weight in the Heavier group, different amounts of concentrate feed were offered, in addition to pasture, to the treatments until d209 (Pettigrew et al. Citation2021a; Haslin et al. Citation2022a, Citation2022b). Any ewe lambs in L1 and L2 groups that were lighter than 39 kg at d209 continued to receive concentrate feed until d223 (Pettigrew et al. Citation2021a). Individual intakes were not measured.
Animal measurements
All animal measurements between d209 and d1155 were described by Pettigrew et al. (Citation2021a) and Haslin et al. (Citation2022b). Unfasted live weights of ewes were recorded at each event presented in . At pregnancy diagnosis (d293, d656, d990, d1350 and d1711), ewes were identified as pregnant or non-pregnant and the number of foetuses was recorded (0, 1, 2 or 3). Any removal of ewes from the study was recorded throughout the five years.
During lambing periods, within 18 h of birth, lambs were identified to their dam, and their sex, birth rank and date of birth were recorded. Each year, live weights of lambs were recorded within 18 h of birth, in early lactation (d390, d742, d1091, d1448 and d1817) and at weaning (d461, d796, d1155, d1522 and d1882). Each year, the number of lambs born and weaned for each individual ewe was recorded.
Data management
Number and live weights of lambs
The lifetime number of lambs born (NLB) and weaned (NLW) over the five-year period was calculated for each individual ewe by summing the yearly number of lambs born and weaned. The lifetime weight of lambs at birth and weaning (WWT) was calculated for each ewe. Ewes that gave birth to multiple lambs of which one or more lambs died, had the lifetime weight of lamb weaned calculated based on the weights at weaning of the surviving lambs by assigning lambs that failed to survive a nominal 0 kg at weaning.
To determine the effects of the first year of production (i.e. as ewe lambs) on the lifetime performance of ewes, NLB, NLW, litter birthweight and litter WWT over the final four years of production (year 2 to year 5; d563 to d1882) were also calculated for each individual ewe.
Efficiency
Ewe efficiency was calculated for each ewe for each year over the five-year period using the yearly lamb weaning weight (WWT) divided by ewe live weight at the breeding of each year (d209, d563, d902, d1251 and d1630) as per Earle et al. (Citation2017) and Pettigrew et al. (Citation2019).
The methodology and equations used to estimate the lifetime energy requirements of all ewes were described in detail by Haslin et al. (Citation2021). Briefly, daily live weights from d82 to d1882 were predicted using the Expand procedure (SAS v9.4, SAS Institute Inc., Carry, NC, USA) which fits a cubic spline curve. The predictions of the daily live weight were stopped at the last recorded live weight for ewes that died or were missing between the two live weight records. Daily ewe energy requirement was calculated using individual ewe performance and predicted daily live weights over the five-year period, by summing the energy requirements for maintenance, liveweight change, pregnancy, lactation, and lamb maintenance and growth met by pasture for each day of life of the ewes (Freer et al. Citation2007; Nicol and Brookes Citation2017; Haslin et al. Citation2021). The estimated lifetime energy requirement was calculated for each ewe by summing daily ewe energy requirements from their weaning (d82) to either the day they died, were culled for welfare reasons or went missing, or the end of the study (d1882) (Haslin et al. Citation2021). The total energy requirement for each year of the study was also calculated between each weaning for each ewe alive at the start of each year (i.e. between d82 and d461 for year 1 (2018), d462 and d796 for year 2 (2019), d797 and d1155 for year 3 (2020), d1156 and d1522 for year 4 (2021) and d1523 and d1882 for year 5 (2022)).
The predicted pasture intakes were calculated based on the estimated energy requirements and an average annual energy content of ryegrass/white clover pastures in the Central North Island of New Zealand (10.3 ± 0.51 MJME / kg DM; (Litherland et al. Citation2002)) as per Haslin et al. (Citation2021). Feed efficiency values for each ewe for their lifetime and each production year were calculated as follows:
A combined feed efficiency value including production years 2–5 (WWT between year 2 and 5 per predicted pasture intake for years 2–5) was also calculated to determine the potential effect of the first year of production.
Percentage of mature live weight at ewe lamb breeding (d209)
The percentage of mature live weight achieved at ewe lamb breeding (d209) was calculated from live weight at their fourth breeding (d1251), at approximately 3.5 years of age. This percentage was calculated for every ewe with recorded live weights at d209 and d1251 (Heavier n = 116, Control n = 115, L1 n = 105, L2 n = 62), irrespective of whether they were bred as ewe lambs.
Ewe survival
All ewes present at the end of the study (d1882) were censored at that date for the study survival analysis. In this study, ewes were only removed for welfare reasons, therefore, to simulate commercial farming conditions on ewe retention in the flock, a hypothetical culling policy on performance was retrospectively applied. In this culling policy, ewe lambs that were either not bred, not pregnant or whose entire litter died before weaning (d461) were retained in 2018. After this time, 2019–2022, any non-pregnant ewes at pregnancy diagnosis (d656, d990, d1350 and d1711) and ewes who lost their entire litter before weaning (d769, d1155, d1522 and d1882) were culled.
Statistical analyses
All statistical analyses were conducted using SAS v9.4 (SAS Institute Inc., Carry, NC, USA). All possible models were examined with statistical significance of terms and interactions thereof accepted at P < 0.05 and included all ewes until they died or were removed from the study. Non-significant interactions (P > 0.05) were removed from the models.
Ewe live weights were analysed with a linear mixed model allowing for repeated measures. The model included treatment (Heavier vs. Control vs. L1 vs. L2), time of measurement () and their two-way interaction as fixed effects.
The yearly number of lambs born (NLB) and weaned (NLW) per ewe were analysed with Poisson generalised linear mixed models. The yearly litter weights at birth and weaning, yearly ewe efficiency (yearly litter WWT/ewe breeding live weight) and yearly feed efficiency (yearly litter WWT/yearly predicted pasture intake) were analysed with linear mixed models. All models included treatment, year (1, 2, 3, 4 and 5) and their two-way interaction as fixed effects, and ewe was fitted as a random effect.
The lifetime number of lambs born (NLB) and weaned (NLW) were analysed using generalised linear models with Poisson distributions and log transformations. The lifetime weight of lamb weaned (WWT) and feed efficiency (lifetime WWT / lifetime predicted pasture intake) over the five-year period were analysed with linear mixed models. All models included treatment as a fixed effect. The percentage of mature live weight at ewe lamb breeding was added to the NLW, WWT and lifetime feed efficiency models as a covariate to determine its potential effect. Models were also re-run with percentage of mature live weight as a covariate and excluding treatment.
The models constructed for yearly NLB and NLW, yearly litter weights of lambs at birth and WWT, yearly ewe and feed efficiency, and lifetime NLB, NLW and feed efficiency were re-run, excluding the production year 1 (2018). All models included treatment as a fixed effect.
Survival analysis of ewes was carried out using the age in days at which ewes were removed prior to d1882 or died with the Lifetest procedure (SAS v9.4, SAS Institute Inc., Carry, NC, USA). A hypothetical culling policy on performance was also applied to ewes retrospectively to determine the predicted retention rate of ewes in the flock. Survival analyses of the study and the hypothetical culling policy were compared between treatments.
Results
Ewe live weight
Heavier ewes were heavier (P < 0.001) than the Control ewes from d209 to d347 after which they did not differ to d1882 (P > 0.05; ). Heavier ewes were heavier (P < 0.05) than L1 ewes from d82 to d1882, except at d1155, d1251 and d1522 at which they did not differ (P > 0.05). Heavier ewes were heavier (P < 0.05) than L2 ewes throughout the study from d82 to d1882. Control ewes were heavier (P < 0.05) than L2 ewes from d82 to d1817, except at d1882 when they did not differ (P > 0.05). Control ewes were heavier (P < 0.05) than L1 ewes from d82 to d742, d902 to d1046, d1350 to d1396 and d1630 to d1817; but did not differ (P > 0.05) from L1 at d796, d1091 to d1251, d1448, d1522 and d1882. L1 ewes were heavier (P < 0.05) than L2 ewes from d82 to d390 after which they no longer differed to d1882 (P > 0.05).
Figure 2. Effect of treatment (Heavier vs. Control vs. L1 vs. L2) on least-square means (± SEM) of live weight (kg) ewes from weaning (d82) to the weaning of their fifth litter (d1882). Y1: Production year 1 (2018); Y2: Year 2 (2019); Y3: Year 3 (2020); Y4: Year 4 (2021) and Y5: Year 5 (2022). Heavier: ewes born as twins to mature ewes and grown to 48 kg by ewe lamb breeding (d209); Control: ewes born as twins to mature ewes and grown to 44 kg by d209; L1: ewes born to ewe lambs as singletons; L2: ewes born to ewe lambs as twins.
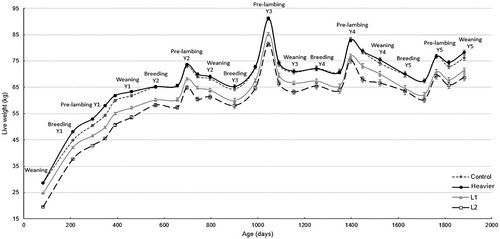
At breeding, Heavier ewes were heavier than Control ewes, which were heavier (P < 0.01) than L1 ewes, which were in turn heavier than L2 ewes at d209, after which Heavier and Control ewes were heavier (P < 0.05) than L1 and L2 ewes (d563, d902 and d1630; ). At d1251, Control and Heavier ewes were heavier than L2 ewes but not L1 ().
Table 2. Number of ewes present at breeding each year (n) and effect of treatment (Heavier vs. Control vs. L1 vs. L2) on least square means (± SEM) of live weight (kg) of ewes at breeding over their first five years of production (2018–2022).
Yearly lamb production
Across the five years of production, the yearly NLB and NLW per ewe did not differ (P > 0.05) between treatments (). Heavier ewes had heavier (P < 0.05) yearly litter weight at birth and weaning and greater (P < 0.05) ewe efficiency than L1 ewes (). Yearly litter weight at birth and weaning and ewe efficiency of Control and L2 ewes did not differ (P > 0.05) from Heavier and L1 ewes (). Heavier ewes had greater (P < 0.05) yearly feed efficiency than L1 and L2 ewes but did not differ (P > 0.05) from the Control ewes ().
Table 3. The effect of treatment1 (Heavier vs. Control vs. L1 vs. L2) on least-square means (95% confidence intervals) on the yearly number of lambs born (NLB/Ewe), yearly number of lambs weaned (NLW/Ewe) per ewe, and least square means (± SEM) of yearly litter weight at birth and weaning per ewe over the five-year period, and yearly ewe efficiency (yearly litter weaning weight/ewe live weight at breeding) and yearly feed efficiency2 (yearly litter weaning weight/yearly predicted pasture intake) across five years of production.
When the lamb production and ewe and feed efficiency in the first year of production (i.e. as ewe lambs) was excluded (i.e. data from d82 to d461) from the analysis, yearly NLB, NLW, litter birthweight, ewe efficiency and yearly feed efficiency no longer differed (P > 0.05) between treatments (Appendix A). Control ewes tended to have heavier litter weaning weight than L1 ewes (P < 0.10; Appendix A).
Lifetime performance
Heavier ewes had greater (P < 0.05) lifetime NLB than Control, L1 and L2 ewes (). Lifetime NLB did not differ between Control, L1 and L2 ewes (P > 0.05). Heavier ewes had a greater NLW, WWT and feed efficiency over their lifetime than L1 and L2 ewes (P < 0.05) but did not differ from Control ewes (P > 0.05). Control ewes had a greater (P < 0.05) NLW and WWT over their lifetime than L2 but did not differ from L1 ewes (P > 0.05). For a given live weight at ewe lamb breeding (d209), Heavier ewes weaned more lambs and had a greater WWT than L1 and L2 ewes over their lifetime (P < 0.05; and ).
Figure 3. The number of lambs weaned over the lifetime of ewes in Heavier (n = 135), Control (n = 135), L1 (n = 135) and L2 (n = 88) treatments in relation to their live weight at ewe lamb breeding (d209; log predictions and 95% confidence intervals shown). Heavier: ewes born as twins to mixed-age ewes and grown to 48 kg by d209; Control: ewes born as twins to mixed-age ewes and grown to 44 kg by d209; L1: ewes born to ewe lambs as singletons; L2: ewes born to ewe lambs as twins; performance from all ewes were included regardless of whether they died or were removed from the study prior to d1882.
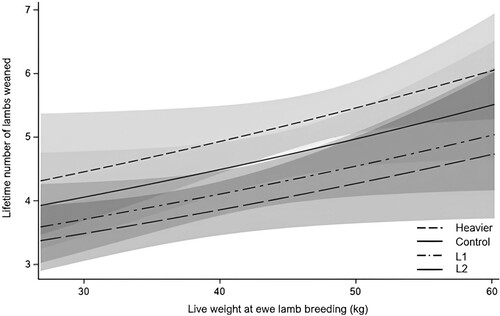
Figure 4. Lifetime weight of lambs weaned of ewes in Heavier (n = 135), Control (n = 135), L1 (n = 135) and L2 (n = 88) treatments in relation to their live weight at breeding as a ewe lamb (d209). The predictions of L1 and L2 treatments are similar. Predictions and 95% confidence intervals shown in grey. Heavier: ewes born as twins to mixed-age ewes and grown to 48 kg by d209; Control: ewes born as twins to mixed-age ewes and grown to 44 kg by d209; L1: ewes born to ewe lambs as singletons; L2: ewes born to ewe lambs as twins; performance from all ewes were included regardless of whether they died or were removed from the study prior to d1882.
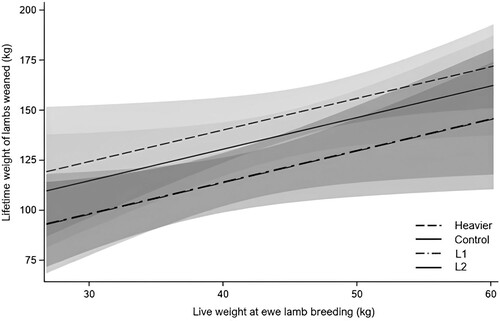
Table 4. Effect of treatment1 (Heavier vs. Control vs. L1 vs. L2) on least square means (95% confidence intervals) on the lifetime number of lambs born (NLB) and weaned (NLW), and least square means (± SEM) of lifetime weight of lamb weaned (kg; WWT) and estimated feed efficiency (lifetime weight of lamb weaned/lifetime predicted pasture intake; kg/kg DM) over the five-year period (i.e. potentially five lambing periods)2.
When the first year of production (i.e. ewe lambs) was excluded from the analysis, Heavier ewes had a greater NLB than Control, L1 and L2 ewes (P < 0.01; Appendix A). Heavier ewes had greater (P < 0.01) NLW and WWT than L1 and L2, which did not differ (P > 0.05) over the four-year period (2019–2022). Control ewes did not differ from the other groups over the four-year period (P > 0.05; Appendix A). In addition, feed efficiency over the four-year period (2019–2022) no longer differed between treatments (P > 0.05; Appendix A).
Percentage of mature live weight at ewe lamb breeding (d209)
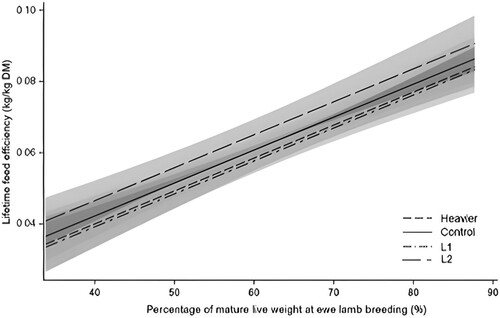
Treatment had no effect on ewe lifetime NLW (P > 0.05). There was a positive relationship between the percentage of mature live weight at d209 and the lifetime NLW (P < 0.01; ). For a given percentage of mature live weight at d209, Heavier ewes tended to have greater WWT than L1 ewes over their lifetime (P = 0.06; ). No other differences between treatments were observed. For a given percentage of mature live weight at d209, L2 ewes had greater (P = 0.05) lifetime feed efficiency than L1 ewes (). An additional 10% of mature live weight at d209 resulted in an increase of 19.1 kg in lifetime WWT and 0.00084 kg/kg DM in lifetime feed efficiency, irrespective of treatment group.
Figure 5. Lifetime number of lambs weaned of ewes (n = 398) in relation to the percentage of mature live weight achieved at ewe lamb breeding (d209). Predictions and 95% confidence intervals shown in grey. Only ewes with recorded live weights at d209 that were bred at four years of age (d1251) were included, irrespective of whether they were bred as ewe lambs.
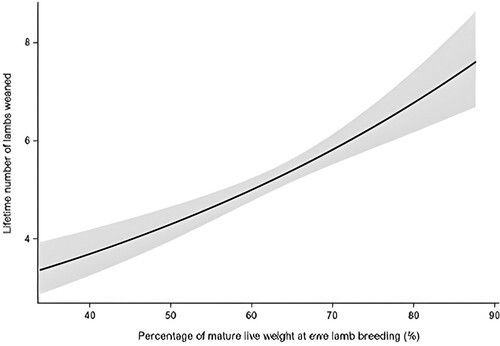
Figure 6. Lifetime weight of lamb weaned of ewes in Heavier n = 116, Control n = 115, L1 n = 105, L2 n = 62 treatments in relation to the percentage of mature live weight at breeding as a ewe lamb (d209). Predictions and 95% confidence intervals are shown in grey. Heavier: ewes born as twins to mixed-age ewes and grown to 48 kg by d209; Control: ewes born as twins to mixed-age ewes and grown to 44 kg by d209; L1: ewes born to ewe lambs as singletons; L2: ewes born to ewe lambs as twins; only ewes with recorded live weights at d209 and breeding at four years of age (d1251) were included, irrespective of whether they were bred as ewe lambs.
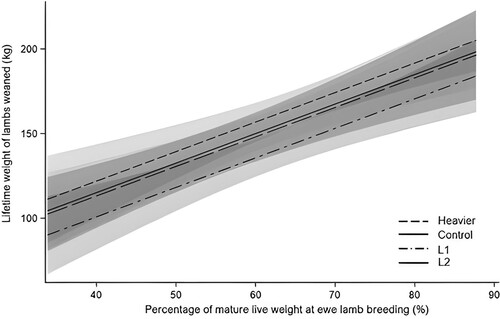
Figure 7. Lifetime feed efficiency (i.e. lifetime weight of lambs weaned/lifetime predicted pasture intake) of ewes in Heavier n = 116, Control n = 115, L1 n = 105, L2 n = 62 treatments in relation to the percentage of mature live weight at breeding as a ewe lamb (d209). Predictions and 95% confidence intervals are shown in grey. Heavier: ewes born as twins to mixed-age ewes and grown to 48 kg by d209; Control: ewes born as twins to mixed-age ewes and grown to 44 kg by d209; L1: ewes born to ewe lambs as singletons; L2: ewes born to ewe lambs as twins; only ewes with recorded live weights at d209 and breeding at four years of age (d1251) were included, irrespective of whether they were bred as ewe lambs.
Ewe longevity to the end of the fifth year of production (d1882)
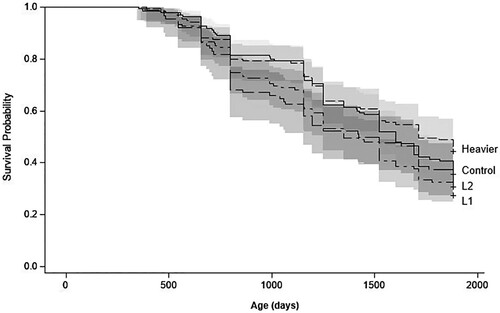
Ewes in the Heavier treatment were more likely (P < 0.01) to be retained to d1882 than L2 ewes and tended to more likely (P = 0.07) to be retained than L1 ewes (). When a hypothetical culling policy on performance (i.e. culling non-pregnant ewes at pregnancy diagnosis and ewes whose entire litter died at weaning between production years 2 and 5) was applied, Heavier ewes were more likely (P < 0.05) to be retained than L1 ewes and tended to be more likely to be retained than L2 ewes (P < 0.10; Figure ).
Figure 8. Retention curves and 95% confidence intervals (grey area) of the ewes based on treatments (Heavier vs. Control vs. L1 vs. L2) until weaning of their fifth litter (d1882). Heavier: ewes born as twins to mixed-age ewes and grown to 48 kg by ewe lamb breeding (d209); Control: ewes born as twins to mixed-age ewes and grown to 44 kg by d209; L1: ewes born to ewe lambs as singletons; L2: ewes born to ewe lambs as twins. Ewes were only culled for welfare reasons.
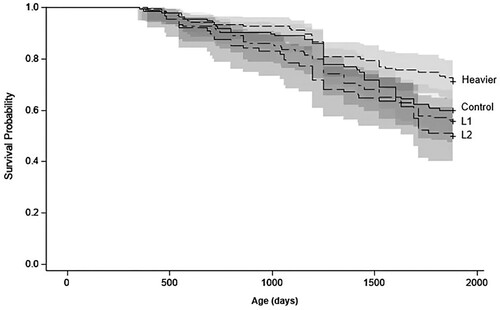
Figure 9. Predicted retention curves and 95% confidence intervals (grey area) of the ewes based on treatments (Heavier vs. Control vs. L1 vs. L2) until weaning of the fifth litter (d1882) with a hypothetical culling policy: ewe lambs that were not pregnant at pregnancy diagnosis (d293) or whose entire litter died were not culled in 2018, and then culled if between production year 2 (2019) and 5 (2022), they were non-pregnant ewes at pregnancy diagnosis (d656, d990, d1350 and d1711) or their entire litter died before weaning (d769, d1155, d1522 and d1882). Heavier: ewes born as twins to mixed-age ewes and grown to 48 kg by ewe lamb breeding (d209); Control: ewes born as twins to mixed-age ewes and grown to 44 kg by d209; L1: ewes born to ewe lambs as singletons; L2: ewes born to ewe lambs as twins.
Discussion
Performance of ewes born to one-year-old ewes compared with ewes born to mixed-age ewes
Singleton- and twin-born ewes born to one-year-old ewes (L1 and L2) did not differ in live weight beyond their first pregnancy, although, they remained lighter than their twin counterparts born to mixed-age ewes (Control and Heavier) throughout the study. These results contrasted with previous studies which reported that ewes born as singletons to one-year-old ewes were only lighter than ewes born to mixed-age ewes up to one year of age, after which no difference was observed (Loureiro et al. Citation2012; Pain et al. Citation2015). Ewes born as singletons to one-year-old ewes were heavier than those born as twins to one-year-old ewes, from 18 months to eight years of age (Loureiro et al. Citation2016; Pettigrew et al. Citation2019). Collectively, these studies suggest that ewes born to one-year-old ewes will likely suffer some liveweight handicap, relative to those born to mixed-age ewes, throughout their productive life, especially those born as twins.
Yearly, the number of lambs born and weaned and litter weights at birth and weaning of the L1, L2 and Control ewes did not differ, however, L1 ewes had lower yearly litter weights at birth and weaning than Heavier ewes. The lifetime number and weight of lambs weaned by L1 and L2 ewes were lower than those of the Heavier ewes and L2 ewes were lower than Control ewes. When the first year of production was removed, only the differences in production with Heavier ewes remained. This indicated that ewes born to one-year-old ewes produced less lambs and had a lower weight of lambs weaned over their lifetime than heavier ewe lambs born to mixed-age ewes. Previous studies have shown that the yearly weight of lambs weaned of ewes born as twins to one-year-old ewes tended to be lower than ewes born to mixed-age ewes over their lifetime (Pettigrew et al. Citation2019). Further, dam age and birth rank had no effect on yearly or combined reproductive performance up to eight years of age (Loureiro et al. Citation2012, Citation2016; Pain et al. Citation2015; Pettigrew et al. Citation2019), which contrasted with the present study. In these latter studies, however, ewes were bred for the first time at 18 months of age. The lower lifetime performance of ewes born to one-year-old ewes was driven by their poor performance at one year of age, which in turn was driven by lighter live weights at seven months of age, limiting their ability to be bred and emphasising the achievement of suitable breeding live weights in ewe lambs.
Ewe efficiency is related to her ability to wean many heavy lambs relative to her live weight (Coop and Hayman Citation1962; Baker et al. Citation1973). Feed efficiency is the ability of a ewe to convert feed into the weaning weight of lambs (Sise et al. Citation2009). Both ewe efficiency (yearly litter weaning weight/ewe breeding live weight) and feed efficiency (yearly and lifetime) did not differ between L1, L2 and Control ewes. These results support previous studies that reported no effect of dam age (Pain et al. Citation2015; Pettigrew et al. Citation2019) or birth rank (Pettigrew et al. Citation2019) on ewe or feed efficiency. While in this study, Heavier ewes (born to mixed-age ewes) had greater ewe efficiency than L1 ewes, no other differences between treatment groups were observed. Heavier ewes also had greater yearly and lifetime feed efficiency than L1 and L2 ewes. When the first year of production was excluded, the differences in ewe and feed efficiency were no longer present. This indicated that ewe and feed efficiency in their first year of production were significant drivers of these differences. Further, the absence of a difference in ewe efficiency indicated that ewes produced the same weight of lambs weaned per kilogram of ewe live weight at breeding between production years 2 and 5. Therefore, overall, Heavier ewes weaned heavier lambs than ewes born to one-year-old ewe (L1 and L2). Similarly, no differences in feed efficiency between production years 2 and 5 suggest that the weight of kilograms of lamb weaned produced per kilograms of DM consumed was similar. Heavier ewes had a greater lifetime lamb weaning weight than L1 and L2 ewes, and therefore, consumed more feed DM than L1 and L2 ewes over their lifetime, which was estimated to be an additional 386 kg DM and 519 kg DM, respectively.
The longevity of L1 and L2 ewes born to one-year-old ewes did not differ, but both had reduced longevity compared to Heavier ewes. In the present study, when a hypothetical culling policy was applied (i.e. ewe lambs were not culled in production year 1, and then culled if ewes were not pregnant or their entire litter died before weaning between production year 2 and 5), the difference between L1 and L2 and Heavier ewes remained. Pettigrew et al. (Citation2019) reported that ewes born as twins to one-year-old ewes had lower longevity than those born as singletons to one-year-old ewes and those born to mixed-age ewes under a no-culling policy. However, the difference was no longer present when a culling policy was applied. This contrasts with the results of this study.
Combined, these results showed that ewes born to one-year-old ewes had lower lifetime lamb production and longevity compared to heavier ewes born to mixed-age ewes due to their lower live weight and performance as ewe lamb. Ewe and feed efficiency of ewes born to one-year-old ewes, however, did not differ from ewes born to mixed-age ewes beyond 18 months of age. Farmers, therefore, could select their replacements from ewes born to one-year-old ewes and have similar lamb production to ewes born to mixed-age ewes, providing they ensure that these ewe lambs reach the minimum target breeding live weights.
Impact of heavier breeding live weights of ewes born to mixed-age ewes
Positive relationships between ewe breeding live weight and ewe reproductive performance were previously reported in mature ewes (Brown et al. Citation2005; Citation2015). In this study, Heavier ewes were heavier than the Control group during their first pregnancy as ewe lambs as reported by Haslin et al. (2022b), but live weights no longer differed beyond that point. As ewe lambs, Heavier ewes had greater reproductive performance (i.e. number of ewes pregnant and lambs weaned) than Control ewes (Haslin et al. 2022b). In the present study, however, subsequent yearly and lifetime reproductive performance and longevity did not differ between the Heavier and Control groups. These results are consistent with previous studies which reported that breeding heavier ewe lambs improved their performance as ewe lambs (see review: Kenyon and Corner-Thomas Citation2022), however, later performance was not influenced (Thomas and Berger Citation2009; Haslin et al. Citation2021, 2022a). Further, it has been reported that ewe lamb performance (i.e. in the first year of life) is a significant driver for ewe performance over multiple years or their lifetime (Kenyon et al. Citation2011; Haslin et al. Citation2021; Thomson et al. Citation2021; Kenyon and Corner-Thomas Citation2022), which is consistent with results of the present study. Hence, the similar live weights between Heavier and Control ewes between production years two and five could explain the similar yearly and lifetime production. Farmers should, therefore, aim for a heavier average live weight of 50 kg rather than 42 kg to maximise their ewe lamb performance, although the cost of the extra feed must be accounted for.
Ewe efficiency did not differ between Heavier and Control ewes, which is consistent with the results of the first three production years of this study reported by Haslin et al. (Citation2021). The Control ewes were lighter at ewe lamb breeding and weaned fewer lambs than Heavier ewes as ewe lambs, but thereafter had similar live weight and performance. Yearly or lifetime feed efficiency did not differ between Heavier and Control ewes, suggesting that both groups weaned the same kilograms of lambs per kilogram of feed consumed. Heavier ewes produced an additional 15 kg lamb at weaning over their lifetime and, therefore, consumed more feed than Control ewes, which was estimated at approximately 170 kg DM. This might result in fewer ewes being maintained on a per hectare basis when the feed supply is fixed. More research is required to examine the financial consequences of growing ewe lambs to the recommended live weight and to assess the profitability and the potential benefits of this practice.
Effect of the percentage of mature weight at ewe lamb breeding on lifetime performance
There were positive relationships between the percentage of mature weight at ewe lamb breeding and lifetime number and weight of lambs weaned and feed efficiency, irrespective of treatment. Previous research has shown that the percentage of mature weight at ewe lamb breeding influenced ewe lamb fertility and fecundity (Kenyon et al. Citation2014). In this study, an additional 1% of percentage of mature live weight at ewe lamb breeding resulted in an increase of 1.91 kg of lamb weaned over their lifetime, irrespective of treatment. This emphasised ewe lamb management to achieve heavier breeding live weights in order to achieve a greater percentage of mature weight and improve lifetime lamb production.
In the present study, for a given percentage of mature weight at ewe lamb breeding, Heavier ewes tended to wean a greater lifetime weight of lambs than L1 ewes. Given that no other differences between treatments were observed, this reflected the results of lifetime lamb production. For a given percentage of mature weight at ewe lamb breeding, L2 ewes had greater lifetime efficiency than L1 ewes, with no other differences between treatments observed. This result suggests that L2 ewes were more efficient at converting feed into weaning weight of lambs over their lifetime than L1 ewes when they reached a similar percentage of mature ewes.
Conclusions
Although, neither the lifetime lamb production of Heavier nor L1 nor L2 ewes differed from the Control ewes, heavier twin-born ewe lambs born to mixed-age ewes had greater lifetime lamb production than ewe lambs born either as singletons or twins to one-year-old ewes. The lower lifetime production of ewes born to one-year-old ewes was driven by their poor production at one year of age, which in turn was driven by their lighter live weights at ewe lamb breeding thus limiting their ability to be bred. Feed and ewe efficiency of ewes born to one-year-old ewes, however, did not differ from ewes born to mixed-age ewes. Farmers, therefore, could select their replacements from ewes born to one-year-old ewes and have similar lamb production to ewes born to mixed-age ewes, providing they ensure that these ewe lambs reach the minimum target breeding live weights. An average live weight of 50 kg should be achieved at ewe lamb breeding, rather than 42 kg, to increase ewe productivity over her lifetime. More research is, however, required to examine the economic consequences of growing ewe lambs to the recommended live weight and to assess the profitability of this practice. Similarly, modelling the impact of applying the above recommendations on environmental footprint and greenhouse gas emissions would be of interest.
Acknowledgments
The authors wish to acknowledge Emma J. Pettigrew for her help with data collection, Philippe Haslin for his help with the daily energy requirement dataset, Catriona Jenkinson, Dean Burnham, Geoff Purchas, Riverside and Keeble farm staff for their technical assistance, and Beef + Lamb New Zealand for funding this study.
Disclosure statement
No potential conflict of interest was reported by the authors.
Additional information
Funding
References
- Baker RD, Large RV, Spedding CRW. 1973. Size of animal in relation to productivity with special reference to the ruminant—economic aspects. Proceedings of the British Society of Animal Production. 2:35–42.
- Brown DJ, Ball A, Huisman AE. 2005. The influence of ewe weight at mating on lamb performance and reproduction of the ewe. Proceedings of the Association for the Advancement of Animal Breeding and Genetics. 16:306–309.
- Brown DJ, Savage DB, Hinch GN, Hatcher S. 2015. Monitoring liveweight in sheep is a valuable management strategy: a review of available technologies. Animal Production Science. 55(4):427–436. doi:10.1071/AN13274.
- Coop IE, Hayman BI. 1962. Liveweight-productivity relationships in sheep. New Zealand Journal of Agricultural Research. 5(3-4):265–277. doi:10.1080/00288233.1962.10419956.
- Corner RA, Mulvaney FJ, Morris ST, West DM, Morel PCH, Kenyon PR. 2013. A comparison of the reproductive performance of ewe lambs and mature ewes. Small Ruminant Research. 114(1):126–133. doi:10.1016/j.smallrumres.2013.05.018.
- Earle E, Boland TM, McHugh N, Creighton P. 2017. Measures of lamb production efficiency in a temperate grass-based system differing in ewe prolificacy potential and stocking rate1. Journal of Animal Science. 95(8):3504–3512.
- Edwards SJ, Juengel JL. 2017. Limits on hogget lambing: the fertility of the young ewe. New Zealand Journal of Agricultural Research. 60(1):1–22. doi:10.1080/00288233.2016.1253592.
- Farrell LJ, Kenyon PR, Tozer PR, Morris ST. 2021. Determining the impact of hogget breeding performance on profitability under a fixed feed supply scenario in New Zealand. Animals. 11(5):1303. doi:10.3390/ani11051303.
- Freer M, Dove H, Nolan JV. 2007. Chapter 1, energy. In: Freer M, Dove H, Nolan JV, editor. Nutrient requirements of domesticated ruminants. Collingwood, Australia: CSIRO Publishing; p. 1–69.
- Gaskins CT, Snowder GD, Westman MK, Evans M. 2005. Influence of body weight, age, and weight gain on fertility and prolificacy in four breeds of ewe lambs1. Journal of Animal Science. 83(7):1680–1689. doi:10.2527/2005.8371680x.
- González-García E, Hazard D. 2016. Growth rates of Romane ewe lambs and correlated effects of being mated as hoggets or two-tooth ewes on first offspring performance. Livestock Science. 189:63–69. doi:10.1016/j.livsci.2016.04.022.
- Haslin E, Corner-Thomas RA, Kenyon PR, Morris ST, Pettigrew EJ, Hickson RE, Blair HT. 2019. Brief communication: impacts of live weight of ewe lambs at mating on their reproductive performance. New Zealand Journal of Animal Science and Production. 79:87–90.
- Haslin E, Corner-Thomas RA, Kenyon PR, Pettigrew EJ, Hickson RE, Morris ST, Blair HT. 2021. Effect of breeding heavier romney ewe lambs at seven months of age on lamb production and efficiency over their first three breeding seasons. Animals. 11(12):3486. doi:10.3390/ani11123486.
- Haslin E, Corner-Thomas RA, Kenyon PR, Pettigrew EJ, Hickson RE, Morris ST, Blair HT. 2022a. Breeding heavier ewe lambs at seven months of age did not impact their subsequent two and three-year-old ewe live weight and reproductive performance. New Zealand Journal of Agricultural Research. 65(2-3):129–144. doi:10.1080/00288233.2021.1967413.
- Haslin E, Corner-Thomas RA, Kenyon PR, Pettigrew EJ, Hickson RE, Morris ST, Blair HT. 2022b. Effects of heavier live weight of ewe lambs at mating on fertility, lambing percentage, subsequent live weight and the performance of their progeny. New Zealand Journal of Agricultural Research. 65(2-3):114–128. doi:10.1080/00288233.2020.1840399.
- Keady TW, Hanrahan JP. 2022. Effects of age at first joining and ewe genotype on the performance of two-tooth ewes and that of their progeny to slaughter. Animals. 12(5):653. doi:10.3390/ani12050653.
- Keady TWJ, Hanrahan JP. 2021. Effects of joining at 7 months, and ewe genotype, on the performance of ewes to 19 months of age and that of their progeny to slaughter. Animal. 15(6):100232. doi:10.1016/j.animal.2021.100232.
- Kenyon PR. 2012. Hogget performance: unlocking the potential. Beef + Lamb New Zealand.
- Kenyon PR, Corner-Thomas RA. 2022. Breeding ewe lambs: An Australasian perspective. Animals. 12(22):3207. doi:10.3390/ani12223207.
- Kenyon PR, Corner-Thomas RA, Paganoni BL, Morris ST. 2014. Percentage of mature liveweight affects reproductive performance in ewe lambs. Proceedings of the Australian Society of Animal Production. 30:255.
- Kenyon PR, Thompson AN, Morris ST. 2014. Breeding ewe lambs successfully to improve lifetime performance. Small Ruminant Research. 118(1):2–15. doi:10.1016/j.smallrumres.2013.12.022.
- Kenyon PR, van der Linden DS, West DM, Morris ST. 2011. The effect of breeding hoggets on lifetime performance. New Zealand Journal of Agricultural Research. 54(4):321–330. doi:10.1080/00288233.2011.611148.
- Litherland AJ, Woodward SJR, Stevens DR, McDougal DB, Boom CJ, Knight TL, Lambert MG. 2002. Seasonal variations in pasture quality on New Zealand sheep and beef farms. Proceedings of the New Zealand Society of Animal Production. 62:138–142.
- Loureiro MFP, Kenyon PR, Pain SJ, Blair HT. 2016. Reproductive performance of singleton and twin female offspring born to ewe-lamb dams and mature adult dams. Proceedings of the New Zealand Society of Animal Production. 76:151–154.
- Loureiro MFP, Pain SJ, Kenyon PR, Peterson SW, Blair HT. 2012. Single female offspring born to primiparous ewe-lambs are lighter than those born to adult multiparous ewes but their reproduction and milk production are unaffected. Animal Production Science. 52(7):552–556. doi:10.1071/AN11211.
- Nicol AM, Brookes IM. 2017. Chapter 10 - The metabolisable energy requirement of grazing livestock. In: Rattray Pvbimnam, editor. Pasture and supplements for grazing animals. Hamilton, New Zealand: New Zealand Society of Animal Production; p. 151–172.
- Paganoni BL, Ferguson MB, Greeff JM, Kearney GA, Thompson AN. 2022. Mating weight and condition score are both good predictors of lambing potential for young Merino and Border Leicester Merino ewes across different environments and years in Australia. Animal Production Science. 62(15):15071517.
- Pain SJ, Loureiro MFP, Kenyon PR, Blair HT. 2015. The effect of dam age on ewe offspring productive performance and efficiency. Proceeding of the New Zealand Society of Animal Production. 75:239–242.
- Pettigrew E, Hickson R, Morris S, Kenyon P, Corner-Thomas R, Haslin E, Blair H. 2021. The effect of age of dam and birth rank on the reproductive performance of ewes as one- and two-year-olds. Animals. 11(3):770. doi:10.3390/ani11030770.
- Pettigrew EJ, Hickson RE, Blair HT, Griffiths KJ, Ridler AL, Morris ST, Kenyon PR. 2021. Differences in lamb production between ewe lambs and mature ewes. New Zealand Journal of Agricultural Research. 64(4):508–521. doi:10.1080/00288233.2020.1713177.
- Pettigrew EJ, Hickson RE, Morris ST, Lopez-Villalobos N, Pain SJ, Kenyon PR, Blair HT. 2019. The effects of birth rank (single or twin) and dam age on the lifetime productive performance of female dual purpose sheep (Ovis aries) offspring in New Zealand. PLoS One. 14(3):e0214021. doi:10.1371/journal.pone.0214021.
- Sise JA, Shackell GH, Byrne TJ, Glennie SF, Amer PR. 2009. A simulation model to partition ewe efficiency into component traits for genetic analysis. Proceedings of the New Zealand Society of Animal Production. 69:223–227.
- Thomas DL, Berger YM. 2009. Effects of Prepubertal Growth Rate of Ewe Lambs on their Subsequent Lamb and Milk Production. Great Lakes Dairy Sheep Symposium; Albany, New York, USA.
- Thompson AN, Bowen E, Keiller J, Pegler D, Kearney G, Rosales-Nieto CA. 2021. The number of offspring weaned from Ewe lambs Is affected differently by liveweight and Age at breeding. Animals. 11(9):2733. doi:10.3390/ani11092733.
- Thomson BC, Smith NB, Muir PD. 2021. Effect of birth rank and age at first lambing on lifetime performance and ewe efficiency. New Zealand Journal of Agricultural Research. 64(4):529–539. doi:10.1080/00288233.2020.1745853.
- Young JM, Thompson AN. 2021. Profitability of mating maternal composite and Merino ewe lambs. Biennial Conference of the Australian Association of Animal Sciences; 1-3 February; Perth: Australian Association of Animal Science.
Appendix
Effect of treatment on ewe yearly and total performance from the second (2019) to fifth year of production (2022)
Table A1. The effect of treatment1 (Heavier vs. Control vs. L1 vs. L2) on least-square means (95% confidence intervals) of yearly number of lambs born (NLB/Ewe), the yearly number of lambs weaned (NLW/Ewe) per ewe, and least square means (± SEM) of yearly litter weight at birth and weaning per ewe over the five-year period, and the yearly ewe efficiency (yearly litter weight at weaning/ewe live weight at breeding) and yearly feed efficiency2 (yearly litter weight at weaning/predicted feed intake) between the production year 2 (2019) and 5 (2022).
Table A2. Effect of treatment1 (Heavier vs. Control vs. L1 vs. L2) on least square means (95% confidence intervals) of the total number of lambs born (NLB) and weaned (NLW), and least square means (± SEM) of total weight of lambs weaned (WWT) and total feed efficiency (total weight of lambs weaned / predicted pasture intake) between the production year 2 (2019) and 5 (2022)2.