
ABSTRACT
Full inversion tillage (FIT) at pasture renewal is a management option aiming to increase carbon stocks in long-term pasture, to achieve carbon neutrality. This study investigated the effects of FIT on carbon and nutrient distribution in the soil profile (0–7.5, 7.5–15, 15–22.5 and 22.5–30 cm depths) as well as nutrient uptake, and subsequent fodder crop and/or pasture yields across three pasture renewal trials (Trials 1 and 3: Alfisol; Trial 2: Andisol). These effects of FIT were assessed against standard tillage treatments (no till, shallow till), and non-renewed pasture within 8–18 months post-tillage. FIT changed soil carbon stratification, causing 16%–46% reduction in topsoil (0–7.5 cm) cation exchange capacity across the three trials. However, nutrient levels after FIT remained within recommended ranges for crop and/or pasture growth, avoiding any yield reductions. Topsoil fertility post-FIT depended on original degree of nutrient stratification in the soil profile. At Trial 1, temporary deficiencies caused by low subsoil P and K soil tests pre-FIT were anticipated and corrected with fertiliser nutrients for the following break crop and resown pasture. We conclude that soil testing the cultivation depth prior to FIT at pasture renewal provides the necessary soil test information to manage yield expectations.
Introduction
Soil organic matter (SOM) in agricultural land represents a large store of carbon (C). Increasing soil organic C (SOC) stocks is one of the negative emissions technologies (NET) considered by the Intergovernmental Panel on Climate Change (IPCC Citation2014). Increasing SOC storage in agricultural soils is considered a sustainable management option to mitigate greenhouse gas (GHG) emissions, as it removes carbon dioxide (CO2) from the atmosphere, contributing towards carbon neutrality (Rumpel et al. Citation2019; Soussana et al. Citation2019; Bai and Cotrufo Citation2022). Under long-term grazed pastures (e.g. those in New Zealand and Ireland), SOC concentrations in the soil profile are highly stratified (Calvelo-Pereira et al. Citation2018; Lawrence-Smith et al. Citation2021; Madigan et al. Citation2022), thus limiting additional storage in the topsoil, while subsoils remain relatively undersaturated.
High producing grassland management in New Zealand typically involves renewal every 7–10 years to maintain high pasture quality and productivity (Dodd et al. Citation2018). Renewal of the old pasture often includes different tillage systems, either no till (NT, direct drill), shallow till (ST, shallow disc, or rotary hoe to approximately 5 cm depth) or full cultivation (mouldboard ploughing or large disc plough to approximately 10–20 cm depth). The NT and ST methods maintain the C stratification, with 2- to 4-fold higher C concentration in topsoils (0–15 cm) than subsoils (20–30 cm) (Calvelo-Pereira et al. Citation2022). A one-off tillage event may promote short-term losses of C (Rutledge et al. Citation2014), but topsoil C stocks can be re-established over several years, through high inputs (pasture litter and roots, dung decomposition) (Hedley et al. Citation2009; Rutledge et al. Citation2014).
Lawrence-Smith et al. (Citation2021) proposed the implementation of deeper tillage (or full inversion tillage, FIT), using a modified mouldboard plough with a skimmer, to transfer topsoil into the 25–40 cm soil depth. When performed infrequently (Alcántara et al. Citation2016; Schiedung et al. Citation2019), FIT (1) changes SOM stratification, (2) exposes undersaturated C in subsoil to higher plant inputs, (3) promotes the storage of new C into the soil (Calvelo-Pereira et al. Citation2018), whilst (4) the buried topsoil C decomposes more slowly (Kirschbaum et al. Citation2021). Lawrence-Smith et al. (Citation2021) estimated that there is an area of 2.6 million ha of ploughable pasture in NZ that could sequester an additional 14 Mg C ha−1 in the 0–30 cm depth over 20 years from the implementation of FIT at pasture renewal.
Nutrients in grazed pasture soils are usually vertically stratified along with the SOM, with the greatest proportion occurring in the topsoil, where roots are most dense and active (Cayley et al. Citation2002), especially under shallow-rooted permanent pasture species (e.g. Crush et al. Citation2005). There is concern amongst rural professionals and farmers that the use of FIT could cause unintended changes in topsoil fertility, because of the redistribution of nutrients along with the SOM transferred into depth. Topsoil is the main zone for accumulation and recycling of nutrients (Monaghan et al. Citation2007) and pollutants (Loganathan et al. Citation2001; Loganathan et al. Citation2007; Stafford et al. Citation2018) due to the surface application of fertilisers, plant nutrient uptake, and return of livestock excreta. Soil fertility diagnostics rely on a standard soil testing depth, shallower for pastures (0–7.5 cm) than for crops (0–15 cm; Roberts and Morton Citation2016; Morton et al. Citation2020). Conventional mouldboard ploughing of long-term pasture can decrease topsoil (0–7.5 cm) test values (e.g. Olsen P concentrations, Zhang et al. Citation2009) and pollutant concentrations (e.g. Fluorine and Cadmium, Loganathan et al. Citation2007; Stafford et al. Citation2018), resulting in environmental benefits of reduced P run-off (McDowell and Smith Citation2023) and reducing pollutant uptake by pastures (Peng et al. Citation2023). Milligan et al. (Citation2017) found that FIT (∼70 cm depth) reduced topsoil (0–12 cm) K, Mg, extractable P, and mineral N levels in ex-arable fields. The decrease in topsoil soil test values after pasture renewal will be site-specific and dependent upon (1) the degree of vertical stratification of SOM and nutrients in the old pasture soil profile, and (2) the depth of tillage. In the studies of Zhang et al. (Citation2009) and Milligan et al. (Citation2017), only a few selected major nutrients were studied and/or there was minimum information presented on the subsequent implication of the fertility changes on nutrient uptake, and crop/pasture production. In addition, these authors did not quantify the nutrient cycling processes, such as the gains and/or losses of nutrients from the new plant root zone that could return soil test values towards their original values. Gains or losses will be controlled by the selection of crop and pasture species, their management, fertiliser use and the rate at which plant uptake and excreta return by grazing animals recycle nutrients to the soil surface. More information is needed on the sequence of changes in soil test values with depth when different tillage systems are used for pasture renewal and whether these changes are reflected in subsequent crop and new pasture yields, particularly if deeper mouldboard ploughing (25– 40 cm) is adopted to sequester more C in grazed pasture soils or to mitigate high Cd concentrations in some pasture soils (Peng et al. Citation2023).
In New Zealand, several field-scale trials were set up to evaluate the influence of FIT, NT, and ST at pasture renewal on soil C stocks, as well as agronomic and environmental performance (e.g. changes in nitrate leaching, nitrous oxide emissions) of pastoral systems (Beare et al. Citation2020; McNally et al. Citation2020; Calvelo-Pereira et al. Citation2022). Three of these ongoing field experiments (Calvelo- Pereira et al. Citation2019; Calvelo-Pereira et al. Citation2022), in which crop and pasture yields have been measured, provide an opportunity to measure the short-term impact of FIT on SOC stratification and nutrient redistribution, soil fertility, and subsequent crop/pasture nutrient uptake. It was hypothesised that (1) in the short-term, pasture renewal using FIT causes greater reduction in soil test values in the standard pasture soil sampling depth (0–7.5 cm) when compared to pasture renewal using NT or ST, and (2) if topsoil test values drop below the critical range recommended for optimum plant growth, yields and nutrient uptake by crops and pasture will be reduced.
Materials and methods
Brief description of study sites, establishment, and monitoring
During 2016–2018, three replicated field trials (Trial 1–3) were established on commercial farms with long-term pastures (a mixture of perennial ryegrass (Lolium perenne L.) and white clover (Trifolium repens L.)) under livestock grazing management. The trials were designed to study the impact of pasture renewal (with or without a crop phase) that compare FIT with either (1) other tillage practices of contrasting intensity; and/or (2) continuous pasture (CP, no renewal). A detailed description of each trial can be found elsewhere (Calvelo- Pereira et al. Citation2019; Calvelo-Pereira et al. Citation2022). summarises main management activities carried out at each trial site until December 2018. summarises main soil properties prior to the start of each trial.
Figure 1. Management calendar describing main activities for all plots, including specific tillage operations at FIT plots. Fertility sampling (S) occurred following the renovation of pastures, approximately 18–, 13–, and 8–months following tillage for Trials 1, 2 and 3, respectively.
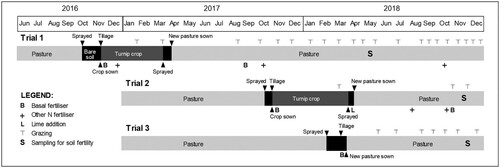
Table 1. Soil chemical properties determined for each trial site prior to the tillage treatments and fertility assessments (from Calvelo- Pereira et al. Citation2019; Calvelo-Pereira et al. Citation2022).
Trials 1 (40°23″46.79″S 175° 36″35.77″E) and 3 (40°23″46.79″S 175° 36″27.48″E) were established at Massey University’s Dairy Farm 4 (approximately 5 km away from Palmerston North, Manawatu Region), on an Alfisol soil, a Typic Fragiaqualf (Soil Survey Staff Citation2014). Mean annual rainfall and temperature at the Palmerston North Region (average 30 years) are 967 mm and 13°C, respectively (National Institute of Water and Atmospheric Research Citation2024). Trial 2 was established on a commercial sheep and beef farm near Maxwell (Taranaki/Whanganui Region; 39°47″46.50″S 174°54″1.62″E) on an Andisol soil, a Typic Hapludand (Soil Survey Staff Citation2014). Mean annual rainfall and temperature at the Taranaki/Whanganui Region (average 30 years) are 882 mm and 14°C, respectively (National Institute of Water and Atmospheric Research Citation2024).
The management activities of the renewal practice included (Trial 1–3) spraying of the old pasture with glyphosate prior to any tillage or sowing (either crop and/or pasture). All sowing used a seed drill, with disc openers. At Trial 1, the renewal practice (starting in October 2016) involved the planting of leafy turnips (hybrid Brassica campestris var. Hunter) as a summer forage crop, and then an autumn pasture reseeding (). The tillage treatments used were: (1) NT, or direct drilling of seeds; (2) ST, which involved rotary hoeing to a depth of approximately 5 cm prior to seed drilling; and (3) FIT, which used a Clough, single-furrow (Trials 1 and 2) mouldboard plough fitted with a disc coulter and skimmer in front of each mouldboard capable of ploughing to approximately 25–30 cm depth. Both the disc coulter and skimmer were set to transfer topsoil (5–7.5 cm) into the bottom of the furrow and then the mouldboard covered the transferred topsoil with subsoil. A rotatiller was used to prepare and mix broadcast fertiliser into the ST and FIT seedbeds. Tillage treatments were used for preparation of the soil for sowing the turnip crop and were assigned randomly to replicated plots (NT and FIT, n = 5; ST, n = 4) of ca. 0.09 ha size. At Trial 2, the renewal practice involved the same grass-crop-grass rotation as in Trial 1, and preparation for the crop started in October 2017 (). The tillage treatments (NT, ST, FIT as described above) were assigned in three strips along a slope gradient and thereafter divided into 5 sampling blocks (n = 5, ca. 0.03 ha per experimental plot). At Trial 3, the pasture renewal practice involved a grass-grass rotation, using a continuous pasture (CP) as control treatment, i.e. no pasture renewal. Trial 3 included the NT and FIT tillage treatments described above; however, the FIT treatment at Trial 3 employed a customised, Lemken Europal, three furrow reversible mouldboard plough, capable of ploughing (furrow depth) to approximately 30–35 cm depth with disc coulters and skimmers set to transfer topsoil (0–7.5 cm) into each furrow bottom. This is a lower depth than that achieved with the plough used in Trials 1 and 2. Treatments (NT, FIT and CP) were assigned randomly to replicated experimental plots (n = 4) of ca. 0.06 ha size.
Crop and pasture growth (Trials 1 and 2) or pasture only growth (Trial 3) was monitored regularly, and grazing management (including fertiliser addition) followed each farm’s best practice (, ; see also Calvelo- Pereira et al. Citation2019; Calvelo-Pereira et al. Citation2022).
Assessment of selected pasture fertility parameters, and changes in C and N
In order to assess the effect of tillage treatments () on changes in C and N stocks as well as selected soil tests (cation exchange capacity (CEC), exchangeable basic cations, soil pH and Olsen P), a soil sampling campaign was conducted during May to November 2018, approximately within 18, 13 and 8 months following the tillage treatments for Trials 1, 2 and 3, respectively ().
Soil sample collection and analyses
Soil sampling
A total of 12 plots (four replicate plots per treatment) were selected for soil sampling at each trial. All soil cores were collected with a percussion corer to a depth below 30 cm. Two diagonal transects were used when sampling each plot, with between four to six soil samples collected along each transect to give a total of eight to twelve soil cores per plot. Each soil core was then cut into 7.5 cm depth increments (0–7.5, 7.5–15, 15–22.5 and 22.5–30 cm) and placed in labelled plastic bags (one composite sample per depth increment). The composite samples were air-dried, gently crushed, sieved (<2-mm), and homogenised prior to all laboratory measurements.
Chemical analyses
Total C and N concentrations were determined, on ground (<0.5 mm) subsamples, with a Vario MACRO cube elemental analyser (Elementar Analysensysteme GmbH, Hanau, Germany). The total C and N stocks at each depth (Mg ha−1) were calculated in an equivalent soil mass (Ellert and Bettany Citation1995; Wendt and Hauser Citation2013), using the corresponding soil bulk density (dried at 105°C), determined at each experimental plot. Exchangeable basic cations, pH, and Olsen P were determined following standard techniques (Blakemore et al. Citation1987). The exchangeable basic cations (Calcium, Ca; Magnesium, Mg; Potassium, K and Sodium, Na) and CEC were measured using the semi-micro leaching technique. Briefly, 50 mL of 1 M ammonium acetate solution (pH 7) was passed through a mixture of 1 g soil and acid-washed silica sand packed in semi-micro leaching tubes with moist filter paper plug. Leachates were collected, pH measured, and an aliquot taken for Ca, Mg, K and Na concentrations to be measured using microwave-plasma atomic emission spectroscopy (4200 MP-AES, Agilent Technologies, Singapore). The pH change in the collected leachate was used to calculate exchangeable acidity (Schollenberger and Simon Citation1945). The CEC (cmolc kg−1) was determined as the sum of the basic cations and exchangeable acidity expressed as ‘H+ ions’. Soil pH was measured using a soil: solution ratio of 1:2.5, involving 10 g of air-dried (<2 mm soil) and 25 mL of de-ionised water. Soil Olsen P concentration was determined using the method described by Blakemore et al. (Citation1987).
Nutrient recycling by grazing
For each trial, a modified version of the model of Salazar et al. (Citation2010) was used to estimate the rate of nutrient recycling from fodder crop and pasture grazing events in the period between tillage and soil sampling. The model considers all components of the stock daily diet (e.g. amounts of supplementary feeds, fodder crop and/or pasture intake) to calculate the daily ingested nutrient load. Crop and pasture yields and nutrient contents were averaged within a tillage treatment to estimate the effect of treatments on feed quantity and amounts of nutrients ingested. Nutrient amounts in animal products (e.g. meat and milk) are deducted from total intake, and the remaining nutrients are assumed to be deposited in excreta, which is allocated to areas (raceways, yards, milking shed, and grazing areas (turnip crop and pasture)) based on the time the animals typically spend in each area. The daily data for the dairy cow locations and diets in Trials 1 and 3 were supplied by staff of the Massey University Dairy Farm 4. For Trial 2, the turnip and the renewed pasture areas were rotationally grazed by sheep or young bulls, with animals spending time only on these areas.
Statistical analyses
Minitab 18 statistical software (Minitab LLC, Pennsylvania, USA) was used for statistical analyses; GraphPad Prism Version 7 (GraphPad Software, San Diego, USA) was used to prepare the graphs. Total C and N concentrations and the soil fertility variables were analysed using a two-way ANOVA test involving treatments (Trial 1 and 2: NT, ST, and FIT; Trial 3: NT, CP and FIT) and the four soil depths (0–7.5, 7.5–15, 15–22.5 and 22.5–30 cm). For each trial, differences in total C and N stocks in the 0–7.5 cm or total 0–30 cm nominal soil depths caused by the corresponding treatments were tested using a one-way ANOVA. The relationship between soil C and CEC of the soils was established using a linear regression model. All analyses were run at a 5% significance level and where means were significantly (P < 0.05) different, Tukey’s HSD was used to separate the means.
Results
Changes in total soil C and N
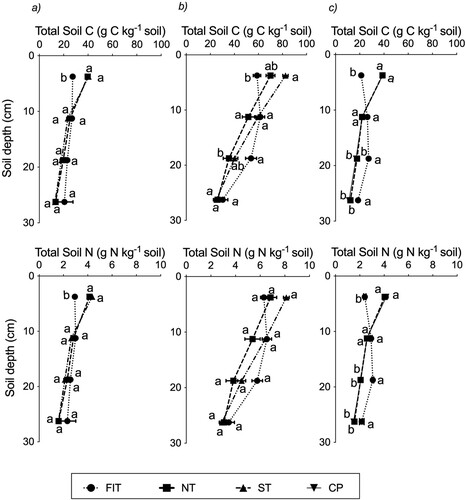
At all three trials, the vertical distribution of both total C and N were significantly (P < 0.001) affected by the tillage treatments and permanent pasture, with the values for the FIT treatment being more uniform with soil depth, compared with the other treatments (). At Trial 1, the average concentrations of C and N in the 0–7.5 cm soil depth for the FIT treatment were 27.4 g C kg−1 and 2.9 g N kg−1 soil, respectively, or 30% lower compared to the NT treatment (a). In this soil depth, these equate to differences of 8.6 Mg C ha−1 and 0.9 Mg N ha−1 between NT and FIT (Table S1). However, average C and N stocks for the 0–30 cm nominal depth at equivalent soil mass were unaffected by tillage, being on average 96.3, 93.6 and 95.9 Mg C ha−1 and 10.7, 10.6 and 10.6 Mg N ha−1 for NT, ST, and FIT treatments, respectively (Table S1). At Trial 2, tillage effect was only significant for total C. The average concentration of soil C in the 0–7.5 cm soil depth under the FIT treatment was 58.8 g C kg−1 soil, or 16% lower compared to the NT treatment, i.e. a difference of 4.4 Mg C ha−1; b; Table S1). In Trial 2, the average C stocks for the 0–30 cm nominal depth at equivalent soil mass did not change with tillage and were 118.1, 124.6 and 123.4 Mg C ha−1 for NT, ST, and FIT treatments, respectively (Table S1). At Trial 3, the average concentration of C and N in the 0–7.5 cm soil depth under the FIT treatment were 21.2 g C kg−1 and 2.4 g N kg−1 soil, which were 45% and 40% lower compared to the NT treatment, respectively, i.e. a difference of 9.4 Mg C ha−1 and 0.8 Mg N ha−1, respectively (c; Table S1). As in Trials 1 and 2, the average C and N stocks for the 0–30 cm nominal depth at an equivalent soil mass did not change with tillage and were 81.8, 78.7 and 85.6 Mg C ha−1 and 9.3, 9.2 and 9.7 Mg N ha−1 for NT, CP, and FIT treatments, respectively (Table S1).
Figure 2. Distribution of total soil C and N concentrations with soil depth under tillage treatments and CP at (a) Trial 1 (b) Trial 2 and (c) Trial 3. At a given trial and soil depth interval, plotted points (means and standard error of mean) with the same letter(s) are not significantly (P > 0.05) different.
Changes in soil pH
Across the three trials, values of soil pH were similar between treatments (). Soil pH in the Alfisols (Trials 1 and 3) were not strongly stratified with depth (). At Trial 1, there was a general trend of pH increasing with depth for the FIT treatment and decreasing with depth for the other two tillage treatments up to the 22.5 cm soil depth. At the standard pasture soil sampling depth (0–7.5 cm), pH was 5.72, 5.70 and 5.64 for the NT, ST, and FIT treatments, respectively, well below the pH measured prior to the establishment of the trials (6.15; ). At Trial 2 (Andisol), there was a general trend of pH decreasing with soil depth for all three treatments ().
Table 2 . Vertical depth distribution of average pH, CEC, Ca, Mg, K and Na, and bulk density (BD) under tillage treatments and CP at each trial. At a given trial, variable, and soil depth interval, means with no or same letter(s) are not significantly (P > 0.05) different.
Changes in cation exchange capacity
At Trials 1 and 2, the effect of tillage treatments on CEC was not significant at any of the soil depths, while in general CEC values for the FIT treatments were less stratified than the other two treatments (). At Trial 3, the vertical distribution of CEC was affected (P = 0.002) by all treatments, with NT and CP showing a general trend of decreasing CEC with soil depth, while values of CEC were less stratified for FIT (). In the 0–7.5 cm depth, CEC for the FIT treatment was 12.8 cmolc kg–1 soil, or 38% lower (P < 0.01) compared to the NT treatment. In both 15–22.5 and 22.5–30 cm soil depths, the CEC values for the FIT treatment were similar as in the NT treatment. The CEC (0–7.5 cm) for the CP treatment was 17.5 cmolc kg−1 soil, which was not significantly different from the NT treatment ().
Changes in exchangeable basic cations
The vertical distribution of exchangeable cations was similar to that of CEC. Cation concentrations were particularly higher in the 0–7.5 cm depth, in the NT and CP treatments, compared to the FIT treatment (). A significant (P < 0.05) effect of FIT reducing topsoil exchangeable cation values was shown only for Mg (Trial 1, Trial 3) and for K (Trial 3) (). The average exchangeable Mg value (0–7.5 cm depth) for the NT treatments were 1.5–1.9 cmolc Mg kg−1 soil, which were reduced by 29%–43% to 1.1 cmolc M kg−1 soil for the FIT treatments across these two trials. At Trial 3, the average exchangeable K value (0–7.5 cm soil depth), for the NT treatment was 0.71 cmolc K kg−1 soil, which was reduced by 65% to 0.25 cmolc K kg−1 soil for the FIT treatment.
Changes in Olsen P
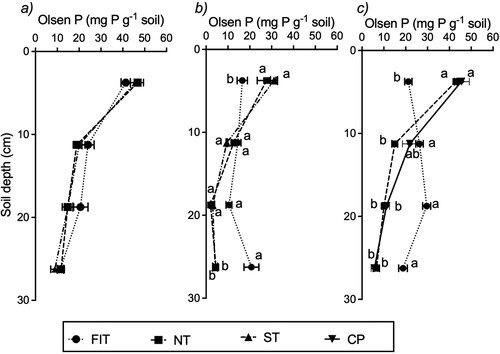
At Trial 1, Olsen P concentrations decreased with depth and all tillage treatments showed (1) similar concentrations and (2) a high degree of vertical stratification of P (a). In Trials 2 and 3 the distribution of Olsen P concentrations with depth was significantly (P < 0.001) affected by the tillage treatments (b and c). For the NT and ST (Trial 2) and for NT and CP treatments (Trial 3), Olsen P concentrations were similar, decreasing with soil depth. In contrast, the concentrations of Olsen P were more uniform with soil depth under FIT (b and c). In the 0–7.5 cm soil depth, the average Olsen P under the FIT treatment were 40%–51% lower (P = 0.001) than that for NT treatment, being 16.6 mg P kg−1 soil compared to 27.7 mg P kg−1 soil at Trial 2, and 21.2 mg P kg−1 soil compared to 42.9 mg P kg−1 soil at Trial 3, respectively. In the 15–22.5 and 22.5–30 cm depths, however, the average Olsen P concentrations under the FIT treatment were 65%–80% higher (P < 0.001) (b and c). For Trial 2, Olsen P (22.5–30 cm depth) was 20.8 mg P kg−1 soil for the FIT treatment compared to 4.5 mg P kg−1 soil for the NT treatment; for Trial 3, these values were 18.8 and 6.6 mg P kg−1 soil, respectively. For Trial 3, the Olsen P concentration in the 15–22.5 cm soil depth was also higher (P < 0.05) for the FIT treatment (29.6 mg P kg−1 soil) compared to the NT treatment (10.1 mg P kg−1 soil) (b and c).
Return of nutrients by grazing
The estimated amounts of nutrients from the turnip crop that grazing management returned in excreta to the soil surface prior to sowing the new grass are given in . For Trial one, 11 kg P, 115 kg K, and 11 kg Mg were returned per ha for the NT treatment, while 16 kg P, 167 kg K, and 15 kg Mg were returned per ha for the FIT treatment. For Trial 2, 28 kg P, 299 kg K, and 24 kg Mg were returned per ha for the NT treatment, and 21 kg P, 340 kg K, and 30 kg Mg were returned per ha for the FIT treatment ().
Table 3 . The amounts (kg ha−1) of nutrients applied in fertiliser and transferred by grazing animals during the periods of seedbed preparation and crop and pasture growth in Trial 1(grazed by dairy cows), Trial 2 (grazed by young bulls and sheep), renewal: old pasture – summer leafy turnip crop – new pasture, and Trial 3 (grazed by dairy cows), renewal: old pasture –new pasture.
The amounts of nutrients from the new grass that grazing management returned in excreta to the soil surface were variable (). For Trial 1, 35 kg P, 344 kg K, and 32 kg Mg were returned per ha for the NT treatment, while 33 kg P, 167 kg K, and 32 kg Mg were returned per ha for the FIT treatment. For Trial 2, 2 kg P, 37 kg K, and 2 kg Mg were returned per ha for the NT treatment, and 2 kg P, 28 kg K, and 1 kg Mg were returned per ha for the FIT treatment. For Trial 3, 27 kg P, 284 kg K, and 17 kg Mg were returned per ha for the NT treatment, and 25 kg P, 289 kg K, and 15 kg Mg were returned per ha for the FIT treatment ().
Discussion
Changes in total soil C and N contents
Pasture renewal using FIT changed the vertical redistribution of SOM, thus, reducing C and N storage in the topsoil () but the stocks in the 0–30 cm nominal soil depth remained similar (Table S1). Similar observations were made by Alcántara et al. (Citation2017) and Calvelo-Pereira et al. (Citation2022). The Andisol (Trial 2) stored more C than the Alfisol (Trials 1 and 3), features also observed elsewhere under pasture on flat to rolling land in New Zealand (Schipper et al. Citation2017) and attributed to organic matter bound to allophane in Andisols (Percival et al. Citation2000). At Trial 3, the greater (45%) reduction in C concentration (0–7.5 cm depth) for the FIT treatment, compared with Trials 1 and 2, was possibly due to the use of a different mouldboard plough to implement FIT at Trial 3, which placed the topsoil in the furrow bottom to a lower soil depth (30–35 cm on average). In any case, FIT has created a significant ‘gap’ in topsoil C and a significant ‘gain’ in subsoil C stock (). If, with time, both (1) the ‘gap’ is re-filled through C inputs (pasture litter and roots, ruminant dung) to form new SOM (Bai and Cotrufo Citation2022), and (2) the subsoil ‘gain’ in C has a slower turnover time (Kirschbaum et al. Citation2021), then there is potential for increasing soil C sequestration (Lawrence-Smith et al. Citation2021). Whether this extra C sequestration in pasture soils can be achieved without adverse effects on agronomic production will depend on nutrient distribution and soil properties such as pH and CEC (Curtin et al. Citation2015; Bertrand et al. Citation2019; Basile-Doelsch et al. Citation2020).
Changes in soil pH
In the Alfisol at Trial 1, processes such as nitrification (following enhanced mineralisation from cultivation), N fertiliser addition and urine return on the newly established grazed pastures during approximately 13 months () caused soil acidification (Bolan et al. Citation1991). Contrastingly, in the Alfisol at Trial 3, soil pH was relatively unchanged, possibly due to less time (8 months) for acidification to occur. In addition, the uniform distribution of pH with depth (0–30 cm) for the CP treatment would indicate a limited potential for soil inversion to influence pH.
In the Andisol (Trial 2), the distribution of soil pH with depth was independent of tillage treatments and showed stratification with depth (). The application of 3.1 t lime ha−1 after the tillage treatments were conducted (; Calvelo-Pereira et al. Citation2022) explains the high pH values in the 0–7.5 cm soil depth for all treatments (NT: 6.10, ST: 6.05; FIT: 6.32) compared to the pH measured prior to the commencement of this trial (5.70; ). In the Andisol, following FIT, pH buffering in the top 0–7.5 cm soil depth decreased due to reduction in soil C (see below; Curtin and Trolove Citation2013), while soil inversion increased pH at depth.
Changes in soil pH stratification with tillage will be site-specific; in general, in this study the original soil profiles showed mostly a uniform distribution of pH. In these conditions, unless the sites had recently received lime application, FIT has little potential to re-distribute soil pH and increase surface soil acidity. In addition, where FIT brings up subsoil with a low pH buffer capacity (low C concentration), there may be a reduced lime requirement to correct any soil acidity that subsequently develops.
Changes in cation exchange capacity
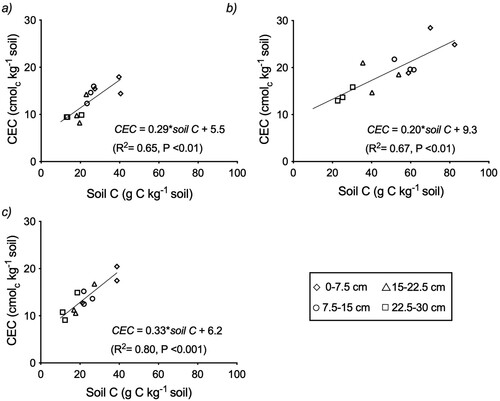
For crop and pasture growth and grazing animal health it is important that topsoil CEC can retain sufficient available pools of K, Mg, Ca, and Na. The CEC values of the soils at each trial site, similar to other New Zealand topsoils, are strongly related to their SOM content () (Parfitt et al. Citation1995). There was a moderate to strong dependence (Trial 1: R2 = 0.65; Trial 2: R2 = 0.67; Trial 3: R2 = 0.80; P ≤ 0.01) of CEC on soil C across trial sites (). Different intercepts for Trial 2 compared to Trial 1 and 3 reflect differences in soil mineralogy for the Andisol and Alfisol, respectively. The regression equations indicate that reducing soil C by 1 kg decreases CEC by 290, 200 and 330 cmolc kg−1 C at Trials 1, 2 and 3, respectively, which on average (273 cmolc kg−1 C) is similar to the values of 300 cmolc kg−1 C and 282 cmolc kg−1 C reported by Curtin and Rostad (Citation1997) and Helling et al. (Citation1964), respectively. In the current study, the contribution of soil C to CEC in the topsoil (0–7.5 cm depth) ranged from 60%–68% of total CEC for the NT treatment, which was reduced to 53%–59% for the FIT treatment across the three sites. The CEC values from C alone were estimated to be 11.7, 14.0 and 12.9 cmolc kg−1 soil for the NT treatment at Trials 1, 2 and 3, respectively. These values were reduced by 16%–46% (2.2–5.9 cmolc kg−1 soil) to 8.1, 11.8 and 7.0 cmolc kg−1 soil at Trials 1, 2 and 3, respectively, for the FIT treatment. Thus, by inverting the soil, FIT temporarily reduces cation retention (Curtin et al. Citation1996) in the new topsoil. However, topsoil CEC is expected to return to previous levels as new C is stored in the root zone.
Figure 3. Regression outputs between CEC and soil C at (a) Trial 1 (b) Trial 2 and (c) Trial 3, using data from the various depth intervals. **P < 0.01, ***P < 0.001.
Changes in exchangeable basic cations
As expected, FIT temporarily reduces the topsoil nutrient cation concentration when soils with a strong vertical stratification of cation concentration are ploughed (). If this reduction is addressed with a fertiliser application (e.g. at Trial 1, where an additional 60 kg K ha−1 was applied to FIT treatment only, ), then the impact on crop and pasture yields can be minimised. If the nutrient reduction is not addressed by fertiliser application, it can lead to low topsoil cation concentration (Trials 2 and 3, ), which, if sub-optimal, could impact subsequent plant yield. This effect will be site-specific. In this study at Trial sites 1 and 2, soil test values for K and Mg in topsoils (0–7.5 cm, ) post-FIT were at or above soil test ranges recommended for optimum pasture growth (0.35– 0.55 cmolc K kg−1 soil for Alfisols, 0.50– 0.70 cmolc K kg−1 soil for Andisols; 0.40– 0.50 cmolc Mg kg−1 soil for all soils, Roberts and Morton Citation2016). Deeper in the profile, the soil test values for the subsoil (15–30 cm depth) commonly fell below optimum values (). A factor to consider is that in the 18 months post tillage and prior to soil testing at Trial 1, the in-situ grazing of the turnip crop by strip grazing cows (4 h/day) plus nine pasture grazing events recycled (through plant uptake and excreta return) large amounts of K (). In addition, an estimated average of 124 kg K ha−1 was added as fertiliser and recycled to the surface of the FIT plots (). This would be expected to cause a relative change in the 0–7.5 cm depth soil tests of 0.10 cmolc K kg−1 soil (Roberts and Morton Citation2016). This partly explains why the 0–7.5 cm K value for the FIT treatment was in the range 0.50 cmolc K kg−1 soil, as in other treatments, and different from the low value (<0.30 cmolc K kg–1) of the subsoil pre-ploughing. In comparison, at Trial 3, in the 6 months prior to soil testing, there were only six grazing events by dairy cows, which recycled less K than in Trial 1 (). No additional amounts of K were recycled to the surface soil of the FIT plots before soil testing (no K fertiliser added; ), which partly explains why the topsoil exchangeable K of the FIT treatment in Trial 3 remained around the lower end of the target range for optimum pasture production (, ). Conversely, the topsoil Mg value for the FIT treatment at Trial 3 was well above the target range (0.40–0.50 cmolc Mg kg–1 soil) required for optimum pasture production and within the ideal range of animal health (1.0–1.2 cmolc Mg kg−1 soil, ; Roberts and Morton Citation2016).
The lack of a significant difference for Ca is consistent with FIT receiving higher amounts of Ca from applied fertilisers relative to the other tillage treatments at Trial 1 (, ; 16% Ca applied when using Kynofos 21-mono dicalcium phosphate; see Calvelo-Pereira et al. Citation2022) and the farmer’s application of lime approximately 8 months before sampling at Trial 2 (). However, the higher Ca concentrations for FIT below 7.5 cm depth are the result of soil inversion ().
Changes in Olsen P
In Trial 1, all topsoil (0–7.5 cm depth) Olsen P values (corrected for bulk density; ) remained above the optimum range for both pasture and Brassica growth (i.e. 20–25 mg P L−1, for sedimentary soils, Roberts and Morton Citation2016; Morton et al. Citation2020). An additional 30 kg P ha−1 was added as basal fertiliser to FIT plots only (). This extra P could raise Olsen P values by 5–8 units in an Alfisol topsoil (sedimentary soil, Roberts and Morton Citation2016), which partly explains the 0–7.5 cm depth Olsen P values (). However, in Trials 2 and 3, initial soil test suggested no additional fertiliser P was needed following FIT (), and thus topsoil Olsen P (b and c) reflects the low values (<20 mg P kg−1 soil) of the subsoil brought to the surface following FIT. Results for Trials 2 and 3 are consistent with topsoil burial at depth in the FIT treatment, representing the transfer of a substantial amount (about 21 mg P kg−1 soil) of potentially plant available P from the standard soil sampling depth of 0–7.5 cm to lower soil depths.
Figure 4. Distribution of Olsen P concentrations with soil depth under the tillage treatments and CP at (a) Trial 1 (b) Trial 2 and (c) Trial 3. At a given Trial and soil depth interval, plotted points (mean and standard error of mean) with the same or no letter(s) are not significantly (P > 0.05) different.
As with the total C and N, relative changes described for Olsen P were the result of the highly stratified nature of P in long-term pastures (Loganathan and Hedley Citation1997) and, for Trial 3, the tillage effect of a plough customised to achieve a high degree of soil inversion. The observations at Trials 2 and 3 are consistent with findings of Milligan et al. (Citation2017), Zhang et al. (Citation2009) and McDowell and Smith (Citation2023), who reported decreased surface soil P concentrations following either FIT or standard mouldboard ploughing. It is acknowledged that in the 7.5–15 cm soil depth, the Olsen P concentration under the FIT treatment increased relative to the other two tillage treatments (), and that this P may also be available for uptake by crop and pasture roots. However, this P transferred below 7.5 cm would not be measured in the standard pasture sampling depth and, therefore, unaccounted for when determining fertiliser requirements for pasture maintenance. For example, in the 0–7.5 cm soil depth of Trial 2, the Olsen P concentration (∼12 mg P L−1 soil, corrected for a bulk density of 763 kg m−3; ) of the FIT plots is below the recommended range for optimum pasture growth on Andisol soils (Ash soils, 20–30 mg P L−1 soil; Morton and Roberts Citation2016). Using the relationship between Olsen P and relative pasture yield for ‘Volcanic soils ‘ developed by Edmeades et al. (Citation2006), it is predicted that this Olsen P value of 12 mg P L−1 soil would support a relative yield of 90%. To avoid any pasture yield reduction in this high phosphate retaining soil (anion storage capacity 80%, ), Morton and Roberts (Citation2016) would recommend a minimum capital fertiliser P application of ∼ 60 kg P ha−1. In the case of Trial 3, the Olsen P value corrected for a bulk density of 1312 kg m−3 () for the FIT treatment was ∼28 mg L−1 and within the optimum range (Sedimentary soils, Roberts and Morton Citation2016). Using relationships between Olsen P and relative pasture yield for ‘Sedimentary soils’ developed by Edmeades et al. (Citation2006) and/or McDowell and Smith (Citation2023), it is predicted that an Olsen P value of 28 mg P L−1 soil would support a relative yield of >97%, and then no capital fertiliser P addition would be recommended. Overall, when topsoil nutrient concentrations, although decreased by FIT relative to NT and ST, stay within the agronomic optimum ranges, they are unlikely to impact negatively on crop and pasture yields. However, the Olsen P value of 43 mg P kg−1 soil on the NT treatment at Trial 3 on the Alfisol, represents a P runoff risk compared to the Olsen P value of 21 mg P kg−1 soil on the FIT treatment (McDowell and Smith Citation2023). According to relationships between Olsen P values and P concentrations in sub-surface and overland flow, developed by McDowell and Condron (Citation2004), FIT would have reduced the P runoff risk by 49% and 35%, respectively, compared to NT.
Nutrient uptake by turnip crop and renewed pasture
The nutrient concentration of the plants in Trials 1 and 2 () was in general within the recommended ranges (exceptions: percentage P in the NT treatment and percentage Mg in most treatments, Trial 1) reported by Morton et al. (Citation2020) for leafy turnip in a series of trials conducted in New Zealand. There were also significant tillage treatment effects on the percentage of P in turnip plants at 111 days of growth at Trial 1, and the percentage N, P, and K at 65 days of growth at Trial 2 (; Table S3). Given these leaf nutrient concentrations, and the 0–15 cm soil test values (; ), which fell within the range recommended for Brassica crops (Morton et al. Citation2020), suggest that FIT treatment is unlikely to constrain nutrient supply to the deeper rooting crop. At Trials 1 and 2 (), FIT increased turnip crop yields, as well as N, P, K and Mg uptake (Calvelo-Pereira et al. Citation2022).
Figure 5. Element concentration (%): (a) N, (b) P, (c) K, and (d) Mg for crop and pasture herbage samples. For each element, the ranges of concentration highlighted correspond to normal range for Brassica and optimum range for mixed pasture (Morton and Roberts Citation2016; Roberts and Morton Citation2016; Morton et al. Citation2020).
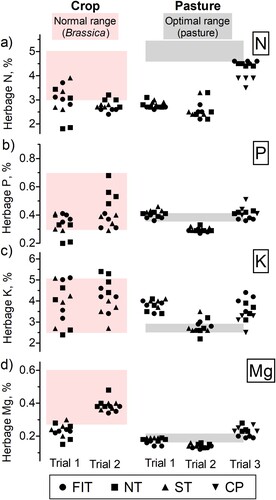
Table 4. Mean herbage dry matter (DM, kg ha−1) and nutrient (N, P, K, Mg, kg ha−1) accumulated in the crop phase and first pasture grazing in Trial 1(grazed by dairy cows), Trial 2 (grazed by young bulls and sheep), renewal: old pasture – summer leafy turnip crop – new pasture, and Trial 3 (grazed by dairy cows), renewal: old pasture – new pasture. For each variable, considering either crop or pasture and each trial independently, the effect of treatment (i.e. NT, ST, FIT, or CP) was tested following a one-way ANOVA; at a given trial, herbage, and variable, means with no or same letter(s) are not significantly (P > 0.05) different.
At all trial sites, the first pasture harvest of the new grass showed herbage N concentrations below the recommended range for optimum growth (), suggesting limited supply of N. Contrastingly, the amounts of P, K and Mg from the crop returned in excreta were relatively high (), which may explain why P, K and Mg concentrations of the new grass were within or above the recommended range for optimum plant growth (). For Trial 2, however, P and Mg concentrations were lower than the recommended range.
Decisions on additional nutrient requirement associated with soil inversion
This research demonstrated that FIT redistributes SOC and nutrients within the soil profile, which may have implications for future fertiliser requirements. For Trial 1, after initial soil testing showed a highly stratified Olsen P and exchangeable K profile, with sub-optimal P and K values in the subsoil, a low-risk approach was used to ensure the that FIT did not result in sub-optimal nutrient availability in the new seedbed. This involved using recognised methods (Roberts and Morton Citation2016) to calculate the additional amounts of P and K fertiliser required during seedbed preparation to adjust Olsen P and exchangeable K values to optimal levels for pasture establishment and production. For Trial 2, soil test values were less stratified and hence no additional fertiliser was needed during seedbed preparation. In Trial 3, the initial soil testing () indicated highly stratified nutrient availability in the soil profile, with low P and K concentrations in the subsoil which remained within the recommended ranges, and therefore no remedial addition P and K fertiliser was required during seedbed preparation. For Trials 1 and 2 the Brassica crop grown after FIT had higher yield and nutrient uptake (; Calvelo-Pereira et al. Citation2022) than the two other tillage treatments. Pasture renewal that includes a summer forage crop following tillage may create advantages for maintaining topsoil nutrient concentrations. The deeper rooting Brassica has ability to recover nutrients from the buried topsoil (Calvelo-Pereira et al. Citation2022). Contrastingly, in Trial 3 (grass to grass renewal), nutrient recovery by the new grass was lower for the FIT treatment than for the NT treatment (), and the yield of the renewed pasture was reduced.
Conclusions
In long-term grazed pastures, which have a high degree of SOC and nutrient stratification within the ploughing depth, using FIT for pasture renewal can modify the vertical distribution of soil C and N, exchangeable Mg and K, as well as Olsen P soil test values, compared to no-till or shallow tillage methods. This redistribution of subsoil can result in sub-optimal topsoil test values, for crop and pasture growth, but reduces the risk of P loss to surface water. Whether FIT creates topsoils with sub-optimal soil test values is site-specific and should be determined by pre-cultivation soil testing of the intended ploughing depth. Where yield reduction is predicted from sub-optimal topsoil fertility following FIT, fertiliser inputs during seedbed preparation can be used to adjust soil fertility. In the current study, on well-maintained pastures, only moderate or nil increases in fertiliser and lime were needed to achieve optimum soil test levels after FIT, compared to no-till or shallow tillage methods. Therefore, the use of FIT for pasture renewal as a management option for C sequestration, is not expected to be constrained by added fertiliser costs. A wider range of trials in contrasting pedoclimatic conditions are recommended to investigate constraints to optimal seedbed preparation before FIT is implemented to stimulate soil C sequestration in long-term pastures.
Supplementary table 1
Download MS Word (23.5 KB)Acknowledgements
We are grateful to the Farmed Landscapes Research Centre technician team (Massey University), Massey Dairy Farm 4 staff and Massey University collaborators, Lynch family and Lynch farm staff. We also thank the Soil Science Department’s Laboratory staff, especially Ian Furkert and Quang Mai for their assistance during the laboratory and field works.
Disclosure statement
No potential conflict of interest was reported by the author(s).
Data availability
The data from this study are available upon request.
Additional information
Funding
References
- Alcántara V, Don A, Vesterdal L, Well R, Nieder R. 2017. Stability of buried carbon in deep-ploughed forest and cropland soils-implications for carbon stocks. Scientific reports. 7:5511–5511.
- Alcántara V, Don A, Well R, Nieder R. 2016. Deep ploughing increases agricultural soil organic matter stocks. Global change biology. 22:2939–2956.
- Bai Y, Cotrufo MF. 2022. Grassland soil carbon sequestration: current understanding, challenges, and solutions. Science. 377:603–608. doi:10.1126/science.abo2380.
- Basile-Doelsch I, Balesdent J, Pellerin S. 2020. Reviews and syntheses: the mechanisms underlying carbon storage in soil. Biogeosciences (online). 17:5223–5242.
- Beare MH, McNally SR, Tregurtha C, Gillespie R, van der Klei G, Calvelo- Pereira R, Hedley MJ. 2020. The agronomic and environmental benefits and risks of autumn pasture renewal with full inversion tillage. In: CL Christensen, D Horne, R Singh, editors. ‘Nutrient management in farmed landscapes. Palmerston North, New Zealand’, 2020. Palmerston North, New Zealand: Farmed Landscapes Research Centre, Massey University; p. 6.
- Bertrand I, Viaud V, Daufresne T, Pellerin S, Recous S. 2019. Stoichiometry constraints challenge the potential of agroecological practices for the soil C storage. A review. Agronomy for Sustainable Development. 39:54.
- Blakemore LC, Searle PL, Daly BK. 1987. Methods for chemical analysis of soils. Lower Hutt, New Zealand: NZ Soil Bureau, Department of Scientific and Industrial Research.
- Bolan NS, Hedley MJ. 1998. Developments in some aspects of reactive phosphate rock research and use in New Zealand. Australian Journal of Experimental Agriculture. 37:861–884.
- Bolan NS, Hedley MJ, White RE. 1991. Processes of soil acidification during nitrogen cycling with emphasis on legume based pastures. Plant and soil. 134:53–63.
- Calvelo-Pereira R, Hedley MJ, Arbestain MC, Bishop P, Enongene KE, Otene IJJ. 2018. Evidence for soil carbon enhancement through deeper mouldboard ploughing at pasture renovation on a Typic Fragiaqualf. Soil Research. 56:182–191.
- Calvelo- Pereira R, Hedley MJ, Hanly J, Hedges M, Bretherton M, Beare MH, McNally SR. 2019. Full inversion tillage pasture renewal offers greenhouse gas mitigation options: the Manawatu experience. In: LD Currie, CL Christensen, editors. ‘Nutrient Loss Mitigations for Compliance in Agriculture. Palmerston North, New Zealand’, 2019. Palmerston North, New Zealand: Fertilizer and Lime Research Centre, Massey University; p. 11–11.
- Calvelo-Pereira R, Hedley MJ, Hanly JA, Beare MH, McNally SR, Bretherton MR. 2022. Spring pasture renewal involving full inversion tillage and a summer crop can facilitate soil C storage, improve crop yields and lower N leaching. Soil and Tillage Research. 219:105347–105347.
- Cayley JWD, McCaskill MR, Kearney GA. 2002. Available phosphorus, sulfur, potassium, and other cations in a long-term grazing experiment in south-western Victoria. Australian Journal of Agricultural Research. 53:1349–1360.
- Crush JR, Waller JE, Care DA. 2005. Root distribution and nitrate interception in eleven temperate forage grasses. Grass and Forage Science. 60:385–392.
- Curtin D, Campbell CA, Messer D. 1996. Prediction of titratable acidity and soil sensitivity to pH change. Journal of environmental quality. 25:1280–1284.
- Curtin D, Fraser PM, Beare MH. 2015. Loss of soil organic matter following cultivation of long-term pasture: effects on major exchangeable cations and cation exchange capacity. Soil Research. 53:377–385.
- Curtin D, Rostad HPW. 1997. Cation exchange and buffer potential of Saskatchewan soils estimated from texture, organic matter and pH. Canadian Journal of Soil Science. 77:621–626.
- Curtin D, Syers JK. 2001. Lime-induced changes in indices of soil phosphate availability. Soil Science Society of America Journal. 65:147–152.
- Curtin D, Trolove S. 2013. Predicting pH buffering capacity of New Zealand soils from organic matter content and mineral characteristics. Soil Research. 51:494–502.
- Dodd MB, Chapman DF, Ogle G. 2018. Regrassing trends and drivers in the New Zealand dairy industry. Journal of New Zealand Grasslands. 80:177–184.
- Edmeades DC, Metherell AK, Waller JE, Roberts AHC, Morton JD. 2006. Defining the relationships between pasture production and soil P and the development of a dynamic P model for New Zealand pastures: a review of recent developments. New Zealand Journal of Agricultural Research. 49(2):207–222.
- Ellert BH, Bettany JR. 1995. Calculation of organic matter and nutrients stored in soils under contrasting management regimes. Canadian Journal of Soil Science. 75:529–538.
- Hedley CB, Kusumo BH, Hedley MJ, Tuohy MP, Hawke M. 2009. Soil C and N sequestration and fertility development under land recently converted from plantation forest to pastoral farming. New Zealand Journal of Agricultural Research. 52:443–453.
- Helling CS, Chesters G, Corey RB. 1964. Contribution of organic matter and clay to soil cation-exchange capacity as affected by the pH of the saturating solution. Soil Science Society of America Journal. 28:517–520.
- IPCC. 2014. Sythnesis Report. Contribution of Working Groups I, II and III to the Fifth Assessment Report of the Intergovernmental Panel on Climate Change. In: RK Pachauri, LA Meyer, editors. Climate Change 2014. Geneva, Switzerland: IPCC; p. 151.
- Kirschbaum MUF, Don A, Beare MH, Hedley MJ, Pereira RC, Curtin D, McNally SR, EJ L-S. 2021. Sequestration of soil carbon by burying it deeper within the profile: a theoretical exploration of three possible mechanisms. Soil Biology and Biochemistry. 163:108432.
- Lawrence-Smith EJ, Curtin D, Beare MH, McNally SR, Kelliher FM, Calvelo-Pereira R, Hedley MJ. 2021. Full inversion tillage during pasture renewal to increase soil carbon storage: New Zealand as a case study. Global change biology. 27:1998–2010.
- Loganathan P, Bretherton MR, Hedley MJ. 2007. Effect of soil cultivation and winter pugging on fluorine distribution in soil profiles under pasture following long-term applications of phosphate fertilisers. Soil Research. 45:41–47.
- Loganathan P, Hedley MJ. 1997. Downward movement of cadmium and phosphorus from phosphatic fertilisers in a pasture soil in New Zealand. Environmental Pollution. 95:319–324.
- Loganathan P, Hedley MJ, Wallace GC, Roberts AHC. 2001. Fluoride accumulation in pasture forages and soils following long-term applications of phosphorus fertilisers. Environmental Pollution. 115:275–282.
- Madigan AP, Zimmermann J, Krol DJ, Williams M, Jones MB. 2022. Full Inversion Tillage (FIT) during pasture renewal as a potential management strategy for enhanced carbon sequestration and storage in Irish grassland soils. Science of the Total Environment. 805:150342.
- McDowell RW, Condron LM. 2004. Estimating phosphorus loss from New Zealand grassland soils New Zealand. Journal of Agricultural Research. 47:137–145.
- McDowell RW, Smith LC. 2023. The longevity of cultivation in decreasing the potential for phosphorus loss in runoff. Soil and Tillage Research. 227:105618.
- McNally SR, van der Klei G, Calvelo- Pereira R, Thomas S, Beare MH, Hedley MJ. 2020. Nitrous oxide emissions from fertiliser and urine following full inversion tillage autumn pasture renewal. In: CL Christensen, DJ Horne, R Singh, editors. Nutrient management in farmed landscapes. Palmerston North, New Zealand, 2020. Palmerston North, New Zealand: Farmed Landscapes Research Centre, Massey University; p. 7–7.
- Milligan G, Scott R, Young D, Connor L, Blackbird S, Marrs R. 2017. Reducing soil fertility to enable ecological restoration: a new method to test the efficacy of Full-Inversion Tillage. Ecological Engineering. 98:257–263.
- Monaghan RM, Hedley MJ, Di HJ, McDowell RW, Cameron KC, Ledgard SF. 2007. Nutrient management in New Zealand pastures – recent developments and future issues. New Zealand Journal of Agricultural Research. 50:181–201.
- Morton JD, Roberts AHC. 2016. Fertiliser use on New Zealand sheep and beef farms. Wellington, New Zealand: New Zealand Fertiliser Manufacturers’ Research Association.
- Morton JD, Stafford AD, Roberts AHC. 2020. Fertilizer use on New Zealand forage crops. Wellington, New Zealand: New Zealand Fertiliser Manufacturers’ Research Association.
- National Institute of Water and Atmospheric Research. 2024. Climate data and activities – Climate summaries. NIWA, New Zealand [accessed 31 January 2024]. https://niwa.co.nz/education-and-training/schools/resources/climate.
- Parfitt RL, Giltrap DJ, Whitton JS. 1995. Contribution of organic matter and clay minerals to the cation exchange capacity of soils. Communications in soil science and plant analysis. 26:1343–1355.
- Peng Y, Hanly JA, Jeyakumar P, Calvelo-Pereira R. 2023. Effects of full inversion tillage during pasture renewal on soil and plant cadmium concentrations: a case study in New Zealand. Soil Research. 61(4):410–420.
- Percival HJ, Parfitt RL, Scott NA. 2000. Factors controlling soil carbon levels in New Zealand grasslands: is clay content important? Soil Science Society of America Journal. 64:1623–1630.
- Roberts AHC, Morton JD. 2016. Fertiliser use on New Zealand dairy farms. Wellington, New Zealand: New Zealand Fertiliser Manufacturers’ Research Association.
- Rumpel C, Amiraslani F, Chenu C, Cardenas MG, Kaonga M, Koutika L-S, Ladha J, Madari B, Shirato Y, Smith P. 2019. The 4p1000 initiative: opportunities, limitations and challenges for implementing soil organic carbon sequestration as a sustainable development strategy. Ambio. 49:350–360.
- Rutledge S, Mudge PL, Wallace DF, Campbell DI, Woodward SL, Wall AM, Schipper LA. 2014. CO2 emissions following cultivation of a temperate permanent pasture. Agriculture, Ecosystems & Environment. 184:21–33.
- Salazar M, Hedley M, Horne D. 2010. Using turnips to reduce soil K loading on the effluent block. Lincoln, New Zealand: Proceedings of the New Zealand Grassland Association.
- Schiedung M, Tregurtha CS, Beare MH, Thomas SM, Don A. 2019. Deep soil flipping increases carbon stocks of New Zealand grasslands. Global Change Biology. 25:2296–2309.
- Schipper LA, Mudge PL, Kirschbaum MUF, Hedley CB, Golubiewski NE, Smaill SJ, Kelliher FM. 2017. A review of soil carbon change in grazed New Zealand pastures. New Zealand Journal of Agricultural Research. 60:93–118.
- Schofield PE, Gregg PEH, Syers JK. 1981. ‘Biosuper’ as a phosphate fertiliser: a glasshouse evaluation. New Zealand Journal of Experimental Agriculture. 9:63–67.
- Schollenberger CJ, Simon RH. 1945. Determination of exchange capacity and exchangeable bases in soil – ammonium acetate method. Soil Science. 59(1):13–24.
- Soil Survey Staff. 2014. Keys to soil taxonomy. Washington, D.C.: USDA, Natural Resources Conservation Service.
- Soussana J-F, Lutfalla S, Ehrhardt F, Rosenstock T, Lamanna C, Havlík P, Richards M, Chotte J-L, Torquebiau E, Ciais P. 2019. Matching policy and science: rationale for the ‘4 per 1000-soils for food security and climate’ initiative. Soil and Tillage Research. 188:3–15.
- Stafford AD, Kusumo BH, Jeyakumar P, Hedley MJ, Anderson CWN. 2018. Cadmium in soils under pasture predicted by soil spectral reflectance on two dairy farms in New Zealand. Geoderma Regional. 13:26–34.
- Wendt J, Hauser S. 2013. An equivalent soil mass procedure for monitoring soil organic carbon in multiple soil layers. European Journal of Soil Science. 64(1):58–65.
- Zhang J, Hanly JA, Hedley MJ. 2009. Effect of pasture cultivation on soil phosphorus stratification and impacts on subsequent fertilizer requirements, LD Currie, CL Lindsay, editors. Palmerston North, New Zealand: Fertilizer and Lime Research Centre, Massey University; p. 105–109.