Abstract
The genetic variation of 28 populations of Cordyline australis (cabbage tree, tī kōuka) grown from wild-collected seed from across New Zealand was assessed using amplified fragment length polymorphism (AFLP). There was strong geographical structure in the data, with the main differentiation being between plants from the northern North Island and those from the central North Island and further south; a split that was not concurrent with any obvious physical barriers. Further smaller genetic divisions were evident in the data, with eight groups found across the range of C. australis, while genetic variation was found to decrease markedly with latitude. We compare the patterns of genetic variation with earlier studies looking at morphological variation across the range of C. australis, as well as the relative survival of plants from different latitudes in three common garden replicates.
Introduction
Cordyline australis (G.Forst.) Endl. (tī kōuka; Asparagaceae) is a widespread monocot tree endemic to New Zealand. The genus is mainly tropical and subtropical, and is found primarily in New Guinea and Australia with five indigenous species present in New Zealand (Moore & Edgar Citation1970). Cordyline australis is an outcrossing, insect-pollinated species, as are most other species in the genus. It is found in a wide range of habitats in New Zealand, including forest margins, swampland, coastal cliffs and even tussock grasslands (Moore & Edgar Citation1970; Esler Citation1974). This species was utilized extensively by Māori, both as a source of fibre and as a food, and there is strong evidence to suggest it was translocated extensively in pre-European times (Simpson Citation2000).
Although C. australis is found in a wide range of habitats, the size and number of populations have deteriorated in the last few years (Beever et al. Citation1996; Simpson Citation2000). Particularly in the North Island, this is often due to the phenomenon known as ‘sudden decline’, hypothesized to be caused by a phytoplasma (mycoplasma-like organism or MLO) (Beever et al. Citation1996). This, along with other threats such as habitat loss and change in land use, have led to a strong decrease in C. australis. There has also been some concern that contemporary horticultural plantings of the species may be a threat to local genetic variation (Harris & Beever Citation2000).
Cordyline australis covers a wide altitudinal and latitudinal range, and due to this it has been the subject of earlier studies looking at adaptation to different temperature regimes (Harris et al. Citation1998, Citation2001; Harris & Beever Citation2000). In an ongoing field trial established in 1994, the survival, growth and flowering phenology of plants representing 28 different populations from across New Zealand (Harris & Beever Citation2000) have been recorded. This study includes data recorded at the Mt Albert (Mt Albert CRI campus and Unitec campus, Auckland, 36°52′S), Lincoln (Canterbury, 43°38′S) and Invermay (Otago 45°51′S) replicates of the field trial as described in Harris and Beever (Citation2000). The plants in these trials have been used in earlier studies looking at phenotypic differences between the different populations in relation to cold tolerance (Harris et al. Citation2001) and morphology (Harris & Beever Citation2000). Considerable differences in the performance of the populations at the different common garden sites were observed, with cold tolerance differing markedly across the populations (Harris et al. Citation2001). This suggests that there has been strong selection and adaptation to the different environmental conditions across the range of this species, as shown in several traits such as plant height, seedling survival and shoot number (Harris et al. Citation2001). In addition, consistency of cold-tolerance traits of the different source populations of C. australis led to the conclusion that there was considerable genetic variation within the species, and this has been further demonstrated using other traits such as seedling colour and morphology (Harris & Beever Citation2000).
This study examined the genetic population structure of C. australis in relation to contemporary climatic variation and environmental variation to determine if there is a relationship between genotype, as determined by neutral markers, and the phenotypic and phenological responses of the different accessions in common garden situations. This will allow us to better understand the scale of adaptation to climate, and provide insights into the history of this species since the last glacial maximum. Patterns of genetic variation, specifically the number of large partitions within the data, may allow inference of the number and broad location of putative glacial refugia or centres of diversity that have contributed to the contemporary distribution of the species. We will also be able to determine if differences in functional characteristics of plants from throughout the range as observed in common garden trials are reflected in differences in neutral genetic markers.
Methods
Source of study plants
Individuals for the amplified fragment length polymorphism (AFLP) investigation were selected from the provenance trial described in Harris & Beever (Citation2000) and situated at the Mt Albert site. These plants represent 28 populations from which seed was collected to establish these trials. The details and location for each of the original collection sites are given in and . For each of the population replicates, up to five plants of the 20 planted from each population in the Mt Albert trial were selected to give a total sample size of 138. The same populations were compared for collection of phenological and ecological data.
Figure 1 Map of the 28 populations of Cordyline australis where seeds were sourced for the common garden. Symbols indicate membership of the two main genetic groups as determined by structure analysis.
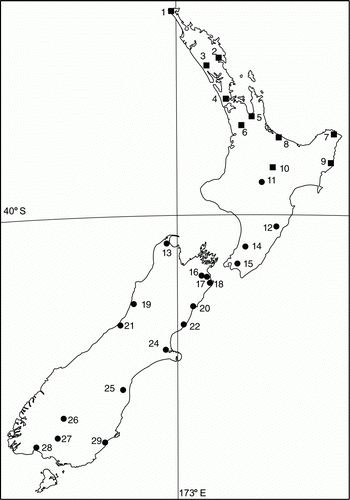
Table 1 Location and main genetic divisions as determined by hierarchical structure analysis.
AFLP methods
DNA was extracted from 138 individuals of C. australis representing the 28 populations described in Harris et al. (Citation2001). DNA extraction from fresh leaves was performed in the Landcare Research molecular laboratory, Tāmaki, New Zealand. DNA was recovered following the methods described in Armstrong and de Lange (2005), with tissue quantities adjusted for Cordyline.
AFLP was carried out following the method of Armstrong and de Lange (Citation2005) with modifications. AFLP marker profiles were generated using three selective primer pairs: 6-FAM–EcoRI–ACA, MseI–CAC; JOE–EcoRI–AAG and MseI–CTG; and 6-FAM–EcoRI–ACT and MseI–CTG. For each individual, 3 µL of labelled selective polymerase chain reaction (PCR) products were mixed with 11.7 µL of formamide and 0.3 µL of genescan ROX 500 size standard and run on an ABI3130 sequencer (Applied Biosystems).
Raw data were analysed using GeneMapper (version 2.2.0) analysis software. Fragments in the size range of 80–500 bp were manually scored as present (1) or absent (0). Data were analysed using Structure (version 2.2) (Pritchard et al. Citation2000). We used the basic admixture model with unlinked loci and uncorrelated allele frequencies, with the assumed number of populations (K) varying from 1 to 10 with five replicate runs per K value. For each run, we used a burn-in period length of 106, followed by 106 Markov chain Monte Carlo (MCMC) steps, which gave consistent results across a run in a pilot study. No a priori population information was used. The optimum number of partitions in the data was tested using hierarchical analysis and delta K (Evanno et al. Citation2005). Summary statistics and analysis were performed in GenAlex version 6.1 (Peakall & Smouse Citation2006). A Mantel test to compare matrices of genetic and geographic distance was also performed in GenAlex. Finally, data were analysed using multivariate analysis in MVSP version 3.1 (Kovak Computing Services). Principle component analysis (PCoA) of simple matching distances genetic differences was used as described in Sokal and Michener (Citation1958).
Mortality and morphology
Details of susceptibility to cold damage and comparisons with the latitude of origin were compiled by Harris et al. (Citation2001). These data, along with survival data collected in following years, were collated across the populations. Cumulative plant mortality was calculated as the percentage mortality of each population from the time of initial planting (August 1994) until December 2009. In some cases, plants that had collapsed and had been recorded as dead subsequently resprouted in later years from remaining trunk material and were recorded as alive.
Multivariate analysis was also performed on the leaf ratios from table 6 of Harris et al. (Citation1998) as a measure of morphological variation between the different populations under field conditions. The relationship between morphological and genetic similarity was examined using a Mantel test.
Results
AFLP data
The AFLP analysis of the 138 individuals produced 182 markers of which 66% (126) were polymorphic (14 of which were either only present/absent from a single individual). The number of polymorphic bands per population, private bands per population and estimated mean heterozygosity for each population are presented in .
Table 2 Sample sizes and population genetic parameters for each of the eight main population divisions of C. australis
Structure analysis found that the best fit to the data using the calculation of delta K (Evanno et al. 2005) was K = 2. The main division in the data was between populations 1–10 and populations 11–29 (, ). Further division of the data from the initial analysis recovered three divisions in populations 1–10 and five in populations 11–29 (, ).
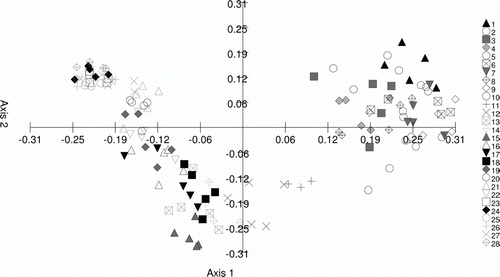
Figure 2 PCoA plot of AFLP data for C. australis labelled by population of origin. Population origins for the 28 populations are described in . Percentage of variation explained: axis 1, 18.25%; axis 2, 8.52%.
The geographic partitioning applied to the data set prior to analysis is supported by the genetic variation as determined by AFLP markers. Using analysis of molecular variance (AMOVA) as implemented in GenAlex version 6.1, 29% of the variation was found among geographic regions as defined in , whereas 23% lay among populations within regions, and the remaining 48% among individuals. PhiPT was significant at P=0.01.
There was a clear isolation by distance relationship in the data as detected by a Mantel test (B=48.14, R 2=0.4735, P=0.01) as implemented in GenAlex version 6.4 (Peakall & Smouse Citation2006).
Multivariate analysis of the AFLP data () shows on Axis 1 the main division between the northern populations (Northland, Auckland, eastern central North Island) and the remaining populations. Within the two main divisions there is strong affinity between individuals within the further groups of populations (). The close clustering of the more southern population groups, particularly the central and southern South Island groups, illustrates the lower levels of genetic variation at these localities.
Mortality and morphological data
Mortality of the plants at the Mt Albert site is positively related to latitude (B=1.67, R 2=0.195, P=0.05), with the lowest mortality being found in the plants originating from lower latitudes. Conversely, at the Lincoln site survival is negatively related to latitude (B=−1.79, R 2=0.26, P=0.02), with the plants from more-northern sites having higher mortality than those from the south. The Invermay site had very low mortality compared with either of the other two sites, and this was not significantly related to the latitude of origin of the plants (B=0.02, R 2=0.03, P=not significant).
Multivariate analysis of the leaf ratio data for wild-grown plants as collated in table 6 of Harris et al. (1998) is shown in . This includes blade length to breadth ratio, petiole to blade breadth ratio, petiole to blade length ratio and blade taper (details in Harris et al. 1998). There was no strong association between the site of origin and the morphology recorded for some populations, although there was some evidence of a weak division between the more-northern populations and the others in the study ().
Figure 3 PCoA analysis of leaf ratio morphological data from Harris et al. (Citation1998) labelled by population and genetic structure division. Percentage of variation explained: axis 1, 27.77%; axis 2, 15.75%.
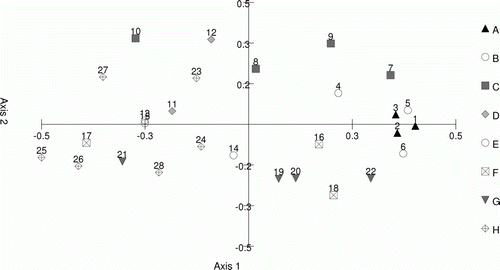
Leaf morphology (average distance) and genetic distance (Nei's) for each population were compared using a Mantel test as implemented in GenAlex version 6.4 (Peakall & Smouse Citation2006). There was a weak but significant relationship between the two parameters (B=0.0314, R 2=0.08, P=0.01) (see ).
Discussion
There is strong concordance between the genetic variation and and geography in these data sets. Cold tolerance and flowering phenology are related to geography, as well as genetic variation. Genetic variation showed very strong geographical structure, with no geographic overlap between the main groups of genotypes. This would indicate that the patterns found in this study are indicative of pre-human disturbance distributions, which is most likely due to the selection of ‘natural’ stands for the original collections of material (Harris & Beever 2000), and the long-lived nature of the species.
The main genetic division in the data is a split between sites to the north, and those to the south of Lake Taupō. There is no current large geographic boundary between these two groups, with the closest populations of the two, Taupō and Tūrangi, occurring within c. 42 km of each other, with no obvious contemporary physical barriers between them. There is the possibility that this pattern is reflecting former disturbance by volcanic activity, although the pattern here is unusual in that we found a north/south split rather than the east/west division described by Holzapfel et al. (Citation2002), and to some extent Shepherd et al. (Citation2007). This area is also coincident with a major climatic boundary (McGlone Citation1985) and it is not possible to differentiate between the two explanations with our data.
There was a moderate to high degree of genetic variation found between sites as detected by AMOVA (29%), as would be expected due to the relatively large geographic distance between the locations in the study. These distances are much greater than gene flow would be expected to regularly occur in an insect-pollinated species, even with seed dispersal via birds (Simpson Citation2000).
While there are extensive oral histories and archaeological evidence of translocation of C. australis by Māori (summarized in Simpson Citation2000), there is no clear indication of this within our data set. This is perhaps not surprising given that the species is found across both islands, and Harris et al. (Citation1998) took care to select seed from plants that did not appear to have been cultivated. There is also the possibility that translocations of preferred varieties were often as a food source, and plants utilized for this may not have survived repeated harvesting.
This study adds to the limited number of population genetic data sets compiled for tree and shrub species in New Zealand (Young et al. Citation2001; Armstrong & de Lange Citation2005; Smissen et al. Citation2006; Broadhurst et al. Citation2008; Shepherd & Perrie Citation2011; Houliston et al. Citation2012). There have been contrasting patterns found in the studies so far, with some finding no strong relationship between geography and genetic variation (Broadhurst et al. Citation2008; Barnaud & Houliston Citation2010) whereas others have shown considerable structure (Armstrong & de Lange Citation2005; Shepherd & Perrie Citation2011).
In C. australis, the amount of genetic diversity decreases with latitude, with the most southern populations containing the least variation, both in estimated heterozygosity and private bands. This is similar to the pattern found for Hebe speciosa, where more-northern populations had much higher diversity (Armstrong & de Lange Citation2005). It is possible from these data to conclude that the southern populations are therefore of either recent origin or have rapidly expanded from glacial refugia, as has been suggested in other studies of New Zealand flora and fauna (Marske et al. Citation2009; Buckley et al. Citation2010; Shepherd & Perrie Citation2011). Given the broad ecological tolerance of C. australis, and the likely persistence of mixed forest in patches across large parts of the extant range during the last glacial maximum (McGlone et al. Citation2010), it is likely that current patterns reflect glacial processes. While it is tempting to make such suppositions, care should be taken to not over interpret data in respect to such explanations, and avoid the use of the ‘geo-historical narrative’ (Crisp et al. Citation2011). It has also been suggested that the more-northern populations contain higher levels of genetic diversity due to hybridization with other Cordyline species, particularly C. pumilio (Beever Citation1986).
Genetic variation was strongly partitioned within the data set. These partitions are not readily observed using morphological characters, with there being only a weak relationship between morphological traits and genetic variation (; Harris & Beever Citation2000). In addition, Harris and Beever (Citation2000) found that cluster analysis of morphological characters recovered five divisions in their data set. These divisions had no relationship with latitude. Some individual traits were significantly related to latitude, including seedling leaf length and the percentage of seedlings at 6 months with red–brown bases. There is some suggestion that the latter character may be plastic as it was not observed at the Mt Albert site (Harris & Beever Citation2000). The current study found two large-scale and eight smaller-scale divisions, using Bayesian analysis of the genetic data. This may indicate that some morphological characters that display clinal variation do not correlate well with neutral marker variation, particularly with the strong primary split in the data.
Mortality was strongly correlated with latitude at two of the common garden sites. This was not the case at the southern-most site, with no relationship found. This is in contrast to the findings of Harris et al. (Citation2001), who found no evidence for cold damage at the Mt Albert site, and greater cold damage of plants at Invermay than at Lincoln. The observed cold damage does not appear to have translated to mortality, which may indicate that plant death is not directly related to temperature regimes, but perhaps to other environmental variables. Conversely, severe cold treatment as found at the Invermay site by Harris et al. (Citation2001), while reducing the growth of plants, may not specifically result in increased mortality, and early cold treatment of seedlings may result in higher tolerance to further cold conditions via loss of apical dominance and a shift in biomass investment to multiple stems and retention of leaves on the stem (Harris et al. Citation2001). Another possible explanation is that the colder temperatures at the Invermay site may have slowed senescence, although C. australis can live much longer that the duration of the common garden experiment, with ages up to 1000 years suggested in exceptional circumstances (Simpson Citation2000).
Genetic data do not correlate strongly with either the morphological data of Harris et al. (Citation1998) or more traditional knowledge classification systems (Simpson Citation2000). In both cases it is acknowledged that there is not strong differentiation between different morphologies as found across the range, and it would appear that genetic patterns more than likely reflect barriers to gene flow more so than putative speciation events. Given the differences in physiological tolerance inferred by Harris et al. (Citation2001), a comparison of genetic variation and physiological parameters may be more enlightening.
The strong geographic components found in both the genetic and morphological aspects of this study, while not always in complete concordance with each other, demonstrate a high degree of structure among these populations. As these common gardens were established from existing naturally occurring stands of the species, there is concern that contemporary cultivation and translocation of the species may disrupt natural patterns of distribution (Harris & Beever Citation2000). This issue may be of most relevance in the North Island where declines of C. australis have been most severe (Beever et al. Citation1996). That C. australis is self-incompatible (Beever & Parkes Citation1996) may also make it more prone to gene flow from horticultural sources (Sampson & Byrne Citation2008; Millar et al. Citation2011). There is little evidence in this study to suggest that earlier translocations of plants for cultural use have disrupted pre-human patterns of genetic variation as observed in this species, although the very long-lived nature of the plant (Simpson Citation2000) means that there have likely been too few generations for this to be a large threat to date. Study of in situ contemporary populations of C. australis may provide the answer as to what threat this mechanism poses to natural patterns of genotypic and phenotypic variation in this species.
Acknowledgements
The authors thank Sue Scheele and Chris Winks for providing details and records relevant to this work. Dianne Gleeson provided encouragement and comments on an earlier draft of the manuscript. This study was supported by MSI contract C09X0503.
Additional information
Notes on contributors
RE Beever
Ross E Beever (1946–2010)Related Research Data
References
- Armstrong , TTJ and de Lange , PB . 2005 . Conservation genetics of Hebe speciosa (Plantaginaceae) an endangered New Zealand Shrub . Botanical Society of the Linnean Society , 149 : 229 – 239 .
- Barnaud , A and Houliston , GJ . 2010 . Population genetics of the threatened tree daisy Olearia gardneri (Asteraceae), conservation of a critically endangered species . Conservation Genetics , 11 : 1515 – 1522 .
- Beever , RE . 1986 . The species of Cordyline (Agavaceae) on Poor Knights Islands, northern New Zealand . Journal of the Royal Society of New Zealand , 16 : 251 – 258 .
- Beever , RE , Forster , RLS , Rees-George , J , Robertson , GI , Wood , GA and Winks , CJ . 1996 . Sudden decline of cabbage tree (Cordyline australis): Search for the cause . New Zealand Journal of Ecology , 20 : 53 – 68 .
- Beever , RE and Parkes , SL . 1996 . Self-incompatibility in Cordyline australis (Asteliaceae) . New Zealand Journal of Botany , 34 : 135 – 137 .
- Broadhurst , LM , Young , AG and Muarry , BG . 2008 . AFLPs reveal an absence of geographical genetic structure among remnant populations of pohutukawa (Metrosideros excelsa, Myrtaceae) . New Zealand Journal of Botany , 46 : 13 – 21 .
- Buckley , TR , Marske , KA and Attanyake , D . 2010 . Phylogenography and ecological niche modeling of the New Zealand stick insect Clitarchus hookeri (White) support survival in multiple coastal refugia . Journal of Biogeography , 37 : 682 – 695 .
- Crisp , MD , Trewick , SA and Cook , LG . 2011 . Hypothesis testing in biogeography . Trends in Ecology and Ecolution , 26 : 66 – 72 .
- Esler , AE . 1974 . The cabbage tree . New Zealand's Nature Heritage , 1 : 375 – 377 .
- Evanno , G , Regnaut , S and Goudet , J . 2005 . Detecting the number of clusters of individuals using the software STRUCTURE: a simulation study . Molecular Ecology , 14 : 2611 – 2620 .
- Harris , W and Beever , RE . 2000 . Genotypic variation of seedlings of wild populations of Cordyline australis (Lomandraceae) in New Zealand . New Zealand Journal of Botany , 38 : 595 – 606 .
- Harris , W , Beever , RE and Heenan , PB . 1998 . Phenotypic variation of leaves and stems of wild stands of Cordyline australis (Lomandraceae) . New Zealand Journal of Botany , 36 : 593 – 604 .
- Harris , W , Beever , RE and Smallfield , B . 2001 . Variation in response to cold damage by populations of Cordyline australis and some other species of Cordyline (Lomandraceae) . New Zealand Journal of Botany , 39 : 147 – 159 .
- Holzapfel , S , Faville , MZ and Gemmill , EC . 2002 . Genetic variation of the endangered holoparasite Dactylanthus taylorii (Balanophoraceae) in New Zealand . Journal of Biogeography , 29 : 663 – 676 .
- Houliston GJ , Dawson MA , de Lange PJ , Heenan PB 2012 . Using AFLP markers to inform population management of the endemic Chatham Island toetoe, Austroderia turbaria (Poaceae) . Pacific Conservation Biology 18 : 33 – 41 .
- Marske , KA , Leschen , RAB , Barker , GM and Buckley , TR . 2009 . Phylogeography and ecological niche modelling implicate coastal refugia and trans-alpine dispersal of a New Zealand fungus beetle . Molecular Ecology , 18 : 5126 – 5142 .
- McGlone , MS . 1985 . Plant biogeography and the late Cenozoic history of New Zealand . New Zealand Journal of Botany , 23 : 723 – 749 .
- McGlone , MS , Newnham , RM and Moar , NT . 2010 . The vegetation cover of New Zealand during the last glacial maximum: do pollen records under-represent woody vegetation? . Terra Australis , 32 : 49 – 68 .
- Millar MA . Byrne M , Nuberg IK , Sedgley M 2011 . High levels of genetic contamination in remnant populations of Acacia saligna from a genetically divergent planted stand . Restoration Ecology . doi: 10.1111/j.1526-100X.2010.00758.x
- Moore LB , Edgar E 1970 . Flora of New Zealand Volume II . Indigenous Tracheophyta Monocotyledons except Gramineae . Wellington , Government Printer .
- Peakall , R and Smouse , PE . 2006 . GENALEX 6: genetic analysis in Excel. Population genetic software for teaching and research . Molecular Ecology Notes , 6 : 288 – 295 .
- Pritchard , JK , Stephens , M and Donnelly , P . 2000 . Inference of population structure using multilocus genotype data . Genetics , 155 : 945 – 959 .
- Sampson , JF and Byrne , M . 2008 . Outcrossing between an agroforestry plantation and remnant populations of Eucalyptus loxophleba . Molecular Ecology , 17 : 2769 – 2781 .
- Shepherd , LD and Perrie , LR . 2011 . Microsatellite DNA analyses of a highly disjunct New Zealand tree reveal strong differentiation and imply a formerly continuous distribution . Molecular Ecology , 20 : 1389 – 1400 .
- Shepherd , LD , Perrie , LR and Brownsey , PJ . 2007 . Fire and ice: volcanic and glacial impacts on the phylogeography of the New Zealand forest fern Asplenium hookerianum . Molecular Ecology , 16 : 4536 – 4549 .
- Simpson P 2000 . Dancing leaves. The story of New Zealand's cabbage tree, tī kōuka . Christchurch , Canterbury University Press .
- Smissen , RD , Breitwieser , I and Ward , JM . 2006 . Genetic diversity in the New Zealand endemic species Helichrysum lanceolatum (Asteraceae: Gnaphalieae) . New Zealand Journal of Botany , 44 : 237 – 247 .
- Sokal , RR and Michener , CD . 1958 . A statistical method for evaluating systematic relationships . University of Kansas Science Bulletin , 38 : 1409 – 1438 .
- Young , AG , Schmidt-Adam , G and Murray , BG . 2001 . Genetic variation and structure of remnant stands of pohutukawa (Metrosiderous excelsa, Myrtaceae) . New Zealand Journal of Botany , 39 : 133 – 140 .