
Abstract
Broussonetia papyrifera (L.) Vent. (Moraceae), or paper mulberry, is a species of cultural importance in South East Asia, East Asia and the Pacific. Originally from mainland South East Asia or East Asia, this plant was introduced into the Pacific range by prehistoric Austronesian voyagers. We used non-coding internal transcribed spacer (ITS) sequences of nuclear ribosomal DNA and inter-simple sequence repeat (ISSR) on 79 samples of B. papyrifera from different islands of Remote Oceania, and South East Asia and East Asia. Our results show an absence of genetic diversity in the introduced range of Remote Oceania, with the sole exception of Hawaii. By contrast, Asian samples show genetic diversity. The data obtained suggest a prehistoric human-mediated introduction of this species from East Asia to Remote Oceania and a second, possibly historic, human-mediated introduction to Hawaii.
Introduction
Paper mulberry, Broussonetia papyrifera (L.) Vent., belongs to the Moraceae family, a diverse and widespread taxonomic group that includes a suite of useful plants that are important food and fibre sources (Whistler Citation2009). Using nuclear and chloroplast DNA markers, the family has been partitioned into several clades and tribes (Clement & Weiblen Citation2009). The clade that gave rise to the Broussonetia genus likely originated in the upper Eocene. Fossil fruits have been recorded from the upper Eocene in southern England and Germany (Zerega et al. Citation2005). The species B. papyrifera (L.) Vent. is of great cultural importance in Asia because its branches supply the bark that is used as a source of raw material for the manufacture of high-quality paper, from which its common name ‘paper mulberry’ is derived.
Taxonomically, the nearest wild relatives of B. papyrifera are B. kazinoki and B. kaempferi. Matthews (Citation1996) argues that the most common recent ancestor of this species was probably located in South East Asia, where all three species are known to occur. Therefore, the nominal native range of B. papyrifera appears to be mainland South East and East Asia, as far east as Taiwan. It is a common and widespread tree in its native range and grows at moderate elevations in secondary forests, in subtropical to temperate climates. It is naturalised in parts of India, Ghana, Southern Europe and the USA (Matthews Citation1996; Morgan & Overholt Citation2013). In many places, it is considered a pioneer plant, requiring a moist forest environment on flat or sloping land (Saito et al. Citation2009). It grows spontaneously in degraded forests and in some places, such as Laos, it is often used as a plantation tree in forests and fields (Aubertin Citation2004).
Paper mulberry reached Polynesia through human-mediated introduction from Asia sometime between 3500 and 1000 yr BP (Kirch Citation1997). It has been argued that its introduction into Remote Oceania, and cultivation as far east as Rapa Nui (Easter Island), was intentional due to its cultural importance, because its bark is the main fibre used to make textiles in this region (barkcloth) (Matthews Citation1996; Seelenfreund et al. Citation2010). Paper mulberry is thought to have been dispersed through its native habitat by birds. However, in its introduced range in the Pacific, and even between islands within Near and Remote Oceania, its dispersal should be considered essentially human-dependent, just like other plants used and introduced by Polynesian people (Lebot Citation2002; Whistler Citation2009), given that seeds of Moraceae, including B. papyrifera, although large, have short survivorship (Berg Citation2001). As suggested previously (Seelenfreund et al. Citation2010, Citation2011), these attributes allow B. papyrifera to be considered as an excellent candidate for studying human mobility patterns across the broad geographic area of the Pacific, with a specific emphasis on Remote Oceania.
Molecular markers are useful tools to provide information about genetic diversity. To date, only one molecular analysis of B. papyrifera populations in Oceania has been performed using internal transcribed spacer (ITS) sequences of the nuclear ribosomal DNA region (rDNA ITS) (Seelenfreund et al. Citation2011). In that study, our results showed limited genetic variation within the small area of Taiwan and no genetic variability within the broad geographic region of island Oceania. Because rDNA ITS represents a single region in the nuclear genome (Nieto Feliner & Rosselló Citation2007), with moderate diversity at the intra-species level (Weising et al. Citation2005), we might expect to detect more genetic diversity by using a multilocus marker that encompasses several genomic regions. For this reason, we analysed a larger group of samples using the ITS region and complemented this study using multilocus inter-simple sequence repeat (ISSR) markers. The ISSR technique requires PCR amplification of genomic DNA using a single primer that targets a known simple sequence repeat (SSR) or microsatellite motif (Liu & Wendel Citation2001), thus generating a pattern of multiple bands representing regions between SSR loci. ISSR markers avoid the need to develop species-specific primers and can be applied to a species whose genome has not been sequenced, providing a useful, affordable and fast analytical tool. This method has been used to determine genetic diversity (Taheri et al. Citation2012; Ribeiro et al. Citation2013; Giustina et al. Citation2014), detect gene-pool origin (Galván et al. Citation2003), the genetic structure of crops (Carrasco et al. Citation2009) and for the construction of genetic maps (Feng et al. Citation2013). The genetic diversity of paper mulberry has also been assessed using ISSR within Taiwan (Ho & Chang Citation2006) and recently in southern China (Liao et al. Citation2014). In this study, we assess the genetic diversity of paper mulberry introduced into the Pacific using the information provided by the ITS-1 region and ISSR markers, in order to test the hypothesis that B. papyrifera in the Pacific is a homogenous population that represents a single human-mediated introduction.
Materials and methods
Sampling and study area
Remote Oceania
Fresh young leaves were collected in the field between 2008 and 2012, from Western Polynesia (Fiji, Samoa and Tonga) and Eastern Polynesia (Marquesas Islands, Hawaii and Rapa Nui). Leaf samples collected in 2008 in Fiji, Samoa, Tonga, Marquesas and Rapa Nui were preserved at −20 °C in the laboratory (Seelenfreund et al. Citation2010). Leaf samples collected in 2012 in Hawaii were dried immediately with silica gel and stored at room temperature.
Asia
Leaf samples dried in silica gel from Taiwan were kindly collected and provided by Dr Kuo-Fang Chung (School of Forestry and Resource Conservation, National Taiwan University, Taipei, Taiwan). Samples from Vietnam and Japan and a sample of B. kazinoki were sent by Dr Peter Matthews (National Museum of Ethnology, Osaka, Japan) and Mr Hiroyuki Nikuto (Kyoto Botanic Gardens, Japan).
The origin and number of samples are shown in and , respectively. The collection consisted of 68 samples from Remote Oceania and 11 from Asia. One additional sample of B. kazinoki was used as an outgroup. Sampling in Oceania was not uniform, because the number and density of the plants on each island or island group are highly variable, as described in Seelenfreund et al. (Citation2010). To obtain samples from Asia, we depended on donations from colleagues working in the areas concerned and therefore the number of samples received was limited.
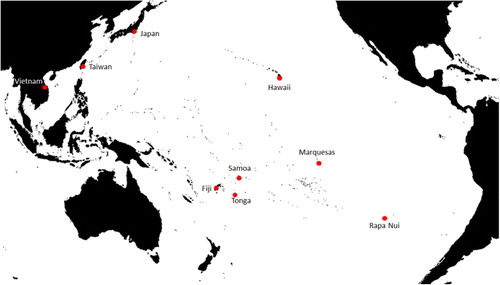
Table 1 Sampling locations, sample accession numbers and geographical coordinates.
DNA extractions and PCR amplification
Genomic DNA was extracted following a CTAB extraction protocol described by Lodhi et al. (Citation1994) and modified as described in Moncada et al. (Citation2013). Extracted DNA was stored in double-distilled sterile water at −20 °C until analysis. High-quality DNA was obtained mainly from silica-gel-dried samples stored at room temperature. Samples from Oceania comprised 80 accessions, of which only 68 provided high-quality DNA (a single band of high molecular DNA with an absorbance ratio . 260/280 between 1.8 and 2.0). Asian specimens yielding high-quality DNA were restricted to three samples from Taiwan, five from Vietnam and three from Japan. In total, high-quality DNA was obtained from 79 samples of B. papyrifera and one sample of B. kazinoki as outgroup. These were used for sequencing the ITS-1 region and ISSR analysis.
ITS-1 amplification and data analysis
The ITS-1 region was amplified using ITS-A (5′-GGAAGGAGAAGTCGTAACAAGG-3′) and ITS–C (5′–GCAATTCACACCAAGTATCGC-3′) primers as described by Blattner (Citation1999). Amplification was as described in Seelenfreund et al. (Citation2011). All polymerase chain reactions (PCR) were set up in a UV-treated PCR cabinet.
Sequences were aligned using the MUSCLE algorithm and CLC Sequence Viewer 7.5 software (Robert Citation2004). A dendrogram was constructed using neighbour-joining (NJ) (Saitou & Nei Citation1987) and unweighted pair-group method with arithmetic mean (UPGMA) clustering (Sneath & Sokal Citation1973), and evolutionary distances were computed using the maximum composite likelihood method (Tamura et al. Citation2004). Bootstrapping analysis (9999 resampling) was conducted with the MEGA 6 program (Tamura et al. Citation2013).
ISSR amplification and data analysis
The ISSR analysis was based on a set of 13 ISSR primers reported by Ho & Chang (Citation2006). An optimisation strategy for the ISSR–PCR protocol was performed using the Taguchi method (Taguchi Citation1986; Cobb & Clarkson Citation1994). The range for each parameter was obtained using the Minitab (version 15) statistical software (Minitab, State College, PA, USA), with an orthogonal arrangement of five PCR reagents and four concentrations. This approach reduced 1024 combinations to only 16 amplification reactions (Table S1). Reagent concentrations defined by this procedure were 1.5 units of GoTaq DNA polymerase (Promega), 2.5 mM MgCl2, 0.2 mM dNTPs, 0.8 µM of each primer and 40 ng of template DNA in a final reaction volume of 25 µL (reaction 9 in Table S1).
PCR amplifications were performed as reported by Ho & Chang (Citation2006), with an initial denaturation at 94 °C for 5 min, followed by 35 cycles at 94 °C for 30 s, 50 s at the optimal annealing temperature for each primer and an extension of 2 min at 72 °C, with a final extension at 72 °C for 10 min. Annealing temperatures for each primer are indicated in . All PCR were also set up in a UV-treated PCR cabinet.
Table 2 Primer names, annealing temperatures, sequences, number of bands and genetic diversity for nine primers.
Amplified samples were separated by electrophoresis at constant 75 V in 0.5× TBE buffer for 2 h 30 min on 2.5% agarose gels (lane width = 5 mm, gel length = 10 cm). A 1 kb plus DNA ladder (Thermo Scientific GeneRuler 1kb Plus DNA ladder # SM1331) was included at each side of every gel. After electrophoresis, gels were stained in 0.5 μg·mL–1 ethidium bromide for 10 min. In order to remove excess staining, gels were subjected to a wash cycle in 1 mM MgSO4 for 10 min followed by electrophoresis at 75 V for 15 min in 0.5× TBE buffer. Bands were photographed under a UV transilluminator and images were analysed using Corel PaintShop Pro X6 Ultimate software, version 16.1.0.48.
Band images were scored by visual inspection by two observers and weak or smeared bands were excluded. Equally sized fragments present in all samples were designated as common or monomorphic bands, whereas those bands present in only a few samples were designated as polymorphic bands. Each distinct and reproducible band was considered as a locus. For each sample, bands were designated as present (1) or absent (0) and entered into a binary matrix.
Data were analysed using the program POPGENE version 1.32, determining the number of polymorphic bands, the percentage of polymorphic bands and Nei's genetic diversity (Yeh et al. Citation1999). Relationships among populations were determined by NJ (Saitou & Nei Citation1987) and UPGMA clustering (Sneath & Sokal Citation1973) using a distance matrix based on the Sørensen–Dice index (Dice Citation1945). Cluster analyses were performed from a similarity matrix using SplitsTree4, version 4.13.1 (Huson & Bryant Citation2006) and dendrograms were built on the basis of 10,000 permutations.
Analysis of molecular variance (AMOVA) was performed using GenAlEx 6.501 (Peakall & Smouse Citation2012). This analysis was performed using a distance matrix constructed on presence/absence data and based on the Sørensen–Dice index with 1000 permutations (Excoffier et al. Citation1992). The representation of genetic distance of native and introduced populations of B. papyrifera was obtained using a principal coordinate analysis (PCoA) implemented in GenAlEx 6.501 (Peakall & Smouse Citation2012).
Results
Analysis of the ITS-1 region
Seventy-seven of 79 samples were used for the alignments of the ITS-1 sequence, including the ITS sequence previously deposited in GenBank under accession number HM623778.1 (Seelenfreund et al. Citation2011). Two samples (BQUCH0028, BQUCH0234) were eliminated from the ITS analysis because of an illegible sequence.
The multiple alignment of a 260 bp sequence corresponding to the 3′-end of the 18S gene and the ITS-1 region of the 77 samples of paper mulberry showed two variable positions defining three genotypes. Genotypes 1 and 3 are defined by a G/T transversion found at position ‘203’, as described in our former study (Seelenfreund et al. Citation2011). Genotypes displaying the G variant in this position are found in Asian samples from Japan, Taiwan and Vietnam and also three samples from Hawaii (BQUCH187, BQUCH189 and BQUCH191), as shown in . Genotype 3, presenting the T variant, is found in 60 samples from Polynesia, which include 7 samples from Hawaii of a total of 13 from this island group. Genotype 2 corresponds to a C/T transition at position 99. This genotype (not described in Seelenfreund et al. Citation2011) is found in two samples from Vietnam (BQUCH202 and BQUCH205) and three samples from Hawaii (BQUCH177, BQUCH192 and BQUCH194).
Table 3 Genotypes of B. papyrifera found by ITS–1 analysis.
Genetic analysis of ISSR markers
From a set of 13 ISSR primers reported by Ho & Chang (Citation2006), nine giving reproducible banding profiles were chosen (). The reproducibility of banding profiles was verified by amplifying genomic DNA from two biological replicates for each of the nine primers. In all cases, the same amplification pattern was obtained for the same individuals. In addition, two technical replicates for each experiment, such as PCRs (repeated on different days), also showed identical genomic profiles for the same individual (data not shown).
The analysis of 79 samples yielded a total of 136 registered bands for the nine ISSR primers. Of these, 81 were polymorphic and represent 59.6% of the total number of assigned bands (). Furthermore, the average Nei genetic diversity (Nei Citation1973) for all loci was of 0.0761, with primer UBC823 generating the highest value (0.1447).
Using the NJ clustering method, a dendrogram was constructed which split the samples in two main clusters with high bootstrap values and five smaller clusters with variable bootstrap values. One main cluster included three groups: Group I comprises most Polynesian samples (bootstrap value 100), including nine samples from Hawaii that cluster with all samples from Rapa Nui, Samoa, Fiji, Marquesas and Tonga, as shown in . Samples from Japan (Group II) and Taiwan (Group III) are clustered next to one another and separated from Group I by a bootstrap value of 32.8. The split between Group I and Groups II and III is consistent with the suggested dispersal history of this species in the Pacific. The other main cluster comprises all samples from Vietnam (Group IV), and Group V includes additional samples from Hawaii (subgroup 2), which separate from each other with a bootstrap value of 44.1.
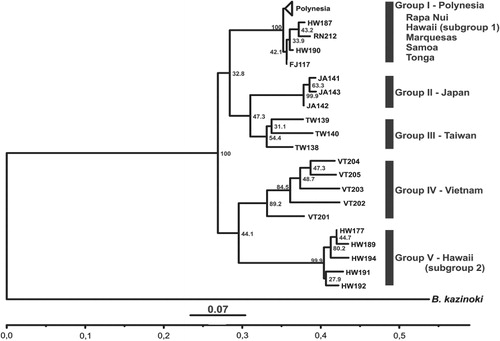
Individuals from Hawaii were split into two different clusters, and were the only group of samples from one geographic locality to present a dual origin. Most of the Polynesian plants have a closer genetic association with Japan and Taiwan than with mainland Asia (represented here by Vietnam). However, five of the Hawaiian samples (BQUCH177, BQUCH189, BQUCH191, BQUCH192 and BQUCH194) have a closer genetic relationship with Vietnam (). These correspond to the same samples that grouped with Asian specimens in the ITS-1 analysis. The only exception is sample BQUCH187, which groups with the Asian samples in the ITS analysis, although it groups with Polynesian samples using ISSR.
The UPGMA distance tree showed a similar structure for the ITS-1 sequence analysis (Fig. S1), compared with NJ analysis. ITS-1 results present three genotypes in two clusters, which group most Oceania samples in one branch and a second branch that groups all Asian samples and six Hawaiian samples. ISSR results show two main clusters, one including most Polynesian samples (Group I), and the Asian samples from Japan (Group II), Taiwan (Group III) and Vietnam (Group IV) on separate branches, wherein the Japan and Taiwan clusters are connected. Group I is defined again by the samples from the islands of Tonga, Samoa, Marquesas, Rapa Nui, Fiji and part of the Hawaiian samples. The other cluster is composed of the same five samples from Hawaii that were described in the NJ analysis (Group V).
Analysis of molecular variance
For the AMOVA, a distance matrix was generated for the samples from the Polynesian islands or island groups corresponding to Rapa Nui, Marquesas, Hawaii, Samoa and Tonga. The results of this analysis showed greater genetic diversity within populations (71%), compared with the genetic variation observed among populations (29%). Both results are statistically significant (. = 0.006), as shown in . Although most of the genetic variability occurs within populations, there is sufficient interpopulation variability to detect at least two distinct populations (corresponding to Groups I and V in ). When the Hawaiian samples were excluded from the AMOVA of the Polynesian plants, all remaining individuals presented similar genetic diversity between islands (. = 0.901) and can be considered a single genetic population (). Because the significance level is greater than 0.05 we can infer that all samples from the Polynesian islands (except for Hawaii, which was excluded from this analysis) can be considered a single genetic group.
Table 4 Intra- and interpopulation AMOVA of ISSR data applied to genetic distances obtained from five populations of Broussonetia papyrifera in Polynesia (Tonga, Samoa, Marquesas, Hawaii and Rapa Nui).
Table 5 Intra- and interpopulation AMOVA of ISSR data excluding Hawaii and applied to genetic distances obtained from four populations of B. papyrifera in Polynesia (Tonga, Samoa, Marquesas, and Rapa Nui).
Principal coordinate analysis
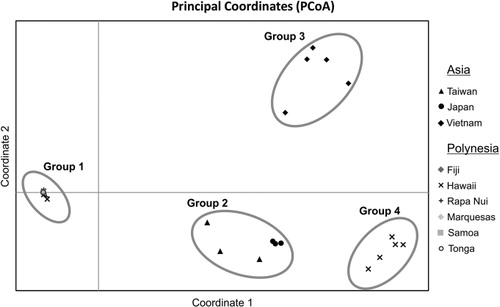
PCoA was performed for the 79 B. papyrifera samples from Remote Oceania and Asia. PCoA clustered individuals into four groups (see ). All samples from Polynesia (Group 1), with the exception of a subset of five Hawaiian specimens, are closely grouped and separate from all Asian samples. Samples from Taiwan and Japan cluster in Group 2; specimens from mainland Asia (Vietnam) form Group 3. Group 4 is defined by the subset of the five Hawaiian samples not included in Group 1. Therefore, the samples from Hawaii separate into two clearly distinguishable groups: one subgroup of individuals which are indistinguishable from all other samples from Polynesia (Group 1), and a second group that is more closely related to the Asian plants (Group 4). These five samples correspond to the same specimens that cluster separately in both the NJ and UPGMA analyses. The first two coordinates explain 60% of the total observed genetic variation (45.5% accounted for by the coordinate 1 and 14.5% accounted for by coordinate 2) (). The third coordinate accounts for 12% of the variation, and the cumulative percentage of variation for the first three coordinates is 72%.
Discussion
Broussonetia papyrifera is a plant of great cultural importance in Oceania and is believed to have been introduced into this area by Austronesian language-speaking people as part of their transported cultural landscape (Kirch Citation1982; Matthews Citation1996). Populations of B. papyrifera in the Pacific islands are derived from cultivated individuals via vegetative reproduction and have been dependent on human dispersal and cultivation (Matthews Citation1996; Seelenfreund et al. Citation2010). To date, there are very few studies that compare the genetic diversity of B. papyrifera in its native habitat (South East to East Asia) and in introduced regions, where lower genetic diversity is expected. However, lower genetic diversity need not limit establishment of an introduced population, as release from competitors or natural enemies or a broad environmental tolerance may contribute to success in the introduced range (Sakai et al. Citation2001). In the case of paper mulberry, the presence of extant populations over the vast Pacific range attests to its ability to survive since its prehistoric introduction, both with and without protection and propagation as a cultigen.
Our results show that within Remote Oceania, paper mulberry samples from all islands were genetically homogeneous with the sole exception of some Hawaiian samples, suggesting that the dispersal history of this plant in the Pacific is more complex than we expected. We discuss our results in relation to the genetic diversity of B. papyrifera found in Asia, within Oceania and finally within Hawaii.
The genetic diversity of the nuclear ribosomal sequence (ITS-1) and ISSR markers from B. papyrifera samples was analysed. Analysis of the ITS-1 sequence confirms the results of Seelenfreund et al. (Citation2011), indicating that samples from Taiwan consistently present the ‘G’ polymorphism at position ‘203’. The additional samples from other Asian locations tested in this work also share the same ‘G’ variant, suggesting that this genetic variant may correspond to an ancestral genotype and seems to be widely distributed in the native region. In addition, a new polymorphism is detected in some of the Vietnamese samples. In combination with the genotype information presented in Seelenfreund et al. (Citation2011), we have detected three genotypes within the Asian range. In comparison, in a much larger number of samples, the Polynesian specimens exhibit the described ‘T’ variant, with the exception of six of the Hawaiian samples that present an Asian ‘G’ genotypic variant. Of these, three also present the second polymorphism detected in some of the Vietnamese samples (Genotype 2), strongly suggesting a different history of some of the Hawaiian samples compared with the main group of Polynesian plants. The genetic diversity revealed by analysis of the ITS-1 sequence probably does not represent all the genetic diversity within the Asian region, whereas the genetic diversity found in Polynesia most likely represents the diversity presently found in the plant patches on the different islands of Remote Oceania for this DNA sequence.
In this work, the analysis of ITS-1 sequences allowed the detection of a limited genetic diversity, finding two genotypes from Asian samples and one genotype from Oceanian samples, whereas the analysis of ISSR loci, which detects polymorphisms of multiple genomic regions, showed five different groups, thus constituting a more informative marker system for this species.
Using ISSR, a higher genetic diversity was found within our Asian samples (the nominal native range), where both natural and human-mediated dispersal of the plant is known to occur. In China, a significant correlation between genetic variation and geographical distribution has been described (Zhiyuan et al. Citation2009; Liao et al. Citation2014). Paper mulberry in Taiwan also shows considerable genetic variation according to geographical distribution, and natural populations cluster into two major geographic groups (Ho & Chang Citation2006). Our previous study of rDNA also revealed genetic diversity within Taiwan (Seelenfreund et al. Citation2011) and, likewise, in this study Asian samples do present genetic diversity. Interestingly, in Vietnam, Taiwan and Japan both male and female plants are observed (Matthews Citation1996), so wild populations can spread by both seeds and suckers, while cultivated forms are generally spread by cuttings. The high genetic diversity within this region presumably reflects the multiple modes of reproduction and dispersal.
The low genetic diversity of paper mulberry observed in island Oceania is not unexpected. Introduced populations of a species typically represent only part of the genetic diversity in the natural range. This can be explained by many factors including genetic and demographic bottlenecks and adaptation to novel environments (Bossdorf et al. Citation2005; Le Roux et al. Citation2013). As Matthews (Citation1996, Citation2007) suggested, probably few cultivars were introduced into Oceania from Asia in the form of seeds or vegetative cuttings (clones). In addition, in the Pacific paper mulberry is propagated asexually by cuttings or root shoots, as are other Pacific cultivars. Paper mulberry in Oceania is grown exclusively for making barkcloth, so its branches are cut and harvested before flowering, preventing sexual reproduction even if both female and male plants are present. This agricultural practice may have helped to reduce genetic diversity in locations where breeding was a possibility. The analyses of NJ and UPGMA of ISSR data display high bootstrap values (100) separating Groups I, II and III from Groups IV and V. However, bootstrap values are low within each node, suggesting that this might be a random clustering. This is the case for Groups I, II and III and also for Groups IV and V. Nonetheless in the case of Groups I, II and III, archaeological and linguistic evidence suggest a close relationship between Taiwan and Remote Oceania (Green Citation1979; Ko et al. Citation2014; Lipson et al. Citation2014) that is coherent with the clustering shown in the dendrogram (). It is difficult to define the relationship between Taiwan and Japan, because the origin of this species in Japan is still under discussion. Natural populations of paper mulberry in Japan are not known (Matthews Citation1996). In the case of Groups IV and V, it needs to be stressed that Group IV corresponds to plants from the South East Asian mainland (Vietnam); there is no archaeological or linguistic evidence to link this area with Hawaii or Remote Oceania. The possible explanations for the origin of Group V (subgroup 2), from Hawaii, are discussed below.
PCoA of ISSR data also suggests that there is a close relationship between the main group of Remote Oceania samples and those from the islands of Taiwan and Japan (our East Asian set). This is consistent with the current evidence that points to Taiwan as the homeland of Austronesian-speaking colonisers of the Pacific.
In Polynesia, gene flow among populations is limited by the extreme geographic distances between islands and island groups. The AMOVA of the Polynesian samples determines that the major source of genetic diversity comes from within the populations. The level of significance below 0.05 indicates that the genetic diversity of B. papyrifera is similar between locations, again with the exception of Hawaii, and confirms that this island group has genetically distinct populations (. < 0.05). In all these analyses, a subgroup of samples from Hawaii consistently forms a separate cluster that is genetically closer to the Asian samples than to the Pacific samples. In our previous study, we did not include specimens from Hawaii, which explains the homogeneity initially found in Remote Oceania. Within Remote Oceania, Hawaii is the only island group to have greater genetic diversity of paper mulberry, and genetic affiliation with both Polynesia and Asia, suggesting that there were at least two different introduction events. This is not consistent with the hypothesis of a single introduction of paper mulberry into the Pacific.
Consequently, we propose that these results reflect an independent, second introduction of B. papyrifera to Hawaii. The present analysis does not allow us to ascribe a specific origin or timescale for the proposed second introduction. A number of possibilities arise in order to explain the occurrence of this population. One is that paper mulberry was carried by contracted workers from China who started arriving at the end of the eighteenth century and during the late nineteenth century. Another option, which does not exclude the former possibility, is that it was introduced from Japan by labourers brought to the sugarcane plantations in the late nineteenth century (1876 to 1899) (Northrup Citation1995). We speculate that some of the workers or their families brought a few plants, seeds or cuttings of paper mulberry, for medicinal purposes or as a source of fibre. A further explanation might be the introduction of paper mulberry from the American mainland, where the plant has become invasive (Morgan & Overholt Citation2013). However, we have no evidence to prove this. According to the NJ analysis, the Hawaiian samples that do not present the general Pacific haplotype form a distinct group that is closer to the Vietnamese samples than to those from Taiwan, Japan and all other Pacific samples. However, the UPGMA analysis shows that these Hawaiian samples cluster independently from samples from Vietnam, Taiwan, Japan and from the Pacific. Finally, the PCoA also separates these five Hawaiian samples into a distinct group.
Our data provide new insights into the dispersal of paper mulberry in the Pacific and serves to enhance our understanding of the prehistoric Austronesian expansion and historic introductions. Further resolution will require more comprehensive sampling within Asia and East Asia, as well as more variable genetic markers to determine more precise origins and dispersal routes for Pacific paper mulberry.
Supplementary data
Supplementary file 1: Table S1. Optimisation of PCR reagents for ISSR using a Taguchi orthogonal design.
Supplementary file 2: Figure S1. Genetic diversity of Broussonetia papyrifera samples from Asia and Island Oceania using UPGMA analysis. A, Dendrogram representing the genetic diversity of the ITS-1 region. Numbers on branches correspond to the bootstrap values after performing 10,000 permutations. B, Dendrogram representing the genetic diversity of ISSR analysis. Numbers on branches correspond to the bootstrap values after performing 10,000 permutations. Outgroup: B. kazinoki from Japan.
Figure S1. Genetic diversity of Broussonetia papyrifera samples from Asia and Island Oceania using UPGMA analysis.
Download TIFF Image (5.2 MB)Table S1. Optimisation of PCR reagents for ISSR using a Taguchi orthogonal design.
Download MS Word (13.3 KB)Acknowledgements
This project was funded by Fondecyt grants 1080061 and 1120175 from the Government of Chile to AS. We are indebted to Mr Akio Kaneko and Mr Hiroyuki Nikuto (Kyoto Botanic Gardens, Japan) for samples from Japan; Dr P Matthews (National Museum of Ethnology, Osaka, Japan) for samples from Vietnam and the sample of B. kazinoki from Japan, and Dr Kuo-Fang Chung (School of Forestry and Resource Conservation, National Taiwan University, Taipei, Taiwan) for samples from Taiwan. We are grateful to the numerous people on all the different islands who aided us in sampling. We are also indebted to the Bishop Museum in Hawaii, to B Mulloy, D Tanahy, B Akamine, A Asakura, M Eisele and R and M Hufford for samples from Hawaii, and to Dr JF Butaud (University of French Polynesia, Tahiti) for some samples from the Marquesas. We thank the reviewers for suggestions that significantly improved the manuscript.
References
- Aubertin C 2004. Paper mulberry (Broussonetia papyrifera) in Lao PDR: a successful example of forest product domestication. In: Kusters K, Belcher B eds. Forest products, livelihoods and conservation: case-studies of non-timber forest product systems. Bogor, Indonesia, Centre for International Forestry Research (CIFOR). Pp. 227–246.
- Berg CC 2001. Moreae, Artocarpeae, and Dorstenia (Moraceae): with introductions to the family and Ficus and with additions and corrections to Flora Neotropica Monograph 7. Flora Neotropica Monograph 83: 1–347.
- Blattner FR 1999. Direct amplification of the entire ITS region from poorly preserved plant material using recombinant PCR. BioTechniques 27: 1180–1186.
- Bossdorf O, Auge H, Lafuma L, Rogers WE, Siemann E, Prati D 2005. Phenotypic and genetic differentiation between native and introduced plant populations. Oecologia 144: 1–11.10.1007/s00442-005-0070-z
- Carrasco B, Avila P, Perez-Diaz J, Muñoz J, García R, Lavandero B et al. 2009. Genetic structure of highland papayas (Vasconcellea pubescens (Lenné et C. Koch) Badillo) cultivated along a geographic gradient in Chile as revealed by Inter Simple Sequence Repeats (ISSR). Genetic Resources and Crop Evolution 56: 331–337.10.1007/s10722-008-9367-1
- Clement WL, Weiblen GD 2009. Morphological evolution in the mulberry family (Moraceae). Systematic Botany 34: 530–552.10.1600/036364409789271155
- Cobb BD, Clarkson JM 1994. A simple procedure for optimising the polymerase chain reaction (PCR) using modified Taguchi methods. Nucleic Acids Research 22: 3801–3805.10.1093/nar/22.18.3801
- Dice LR 1945. Measures of the amount of ecologic association between species. Ecology 26: 297–302.10.2307/1932409
- Excoffier L, Smouse PE, Quattro JM 1992. Analysis of molecular variance inferred from metric distances among DNA haplotypes: application to human mitochondrial DNA restriction data. Genetics 131: 479–491.
- Feng S, Zhao H, Lu J, Liu J, Shen BO, Wang H 2013. Preliminary genetic linkage maps of Chinese herb Dendrobium nobile and D. moniliforme. Journal of Genetics 92: 205–212.10.1007/s12041-013-0246-y
- Galván MZ, Bornet B, Balatti PA, Branchard M 2003. Inter simple sequence repeat (ISSR) markers as a tool for the assessment of both genetic diversity and gene pool origin in common bean (Phaseolus vulgaris L.). Euphytica 132: 297–301.10.1023/A:1025032622411
- Giustina LD, Luz LN, Vieira FS, Rossi FS, Soares-Lopes CR, Pereira TN et al. 2014. Population structure and genetic diversity in natural populations of Theobroma speciosum Willd. Ex Spreng (Malvaceae). Genetics and Molecular Research 13: 3510–3519.10.4238/2014.February.14.5
- Green RC 1979. Early Lapita art from Polynesia and Island Melanesia: continuities in ceramic, barkcloth, and tattoo decorations. In: Mead SM ed. Exploring the visual art of Oceania: Australia, Melanesia, Micronesia and Polynesia. Honolulu, University Press of Hawaii. Pp. 13–31.
- Ho K-Y, Chang J-F 2006. Relationship between population genetic structure and riparian habitats of Broussonetia papyrifera Vent. on the Western Taiwan. Bioresources and Agriculture of National Taiwan University Experimental Forest 20: 165–174.
- Huson DH, Bryant D 2006. Application of phylogenetic networks in evolutionary studies. Molecular Biology and Evolution 23: 254–267.
- Kirch PV 1982. The impact of the prehistoric Polynesians on the Hawaiian ecosystem. Pacific Science 36: 1–14.
- Kirch PV 1997. The Lapita peoples: ancestors of the oceanic world. Cambridge, MA, Blackwell Publisher. Pp. 353.
- Ko M-S, Chen C-Y, Fu Q, Delfin F, Li M, Chiu H-L et al. 2014. Early Austronesians: into and out of Taiwan. The American Journal of Human Genetics 94: 426–436.10.1016/j.ajhg.2014.02.003
- Lebot V 2002. La domestication des plantes en Océanie et les contraintes de la voie asexuée. Journal de la Société des Océanistes 114–115: 46–61.
- Le Roux J, Richardson D, Wilson J, Ndlovu J 2013. Human usage in the native range may determine future genetic structure of an invasion: insights from Acacia pycnantha. BMC Ecology 13: 37.10.1111/j.1365-294X.2005.02553.x
- Liao SX, Deng ZH, Cui K, Cui YZ, Zhang CH 2014. Genetic diversity of Broussonetia papyrifera populations in southwest China. Genetics and Molecular Research 13: 7553–7563.10.4238/2014.September.12.22
- Lipson M, Loh P-R, Patterson N, Moorjani P, Ko Y-C, Stoneking M et al. 2014. Reconstructing Austronesian population history in Island Southeast Asia. Nature Communications 5: 4689.10.1038/ncomms5689
- Liu B, Wendel J 2001. Intersimple sequence repeat (ISSR) polymorphisms as a genetic marker system in cotton. Molecular Ecology Notes 1: 205–208.10.1046/j.1471-8278.2001.00073.x
- Lodhi MA, Guang-Ning Y, Norman FW, Bruce IR 1994. A simple and efficient method for DNA extraction from grapevine cultivars and Vitis species. Plant Molecular Biology Reporter 12: 6–13.10.1007/BF02668658
- Matthews PJ 1996. Ethnobotany and the origins of Broussonetia papyrifera in Polynesia: an essay on tapa prehistory. In: Davidson JM, Irwin G, Leach F, Pawley A, Brown D eds. Oceanic culture history: essays in honour of Roger Green. Wellington, New Zealand Journal of Archaeology. Pp. 117–132.
- Matthews PJ 2007. Plant trails in Oceania. In: Howe KR ed. Vaka Moana: voyages of the ancestors: the discovery and settlement of the Pacific. Honolulu, University of Hawai'i Press. Pp. 94–95.
- Moncada X, Payacán C, Arriaza F, Lobos S, Seelenfreund D, Seelenfreund A 2013. DNA extraction and amplification from contemporary Polynesian bark-cloth. PLoS ONE 8: e56549. 10.1371/journal.pone.0056549.
- Morgan EC, Overholt WA 2004, revised 2013. Wildland weeds: paper mulberry, B. papyrifera. University of Florida, IFAS Extension: 2. http://edis.ifas.ufl.edu/in498 (accessed June 2014).
- Nei M 1973. Analysis of gene diversity in subdivided populations. Proceedings of the National Academy of Sciences 70: 3321–3323.10.1073/pnas.70.12.3321
- Nieto Feliner G, Rosselló J 2007. Better the devil you know? Guidelines for insightful utilization of nrDNA ITS in species-level evolutionary studies in plants. Molecular Phylogenetics and Evolution 44: 911–919.10.1016/j.ympev.2007.01.013
- Northrup D 1995. Indentured labor in the age of imperialism, 1834–1922. Cambridge, New York, Cambridge University Press. Pp. 186.
- Peakall R, Smouse PE 2012. GenAlEx 6.5: genetic analysis in excel. Population genetic software for teaching and research – an update. Bioinformatics 28: 2537–2539.10.1093/bioinformatics/bts460
- Ribeiro PC, Pinheiro LC, Domingues R, Forzza RC, Machado MA, Viccini LF 2013. Genetic diversity of Vriesea cacuminis (Bromeliaceae): an endangered and endemic Brazilian species. Genetics and Molecular Research 12: 1934–1943.
- Robert CE 2004. MUSCLE: multiple sequence alignment with high accuracy and high throughput. Nucleic Acids Research 32: 1792–1797.10.1093/nar/gkh340
- Sakai AK, Allendorf FW, Holt JS, Lodge DM, Molofsky J, With KA et al. 2001. The population biology of invasive species. Annual Review of Ecology and Systematics 32: 305–332.10.1146/annurev.ecolsys.32.081501.114037
- Saitou N, Nei M 1987. The neighbor-joining method: a new method for reconstructing phylogenetic trees. Molecular Biology and Evolution 4: 406–425.
- Saito K, Linquis, B, Keobualapha B, Shiraiwa T, Horie T 2009. Broussonetia papyrifera (paper mulberry): its growth, yield and potential as a fallow crop in slash-and-burn upland rice system of northern Laos. Agroforestry Systems 76: 525–532.10.1007/s10457-009-9206-1
- Seelenfreund D, Clarke AC, Oyanedel N, Piña R, Lobos S, Matisoo-Smith EA et al. 2010. Paper mulberry (Broussonetia papyrifera) as a commensal model for human mobility in Oceania: anthropological, botanical and genetic considerations. New Zealand Journal of Botany 48: 1–17.
- Seelenfreund D, Piña R, Ho K-Y, Lobos S, Moncada X, Seelenfreund A 2011. Molecular analysis of Broussonetia papyrifera (L.) Vent. (Magnoliophyta: Urticales) from the Pacific, based on ribosomal sequences of nuclear DNA. New Zealand Journal of Botany 49: 413–420.10.1080/0028825X.2011.579135
- Sneath PHA, Sokal RR 1973. Numerical taxonomy. The principles and practice of numerical classification. San Francisco, W.H. Freeman & Co. Pp. 573.
- Taguchi G 1986. Introduction to quality engineering: designing quality into products and processes (trans. Asian Productivity Organization). Tokyo, Productivity Press Inc.
- Taheri S, Abdullah TL, Abdullah NA, Ahmad Z 2012. Genetic relationships among five varieties of Curcuma alismatifolia (Zingiberaceae) based on ISSR markers. Genetics and Molecular Research 11: 3069–3076.10.4238/2012.August.31.4
- Tamura K, Nei M, Kumar S 2004. Prospects for inferring very large phylogenies by using the neighbor-joining method. Proceedings of the National Academy of Sciences 101: 11030–11035.10.1073/pnas.0404206101
- Tamura K, Stecher G, Peterson D, Filipski A, Kumar S 2013. MEGA6: molecular evolutionary genetics analysis version 6.0. Molecular Biology and Evolution 30: 2725–2729.10.1093/molbev/mst197
- Weising K, Nybom H, Wolff K, Kahl G 2005. DNA fingerprinting in plants: principles, methods and applications. 2nd edition. Boca Raton, FL, CRC Press.
- Whistler WA 2009. Plants of the canoe people: an ethnobotanical voyage through Polynesia. Lawai, National Tropical Botanical Garden.
- Yeh FC, Yang R, Boyle T, Ye Z, Mao JX 1999. POPGENE, version 1.32: the user friendly software for population genetic analysis. Edmonton, Molecular Biology and Biotechnology Centre, University of Alberta.
- Zerega NJ, Clement WL, Datwyler SL, Weiblen GD 2005. Biogeography and divergence times in the mulberry family (Moraceae). Molecular Phylogenetics and Evolution 37: 402–416.10.1016/j.ympev.2005.07.004
- Zhiyuan L, Weihong F, Shihua S 2009. SRAP marker in Broussonetia papyrifera. Scientia Silvae Sinicae 45: 54–58.