
ABSTRACT
Productivity around the tropical coast of North Australia has been considered to be dominated by phytoplankton. The phytoplankton encompasses a large taxon which, dependent on the source definition, can vary significantly. Traditionally, they would only include pelagic photosynthetic organisms (autotrophic), yet more recently the definition is being revised to include heterotrophic organisms. Recent advancements in oceanography over the past three decades have found the prevalence in the global ocean of cyanobacteria of sizes ranging from 0.5–1.5 µm. Two cyanobacterial genera Synechoccocus and Prochlorococcus are now recognised to dominate phytoplankton cell counts and biomass specifically in the oligotrophic tropical and subtropical oceans. This study is the first to identify the importance of picoplankton as a foremost contributor to productivity in a macro-tidal ecosystem in Northern Tropical Australia. Picoplankton was found to be the dominant group of primary producers (> 99% or 6 × 10⁹ cells/L) within the phytoplankton in Darwin Harbour during the dry season of 2013. The larger phytoplankton > 2 µm contributed (< 0.05% or 2 × 10² cells/L) of the population. This study further defines the influences on this dynamic system that would allow the picoplankton community to thrive, highlighting the complexity of this nitrogen-limited system, where nutrient cycling, including nitrogen fixation mediated possibly through the microbial community, plays a pertinent role. Other environmental influences include spring tides, spatial variation and increased turbidity which benefits heterotrophy over autotrophy in this ecosystem.
Introduction
Mangroves are a dominant feature of the tropical North Australian coastline. These systems fringe approximately 75% of the coast and cover an area of 27,350 ha in Darwin Harbour (Branch Citation2005; Duke Citation2006). Studies on the influence of the mangrove ecosystems on primary productivity in the tropics have highlighted the significant role they play in nutrient cycling, specifically nitrification (Burford et al. Citation2008). Given the prevailing macro-tidal regime, oligotrophic status of Darwin Harbour (McKinnon et al. Citation2006), and the influence of the extensive mangrove communities which act as a nitrogen sink in this tropical system, clear challenges relating to nutrient sources and productivity rates for waterborne primary producers are not surprising. However, the prevalence of these primary producers appears to be related to this energetic system, where physical forces and abiotic factors drive primary productivity. The catchment of Darwin Harbour (including water surface and terrestrial boundary) covers 3227 km2. Darwin Harbour is a semi-enclosed, shallow macro-tidal estuarine system, and is characterised by an extreme tidal flow volume of 120,000 m3/s on a spring tide, with < 1% of the harbour volume contributed by fresh water inflows (Williams et al. Citation2006; Andutta et al. Citation2014). The primary producers at the base of the food web in Darwin Harbour have received limited attention (Alongi Citation1988, Citation1998; McKinnon et al. Citation2006; Burford et al. Citation2008), with most monitoring and research effort focused on chlorophyll-a as a response indicator (Fortune & Patterson Citation2016). Phytoplankton in their entirety are loosely referred to as all organisms < 200 µm; this includes the < 2 µm fraction called the picoplankton. Picoplankton is further defined as photosynthetic and non-photosynthetic organisms, including heterotrophic bacteria (Fogg Citation1995). This fraction of the phytoplankton is the focus of this study. Essential nutrients needed by the picoplankton include nitrogen and phosphorus, yet in Darwin Harbour the oligotrophic status is considered to be due to the lack of nitrogen in the system (Burford et al. Citation2008). The consequence of this oligotrophic status is that dissolved and particulate carbon supplied by the nitrogen fixation bacteria becomes an additional nutrient which also plays a controlling role in the system (Alongi Citation1994). Denitrification in Darwin Harbour has been reported to be significant, which may account for the removal of nitrogen from the system. Limited measures of denitrification efficiency in Darwin Harbour sediments found between 83%–94% of nitrogen cycled occurred through the sediment. In contrast, in the water column nitrogen flux occurred in the form of NH4+ (Smith et al. Citation2012). Microbial driven denitrification is considered to be an important factor influencing nitrogen limitation of the system, where extensive tracts of mudflats and mangroves provide a major source of carbon substrate and accompanying hypoxic conditions (Smith et al. Citation2012). The degree of vertical mixing, conspicuous in macro-tidal estuaries, appears to affect phytoplankton populations (Monbet Citation1992). In Darwin Harbour, tidal currents attain velocities of 0.8 m/s (Li et al. Citation2011), causing high turbidity (McKinnon et al. Citation2006), directly reducing the available light, favouring the productivity of the heterotrophic picoplankton with doubling times of several hours, over the larger phytoplankton > 2 µm.
This study aims to quantify the picoplankton fraction of the total phytoplankton community in Darwin Harbour, its contribution to productivity and the possible environmental influences affecting this productivity. This information will resolve the previously underestimated influence that picoplankton productivity has in this environment, and provide a new vital parameter to model depictions of the harbour’s productivity.
Methods
Study sites
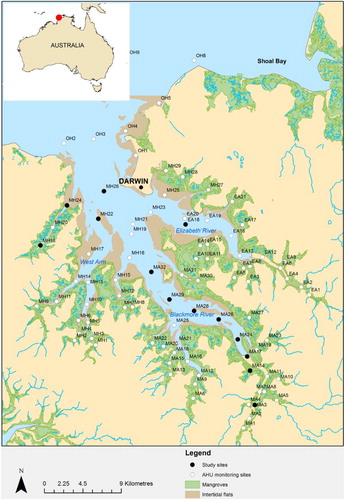
Thirteen sites in Darwin Harbour () were sampled during mid to late September 2013, at the end of the tropical dry season. The sites were chosen based on those used for routine monthly water quality monitoring by Aquatic Health Unit (AHU, Northern Territory Department of Land Resource Management), whereby additional data might enable comparison and validation post sampling. The prefix lettering for each site code denotes location: Middle Arm (MA); Middle Harbour (MH); East Arm (EA); and Outer Harbour (OH). The sampling was carried out using the Australian Institute of Marine Science (AIMS) vessel the RV Solander. Previous work reported the macro-tidal harbour having a tidal range of up to 7.8 m and turbidity exceeding 20 NTU due to sediment transport caused by ensuing current velocities of up to 2 m/s (Burford et al. Citation2008).
Figure 1. Darwin Harbour map with sites sampled in the study highlighted as black dots. Inset map shows location of Darwin (red dot).
Darwin Harbour zonation has been modified and streamlined over the past decade, with the advent of new modelling technology. Initial flushing zones were proposed by Williams (Citation2007) these have been converted into flushing time in days for a dissolved ‘conservative constituent’ to be advected or diffused from the harbour in the dry season (A; Fortune & Maly Citation2009).
Figure 2. A, Darwin Harbour flushing times in days during the dry season (after Fortune & Maly Citation2009); B, newly proposed zonation of the harbour system by the AHU in Darwin based on water quality characteristics (after Fortune Citation2015); C, Darwin harbour dry season 2013 sampling sites ringed in yellow and placed within the mid and upper harbour zones.
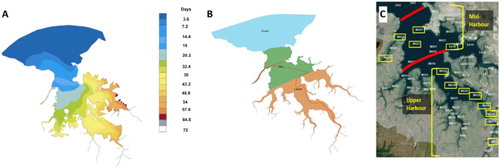
Estuarine categories are Upper, Mid and Outer Harbour. The Department of Land Resource Management (DLRM) developed these zones to accommodate the observed natural variation to help guide the application of appropriate benchmarks and guidelines for reporting purposes. The track taken during sampling is superimposed onto B, clearly demonstrating where the sites are located within the estuarine categories. The harbour sites in this study cover two distinct areas designated as the Upper Harbour and Mid Harbour (C). Corresponding residence times range from 18 to 40 days with a mean of 25 days for replenishment to occur in the Middle Harbour, with the Upper Middle Arm residence time increasing to 57 days for the sites sampled (A).
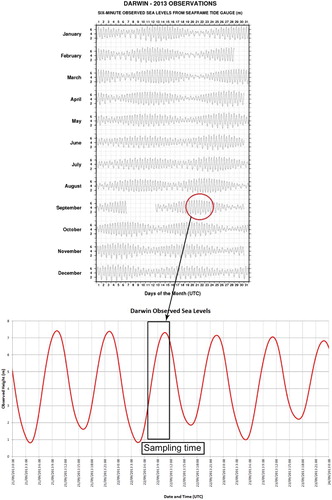
Darwin Harbour tide data were provided by the Bureau of Meteorology (BoM) Darwin, based on 6-min increments continuously, from tide gauge instruments in the harbour.
The 13 Darwin Harbour sites were sampled during a spring tide, with a full tidal range of 7.1–0.9 m on 22 September 2013. This was the highest tide in September 2013 and, based on the full year tides depicted in , it is typical of a spring tide height. As highlighted in the insert, our samples were taken between 0700 h and 1200 h (local time) having a slightly smaller range of 7.1–2.0 m (), supplying a 5.1 m variance in tide height.
Figure 3. Darwin tide chart for 22 September 2013, on the left with the actual tide height changing based on a 6-min data (BoM), and insert below showing a detailed version of the tide variance in Darwin Harbour during our sampling period highlighted in the black box from 0700 h to 1200 h local time on 22 September 2013. Reproduced with kind permission from the Bureau of Meteorology (BoM).
Microscope counts
Surface water samples for microscopic counting of phytoplankton cells were collected and preserved in paraformaldehyde for a final concentration of c. 1% paraformaldehyde in 100 mL darkened bottles. Using the Utermőhl technique, subsamples were settled in 100 mL settling chambers for 24 h and examined using a Nikon Eclipse Ti-S inverted microscope using the methodology outlined by Hasle (Citation1978). Large and numerically rare taxa were counted during full examination of the settling chamber at (×100), while small (< 50 μm) and numerically dominant taxa were counted on 1–2 transects of the chamber (×400) or from cumulative counts of 5–10 fields of view. Diatoms and dinoflagellates were identified to genera or species level based on the key in Hallegraeff et al. (Citation2010). Counts were quantified for this article as one group, the phytoplankton (> 2 µm).
Flow cytometry
For picoplankton cell counts, samples were collected in 2.5 mL cryovials, preserved in 1% paraformaldehyde, and stored in a −20 °C freezer until analysis. Samples were thawed and filtered through a 20 µm filter, then 500 µL of each sample was mixed with 50 μL of 300 mM potassium citrate and 5 μL SYBR Green 1 working stock solution of 1:10,000 in TBS buffer, then incubated in the dark for 1 h. Post incubation, just prior to analysis, 50 µL of a working stock of 0.5 µM Fluoresbrite YG (yellow–green) bead solution was added for a 1:10 dilution final sample concentration (Zubkov et al. Citation2007). Fluroesbrite beads are added to a known dilution to provide an absolute cell concentration and are the same size as those used to calibrate this flow cytometer (Zubkov & Burkill Citation2006). Picoplankton were enumerated using a flow rate of 35 μL/min using a core size of 16 μm, via a peristaltic pump within the Accuri C6 flow cytometer (BD Biosciences) which is a microprocessor-controlled driven fluidic system. The fluorescence measurements of forward angle light scatter (FSC) was 0° ± 13, side light scatter (SSC) was 90° ± 13, green (FL1) was 533 ± 15 nm, orange (FL2) was 585 ± 20 nm and red (FL3) was 670 nm were made using a 488 nm laser which is the standard configuration for the C6 Accuri. Flow cytometric data were analysed using software provided with the C6 flow cytometer, which allowed the results classified using gating to define three distinct groups, picoplankton (stained with SYBR Green I and included all bacteria and Prochlorococcus sp. in the samples), Synechococcus sp., and the picoeukaryotes.
Nutrient data
Samples of seawater, filtered and unfiltered, were taken at selected stations, and on return to main vessel were promptly frozen before transfer to −20 °C freezer prior to analysis. Samples were analysed for concentrations of specific forms of nitrogen, nitrite (NO2), nitrate (NO3) and ammonium (NH4) and filterable reactive phosphorus (PO4), using a segmented flow analysis system (for method details see Ryle et al. Citation1981). Additional seawater (filtered and unfiltered) samples were taken for carbon content, including pre-combusted glass-fibre filters. Liquid samples were thawed and acidified with 200 µL of HCL prior to analysis on a SHIMADZU TOC-5000A and total nitrogen (TN) analyser and solid sample measurement (SSM). Glass-fibre filters were subjected to acidification and sparging prior to analysis on the SHIMADZU TOC-5000A. Carbon in the form of total organic carbon (TOC)/non purgeable organic carbon (NPOC) and dissolved organic carbon (DOC) were measured.
Physicochemical data
Physicochemical data were obtained on vessels using two precalibrated units, a YSI Sonde 6000 (YSI) and a Sea-Bird WET Labs multi-parameter WQM instrument (Sea-Bird Coastal). Both were deployed off the vessel while sampling took place. The parameters measured on the YSI Sonde 6000 were temperature, pH, salinity, dissolved oxygen; turbidity and water depth, while the Sea-Bird measured temperature, salinity, dissolved oxygen and turbidity.
Results
The physicochemical data presented at shows the relative heterogeneity horizontally of physical conditions within each estuarine category. Sites were sampled along a longitudinal transect with MA3 in the upper reach of the Blackmore River and MH26 towards the mouth. Environmental parameters showed a temperature range for surface samples of 26–30 °C, water depth varied between 0.6–23.1 m, pH range was 7.60–7.88, turbidity had the largest range of all the environmental parameters (0.2–22 NTU), salinity ranged from 32.56–36.80, across all sites (). It should be noted that all sites are within the main arms because results from tidal creeks, where outwelling is predominant (Dittmar & Lara Citation2001), may have caused distortions in the dataset.
Table 1. Environmental parameters recorded during sampling at each site in Darwin Harbour using two multi-probe units: YSI unit and Sea-Bird unit (see ‘Methods’ section for details). Values are the arithmetic mean at the surface (c. 5 m) from each site during in situ sampling.
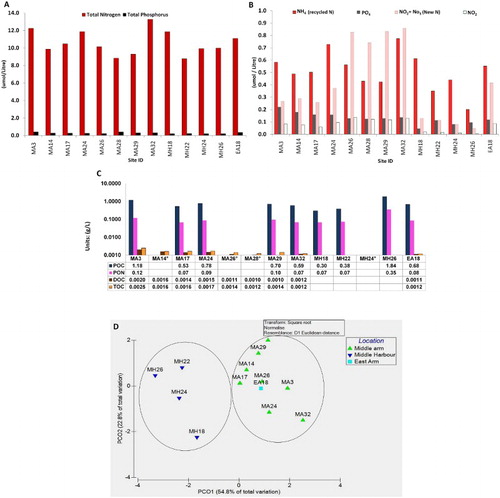
Particulate nitrogen and phosphorus (the difference between total nitrogen and phosphorus and respective dissolved fractions) were the dominant form for both nutrients. The soluble nitrogen fractions from the same sites were often two orders of magnitude smaller, with total nitrogen of just over 12 µmol/L (A) and the filterable fraction detected was 0.58; 0.26 and 0.08 μmol/L, respectively, for NH4, (NO2 + NO3) and NO2 at the uppermost site (MA3) (B). Ammonium was initially the highest concentration of all dissolved nutrients in the upper arm sites with 0.5–0.7 μmol/L for MA3, MA14, MA17 and MA24. However, it gradually decreased in concentration downstream through sites MA26, MA28 and MA29, coinciding with a notable spike in new nitrogen (NO2 + NO3). The mid harbour sites concentrations for NH4 vary between 0.6 and 0.2 μmol/L. The dissolved fraction of new nitrogen (NO2 + NO3) fluctuated through the upper harbour sites of MA3, MA14, MA17 and MA24, with values of 0.2–0.4 μmol/L, and then spiked to 0.7–0.8 μmol/L for the sites MA26, MA28 and MA29, with NO2 also registering its highest values at these sites of > 0.1 μmol/L, possibly indicating nutrient cycling occurring in this middle section of the upper harbour. The mid harbour sites saw a huge reduction in (NO2 + NO3) with values plummeting to ≤ 0.1 μmol/L, with one exception, EA18, at 0.4 μmol/L (A–B). This trend was not as large for phosphorus, with the filterable fraction found to be two to four times smaller than the particulate value, specifically at site MH18 where particulate phosphorus was 0.22 μmol/L (A) with the filterable fraction 0.044 μmol/L (B). Previous work found similar results taken in the Middle Arm during the dry season of 2003, with particulate phosphorus of 0.13 ± 7.16 μmol/L, yet worth noting the standard deviation. A additional data comparisons include dissolved nitrogen values of 0.27 ± 0.2 μmol/L for NH4, and 0.08 ± 0.13 μmol/L for NO2 (McKinnon et al. Citation2006), which are in the same range as data from MA28 from this study, with an NH4 value of 0.43 μmol/L and for NO2 a value of 0.12 μmol/L (B). DOC and TOC have very similar concentrations; for example, at MA3, DOC was 0.0020 g/L with TOC 0.0025 g/L, just 0.005 g/L difference between filtered and unfiltered samples (C), indicating that carbon in the water column may be found predominately in the dissolved form. When compared with glass-fibre filter results for particulate organic carbon (POC), values did not exceed 2 g/L. Sites MA3 and MH26 had the highest values of POC at 1.18 and 1.84 g/L, respectively (C). Particulate organic nitrogen (PON) ranged between 0.07–0.68 g/L with POC at 1.84–0.3 g/L. The ratio of carbon to nitrogen was between 4 and 10:1, indicating a marine source (Meyers Citation1994). The multi-variate analysis based on both the nitrogen and phosphorus complete datasets indicates distinctions between the upper and mid harbour regions, based on their nutrient stoichiometry (D).
Figure 4. Nutrient data from all sites, including total nitrogen and phosphorus A, speciation of nitrogen and phosphorus (B) and carbon (C) analysed from surface sea water samples, filtered: dissolved organic carbon (DOC) and particulate organic carbon (POC) and unfiltered: total organic carbon (TOC). Sites not sampled for POCPON (particulate organic nitrogen). Only stations with the full set of nitrogen and phosphorus data were used in the multivariate analysis D.
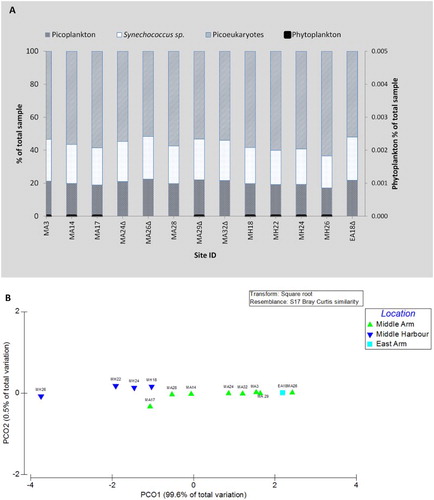
A represents all microbial groups detected at all 13 sites sampled, including both size fractions (< 2 µm and > 2 µm). The larger cells (> 2 µm) the phytoplankton contributed < 1% of the community, only 10% of the cells counted were viable (data not shown) and included on the secondary x-axis. The smaller cells (< 2 µm fraction) the total picoplankton group (including bacteria, cyanobacteria and picoeukaryotes), were the dominant producer group found in the water samples with cell counts accounting for > 99% of the community (A). The principal component analysis (PCO) analysis of the total phytoplankton and picoplankton community indicates alignment along an estuarine gradient with 99.6% of the variability explained by the PCO1 axis. Results further delineate the distinction between the MA and the MH sites, with some overlap at MA17 and MH18. This does indicate that sites closer to the middle harbour have different characteristics that influence variation in the community structure (B). The accompanying nutrient data indicates a distinct gradient with composition and concentration varying significantly between middle and upper harbour sites.
Figure 5. A, Picoplankton and phytoplankton cell counts expressed as percentage versus sites sampled. The triangle (Δ) indicates high density of particulates in the sample, obscuring phytoplankton. B, A principle component analysis for the picoplankton community distribution in PRIMER.
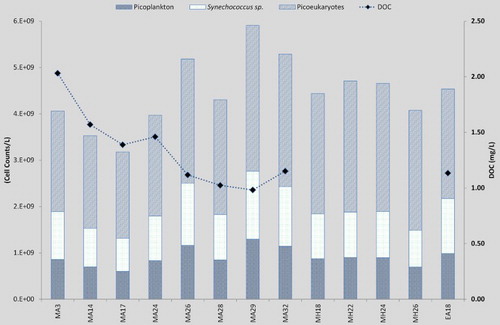
Cell counts for the picoplankton are presented in . They indicate a community controlled by picoeukaryotes which equates to between 52%–63%; picoplankton had a percentage of 17%–22%, with the Synechococcus sp. fluctuating between 19%–26% making up the rest of the community. Further dissolution of groups was not possible through flow cytometry, so pigment analysis was undertaken (data not shown), but due to low biomass of pigments little further definition of specific picoplankton groups was possible, additional identification of actual groups would necessitate DNA analysis, which is outside the scope of this study. On the secondary axis, values for DOC decrease as picoplankton cell numbers increase at sites MA24, MA26 and MA28, with a slight increase at MA32; these are the same sites where spikes in new nitrogen were also noted (B), with a decrease in nitrogen at MA32 ().
Figure 6. Picoplankton community cell counts for each site subdivided into three groups: picoplankton; Synechococcus sp.; and picoeukaryotes, with dissolved organic carbon (DOC) on the secondary axis.
Discussion
Recent work on Darwin Harbour claimed mangroves and phytoplankton to be the dominant primary producers (Burford et al. Citation2008). New data has clarified the role of mangroves as the key primary producer, due to their sequestering of carbon and nutrients, with phytoplankton considered secondary. This places a focus on the importance of heterotrophic bacteria and the essential role they play in the processing of nutrients (i.e. nitrogen and carbon in a particulate form entering the system; Butler et al. Citation2013). The bacterial community has been shown to play a fundamental role in nutrient recycling—especially in the form of nitrogen re-use and re-distribution—in a closely related Australian tropical coastal system (Alongi Citation1994). The dominance of the picoplankton in this study, which includes the heterotrophic bacteria over the larger (> 2 µm) phytoplankton, indicates the highly opportunistic nature of these organisms even in a nutrient-limited environment (Barber Citation2007). The picoplankton are considered one of the most diverse groups of microorganisms, with several modes of nutrition—phototrophic, heterotrophic and saprophytic—depending on environmental conditions. Furthermore, due to their low cell biomass they can exploit nutrient abundances swiftly, easily outcompeting their larger phytoplankton rivals in the marine environment (Landry et al. Citation1998; Richardson & Jackson Citation2007; Massana Citation2011). Unique nutrient recycling control, short (several hours) doubling rates and the independence of the picoplankton to environmental conditions, including light attenuation and turbidity, contribute to why they are the main contributors to primary productivity in oligotrophic marine systems. Our results confirm the ability of the picoplankton to exploit short-term nutrient availability in the system that far exceeds the responses of larger phytoplankton (> 2 μm) that are constrained by doubling times in days, cells sizes several orders of magnitude larger, with lower cell numbers and having obligate dependence on light availability for photosynthesis (Fogg Citation1995). The notable decline of DOC in the middle harbour sites coupled with an increase in picoplankton (A), could be caused by the carbon supply fuelling the picoplankton community growth and then the subsequent release of new nitrogen into the water column.
Previous studies specify that bacteria can facilitate nitrogen fixation into the water column. Yet, in shallow coastal areas, interaction with the sediment can facilitate the release of ammonium into the water column with a number of abiotic conditions driving this process (Herbert Citation1999), as was prevalent with the spikes in ammonia in the upper harbour sites MA3, MA14, MA17 and MA24 (B), where water depths did not exceed 10 m (). This can be further amplified by longer residence times enabling exposure to carbon and nitrogen sources for productivity. Proximity to mangroves provides carbon substrate for microbes to process nitrogen. Their role in denitrification and anammox, the anaerobic ammonium oxidation with nitrite, are essential processes to the marine nitrogen cycle, with anammox possibly responsible for the removal of over 50% of the fixed nitrogen from the oceans based on a recent review (Dalsgaard et al. Citation2005). Denitrification is facilitated by heterotrophic bacteria in which organic matter in the form of carbon is consumed and connected to the process of reduction of nitrate or nitrite to N2O or N2 (Zumft Citation1997; Desnues et al. Citation2007; Koeve & Kähler Citation2010). In relation to the local scale of Darwin Harbour, a recent study revealed significant carbon stores in the mangroves facilitating these facultative anaerobes in removing nitrogen (Bai Citation2012). The decrease in DOC, in concert with increasing picoplankton community cell counts noted in this study, indicate that some interaction between these two nutrients may be occurring, possibly mediated through the picoplankton and, specifically, the heterotrophic bacteria. The effect of carbon input to fuel this picoplankton community dominance has been discussed and indicates clearly the importance of incorporating picoplankton as a parameter in future models of primary productivity within Darwin Harbour. In addition, further work into the carbon cycle is needed to decipher its role with more clarity.
At least 66% of the coastline surrounding Darwin Harbour is populated by mangroves (McKinnon et al. Citation2006) and up to 75% of tidal vegetation in the tropical areas of Australia are mangrove dominated (Duke Citation2006). The combination of discharge of suspended sediments during the wet season and the influence of macro-tides result in the accumulation of fresh sediments in the harbour arms depositing the majority of this into the mangroves (nitrogen sink) (Alongi Citation1988), and very little sediment is carried out on the outgoing tide (David Williams, AIMS, pers. comm., 2014). It has been documented that up to 11% of the annual nitrogen input into shallow tropical oligotrophic non-vegetated ecosystems may come from nitrogen fixation (Smith Citation1984; Herbert Citation1999). Systems with non-vegetated sediments, such as the extensive mudflats in the upper reaches of Darwin Harbour, are considered more dependent on organic carbon as it supplies the metabolisable carbon required to support the heterotrophic nitrogen fixation, and possibly limits the amount of nitrogen produced through fixation (Herbert Citation1999). Darwin Harbour, due to its macro-tides, high turbidity, massive resuspension and scouring naturally has minimal presence of benthic vegetation and sediment composition ranges from 2% to 60% clay, dependent on location (Fortune Citation2006; Dostine Citation2013). The rest of the sediment is mainly composed of sand and, particularly in main channels, these highly dynamic regions are unsuitable for nitrogen fixation because of the substrate and its environment where particulates cannot adhere to the sediment of this composition (Welch et al. Citation2008). In mangrove forests, the nitrogen cycle has been documented to be primarily mediated via microbial rather than chemical processes (Alongi Citation1994). What has been shown through the nutrient data is the cycling of nitrogen appears dependent on spatial position within the harbour, clearly indicating that nitrogen as a limiting nutrient has a major role through breakdown and fixation by possibly heterotrophic bacteria included within the picoplankton community. Further clarification of the nitrogen cycle is needed to understand how this interaction is characterised through the mangroves as both a nitrogen source (via nitrogen fixation through bacteria) and sink. The other major influence on the picoplankton productivity is turbidity () as light in the water column is reduced as particulates increase. In addition, observations over a full tidal cycle found that turbidity values, picoplankton abundance and NH3, all changed in concert with the tidal cycle, at site EA6 (Figure S1), in the East Arm of the harbour. This supports the argument that this macro-tidal movement is a major influence over the primary producers in this system. Still further high resolution data, to encompass both temporal and diel cycles is required to decipher the interaction between turbidity and several other ecological factors in this complex system within Darwin Harbour.
Due to the dynamic nature of Darwin Harbour, significant variation in water quality has required estuarine categories to be established to reflect these conditions and modelled residence times. These categories have allowed the development of report card grades for nine reporting zones across Darwin Harbour (Fortune Citation2015; Fortune & Patterson Citation2016). Sites in the upper reaches and arms of the harbour do not receive a tidal re-charge for up to 2 months during the wet season and typically have poorer water quality than the middle harbour where recharge occurs in approximately half that time, enhancing mixing (). The results here lend further support to the DLRM harbour zoning based on water quality, and also suggest that community structure, though dominated by the picoplankton, still varies across these two zones (). The relatively high and uniform salinity suggests a largely marine influence. Spring tides will strongly influence these gradients, particularly in the upper reaches of this system that are subject to continued freshwater inputs during the dry season. Spring flows in the upper reaches of Middle Arm have been observed to result in stark salinity and pH gradients, where fresher waters can form a buoyant plume which can be exacerbated during wet season inflows. The macro-tidal effect causes masses of sediment movement during the wet season with major contributions from adjacent Blackmore and Pioneer catchments (Skinner et al. Citation2009).
Other conditions affecting productivity in this system include salinity and dissolved oxygen. Previous work from 2003 documented Darwin Harbour salinity variances of 23.47 ± 9.71 during the wet season and 34.29 ± 1.67 during the dry season. This study was conducted late in the dry season only, with salinity assuming a limited range (36.80–32.56; ). Oxygen saturation varied between 63%–88%, with MA3 in the top of Middle Arm having the lowest value of 63%, which is plausible based on the lack of tidal re-charge at this site positioned at the confluence of Middle Arm and the Blackmore River. These conditions, of the lowest dissolved oxygen of 63%, coupled with the highest turbidity value of 22.27 NTU at MA3, in comparison to all other sites which are downstream reflecting the longitudinal gradient present (). These conditions further describe the limits of conditions that may also influence picoplankton community productivity, favouring both the heterotrophic bacteria and picoeukaryotes (Massana Citation2011).
To implement this new information on picoplankton and productivity in a tropical estuary, a parameter specific to picoplankton productivity could be built into models of Darwin Harbour, such as those of Wolanski et al. (Citation2005) and Burford et al. (Citation2008). The new prominence of picoplankton to productivity is also captured in a proposed new model plan, coming out of this study to inform modellers of the complexity of this environment (Figure S2).
This study attempts to include a first order evaluation of the many competing physical and environmental factors affecting primary producers in the Darwin Harbour ecosystem. It provides a clearer understanding of picoplankton abundance in Darwin estuary waters and their dominance in comparison to other phytoplankton.
Conclusions
This study identifies the dominance of (< 2 µm) picoplankton over the (> 2 µm) phytoplankton in Darwin Harbour during the dry season sampling of 2013. One contributing group to picoplankton success in this system is considered to be the heterotrophic bacteria responsible for nutrient cycling. Nutrients play an integral role in essential supply to the primary producers, specifically nitrogen in the form of NO2 and NH4, and a steady supply of carbon. Further work is still needed to understand these complex processes. From this study the most significant influences on productivity include the spring tide, nitrogen and carbon availability, spatial variation and turbidity. Increased turbidity consequently reduced light availability promoting productivity of heterotrophic over autotrophic organisms, supporting the dominance of picoplankton.
Figure S2.
Download TIFF Image (829.9 KB)Figure S1.
Download TIFF Image (420.6 KB)Acknowledgements
Special thanks to Dr Melanie Trenfield and Dr Andrew Harford at ERISS Darwin, for their assistance in allowing samples to be analysed on their flow cytometer. Special thanks to Mike Davis at the Bureau of Meteorology (BoM) for his assistance with tide cycle information for Darwin Harbour.
Associate Editor: Dr Susanna Wood.
Disclosure statement
No potential conflict of interest was reported by the authors.
Additional information
Funding
Related Research Data
References
- Alongi DM. 1988. Bacterial productivity and microbial biomass in tropical mangrove sediments. Microb Ecol. 15:59–79. doi: 10.1007/BF02012952
- Alongi DM. 1994. The role of bacteria in nutrient recycling in tropical mangrove and other coastal benthic ecosystems. Hydrobiologia. 285:19–32. doi: 10.1007/BF00005650
- Alongi DM. 1998. Coastal ecosystem processes. Boca Raton: CRC Press.
- Andutta FP, Wang XH, Li L, Williams D. 2014. Hydrodynamics and sediment transport in a macro-tidal estuary: Darwin Harbour, Australia. In: Wolanski E, editor. Estuaries of Australia in 2050 and beyond. Dordrecht, Netherlands: Springer; p. 111–129.
- Bai L. 2012. The colour of mud: blue carbon storage in Darwin Harbour. PhD, Charles Darwin University.
- Barber RT. 2007. Oceans: picoplankton do some heavy lifting. Science. 315:777–778. doi: 10.1126/science.1137438
- Branch WM, editor. 2005. The health of the aquatic environment in the Darwin Harbour region. Darwin: Department of Infrastructure PaE.
- Burford MA, Alongi DM, McKinnon AD, Trott LA. 2008. Primary production and nutrients in a tropical macrotidal estuary, Darwin Harbour, Australia. Estuar, Coast Shelf Sci. 79:440–448. doi: 10.1016/j.ecss.2008.04.018
- Butler ECV, Streten-Joyce C, Tsang JJ, Williams DK, Alongi DM, Furnas MJ, McKinnon AD, editors. 2013. A procedure for evaluating the nutrient assimilative capacity of Darwin Harbour report for Aquatic Health Unit, Northern Territory Department of Land Resource Management. Darwin: Australian Institute of Marine Science.
- Dalsgaard T, Thamdrup B, Canfield DE. 2005. Anaerobic ammonium oxidation (anammox) in the marine environment. Res Microbiol. 156:457–464. doi: 10.1016/j.resmic.2005.01.011
- Desnues C, Michotey VD, Wieland A, Zhizang C, Fourçans A, Duran R, Bonin PC. 2007. Seasonal and diel distributions of denitrifying and bacterial communities in a hypersaline microbial mat (Camargue, France). Water Res. 41:3407–3419. doi: 10.1016/j.watres.2007.04.018
- Dittmar T, Lara RJ. 2001. Driving forces behind nutrient and organic matter dynamics in a mangrove tidal creek in North Brazil. Estuar, Coast Shelf Sci. 52:249–259. doi: 10.1006/ecss.2000.0743
- Dostine PL, editor. 2013. Phytoplankton communities of East Arm in Darwin Harbour. Palmerston, Northern Territory: Management DoLR.
- Duke NC. 2006. Australia's mangroves: the authoritative guide to Australia's mangrove plants. Brisbane: University of Queensland.
- Fogg GE. 1995. Some comments on picoplankton and its importance in the pelagic ecosystem. Aquat Microb Ecol. 9:33–39. doi: 10.3354/ame009033
- Fortune J, editor. 2006. The grainsize and heavy metal content of sediment in Darwin Harbour. Darwin: Aquatic Health Unit, Environmental Protection Agency.
- Fortune J, editor. 2015. Spatial variability of Darwin Harbour water quality during dry season neap tides of 2012 and 2013. Palmerston, Northern Territory, Australia: Aquatic Health Unit. Department of Land Resource Management.
- Fortune J, Maly G, editors. 2009. Phase 1 report—towards the development of a water quality protection plan for the Darwin Harbour region. Palmerston, Northern Territory, Australia: Aquatic Health Unit, Department of Natural Resources, Environment, the Arts and Sport.
- Fortune J, Patterson R, editors. 2016. Darwin Harbour Region 2015 report card water quality supplement. Palmerston, NT: Aquatic Health Unit, Department of Land Resource Management.
- Hallegraeff GM, Bolch CJS, Hill DRA, Jameson I, LeRoi JM, McMinn A, Murray S, de Salas MF, Saunders K. 2010. Algae of Australia: phytoplankton of temperate coastal waters. 1st ed. Canberra, A.C.T.: Australian Biological Resources Study and CSIRO Publishing.
- Hasle G, editor. 1978. The inverted microscope method. Paris: UNESCO.
- Herbert RA. 1999. Nitrogen cycling in coastal marine ecosystems. FEMS Microbiol Rev. 23:563–590. doi: 10.1111/j.1574-6976.1999.tb00414.x
- Koeve W, Kähler P. 2010. Heterotrophic denitrification vs. autotrophic anammox-quantifying collateral effects on the oceanic carbon cycle. Biogeosciences. 7:2327–2337. doi: 10.5194/bg-7-2327-2010
- Landry MR, Brown LS, Campbell L, Constantinou J, Hongbin L. 1998. Spatial patterns in phytoplankton growth and microzooplankton grazing in the Arabian Sea during monsoon forcing. Deep Sea Res Part II: Top Stud Oceanogr. 45:2353–2368. doi: 10.1016/S0967-0645(98)00074-5
- Li L, Wang XH, Sidhu H, Williams D. 2011. Modelling of three dimensional tidal dynamics in Darwin Harbour, Australia. ANZIAM J. 51:103–123. doi: 10.21914/anziamj.v52i0.3765
- Massana R. 2011. Eukaryotic picoplankton in surface oceans. Annu Rev Microbiol. 65:91–110. doi: 10.1146/annurev-micro-090110-102903
- McKinnon AD, Smit N, Townsend S, Duggan S. 2006. Darwin Harbour: water quality and ecosystem structure on a tropical harbour in the early stages of urban development. In: Wolanski E, editor. The environment in Asia Pacific Harbours. Dordrecht, The Netherlands: Springer; p. 433–459.
- Meyers PA. 1994. Preservation of elemental and isotopic source identification of sedimentary organic matter. Chem Geol. 114:289–302. doi: 10.1016/0009-2541(94)90059-0
- Monbet Y. 1992. Control of phytoplankton biomass in estuaries: a comparative analysis of microtidal and macrotidal estuaries. Estuaries. 15:563–571. doi: 10.2307/1352398
- Richardson TL, Jackson GA. 2007. Small phytoplankton and carbon export from the surface ocean. Science. 315:838–840. doi: 10.1126/science.1133471
- Ryle VD, Mueller HR, Gentien P. 1981. Automated analysis of nutrients in tropical seawaters. AIMS Oceanography Series Tech. Bulletin No.3. 81.
- Skinner L, Townsend SA, Fortune J, editors. 2009. The impact of urban land-use on total pollutant loads entering Darwin Harbour. Darwin, NT: Department of Natural Resources, Environment, the Arts and Sport.
- Smith J, Burford MA, Revill AT, Haese RR, Fortune J. 2012. Effect of nutrient loading on biogeochemical processes in tropical tidal creeks. Biogeochemistry. 108:359–380. doi: 10.1007/s10533-011-9605-z
- Smith SV. 1984. Phosphorus versus nitrogen limitation in the marine environment1. Limnol Oceanogr. 29:1149–1160. doi: 10.4319/lo.1984.29.6.1149
- Welch M, Schult J, Padovan A, editors. 2008. Effects of urban stormwater on heavy metal and nutrient concentrations in mangrove sediments of Darwin Harbour. Darwin, N.T.: Aquatic Health Unit DoNR, Environment, the Arts and Sport.
- Williams D, editor. 2007. Environmental monitoring group report on Darwin Harbour. Darwin, NT: DHAC.
- Williams D, Wolanski E, Spagnol S. 2006. Hydrodynamics of Darwin Harbour. In: Wolanski E, editor. The environment in Asia Pacific Harbours. Dordrecht, The Netherlands: Springer; p. 461–476.
- Wolanski E, McKinnon AD, Williams D, Alongi DM. 2005. An estuarine ecohydrology model of Darwin Harbour, Australia. In: Wolanski E, editor. The environment in Asia Pacific harbours. Dordrecht, Netherlands: Springer; p. 477–488.
- Zubkov MV, Burkill PH. 2006. Syringe pumped high speed flow cytometry of oceanic phytoplankton. Cytom Part A. 69A:1010–1019. doi: 10.1002/cyto.a.20332
- Zubkov MV, Burkill PH, Topping JN. 2007. Flow cytometric enumeration of DNA-stained oceanic planktonic protists. J Plankton Res. 29:79–86. doi: 10.1093/plankt/fbl059
- Zumft WG. 1997. Cell biology and molecular basis of denitrification? Microbiol Mol Biol Rev. 61:533–616.