
ABSTRACT
Honey derived from the nectar of Leptospermum scoparium J.R. et G. Forst. Myrtaceae (mānuka) is a high-value product and there is considerable potential for economic growth in honey-growing regions of New Zealand through increased nectar yield from mānuka plantations. Leptospermum scoparium exhibits a significant amount of phenotypic plasticity throughout regions in New Zealand where it has established, although the influences on this plasticity are unknown. When assessing L. scoparium as a nectar source for honey in marginal land areas, the possible effect of soil on nectar chemistry and yield should be considered. We investigated whether phenological patterns of flowering, plant growth, nectar composition and nectar yield were influenced by soil composition.
Three different cultivars of L. scoparium were grown on 10 different soils in glasshouse conditions. The soils chosen were representative of the range of New Zealand soils where mānuka is being considered as a commercial crop for the honey industry. ANOVA and general linear models revealed no significant effect of soils on nectar composition or production; however, significant but complex interactions between cultivars and soils influenced plant growth and flowering (P ≤ 0.05). Accordingly, the overall nectar yield was influenced by cultivar and soil interaction. Measured attributes of the soil such as cation exchange capacity, sulphate, iron, manganese, calcium and chloride were shown to influence the plant parameters assessed.
Results allowed modelling of nectar potential against each soil type and established a mānuka soil index to determine the most appropriate soil for each cultivar. The results indicated that potential nectar yield increases will be dependent on cultivars being deployed according to the nature of the soil present. Furthermore, the mānuka cultivars displayed significantly greater growth in response to increased nutrients and some cultivars increased floral density, suggesting potential to improve nectar yield by greater plant growth using targeted fertilisation.
Introduction
Commonly known as mānuka, Leptospermum scoparium J.R. et G. Forst. Myrtaceae is an economically important plant in New Zealand. The main commercial products derived from mānuka are honey and essential oils. In addition, the plant is commonly used as an ornamental shrub. The unique non-peroxide antibacterial (NPA) bioactive component in mānuka honey is due to methylglyoxal (MGO), which is derived from the precursor dihydroxyacetone (DHA); DHA is only present in the nectar and MGO forms in maturing honey solutions (Adams et al. Citation2009). Mānuka honey is a valuable product with considerable potential for economic growth from plantations that produce elevated nectar yields. The value of mānuka honey is currently driven by the NPA which is intrinsically linked to the concentration of DHA in the nectar collected by foraging bees. Hence, investigating the influence of genotype and plant nutrition on plant growth, nectar composition in particular DHA concentrations, and total nectar yield is of interest to the mānuka honey industry in New Zealand.
The various taxonomic characteristics of L. scoparium have been described (Morris Citation1984; Forst Citation1986; Greer et al. Citation1991; Wilson et al. Citation1991; Dawson Citation1997; Perry et al. Citation1997; Haberlein & Tschiersch Citation1998; Douglas et al. Citation2004; Stephens et al. Citation2005) and some publications have investigated honey and nectar components responsible for the NPA (Adams et al. Citation2009; Donarski et al. Citation2010; Atrott et al. Citation2012). Williams et al. Citation2014 studied the composition of soil samples collected from underneath trees sampled for nectar and suggested no effect of soil chemistry on nectar quality (specifically DHA concentrations) from plants in field locations.
Leptospermum scoparium is a highly polymorphic species (Dawson Citation1997) and exhibits significant phenotypic plasticity and genotypic variation. Polymorphism is common in plants and is related to biodiversity, genetic variation and adaptive responses to the environment (Yin et al. Citation1984; Wilson et al. Citation1991; Alonso-Blanco et al. Citation2005). The reported ideal soil conditions for L. scoparium colonisation are moist, slightly acidic soils with low nutrient content (Hall Citation1977). However, the extent to which soil environment or plant competition exerts control on L. scoparium establishment and growth is not clearly understood. Permanent dominance has been observed in positions that are unfavourable for the development of climax forest, for example situations that are too wet, dry, cold, exposed, infertile or unstable (Stephens et al. Citation2005) and this indicates probable competition effect from climax species. Additionally, L. scoparium forms a large number of mycorrhizal associations, the principal benefit of these is thought to be increased phosphorous uptake allowing more rapid growth to exploit expansion into available cleared land areas (Stephens et al. Citation2005).
The establishment of L. scoparium plantations in New Zealand marginal agricultural land is receiving more attention in land-use planning, particularly in some regions of the country. Marginal land areas in New Zealand are often steep hill country which is prone to erosion with low-fertility soils that exhibit low grassland productivity. Leptospermum scoparium is seen as a commercially viable plant species for use in protecting hill country from erosion. Afforestation in erosion susceptible areas mitigates soil loss and flood damage and reduces negative effects on water quality (Bergin & Kimberley Citation2014; Funk et al. Citation2014). Mānuka for honey production is seen as a greater value land-use than other options in these areas.
New Zealand marginal land areas carry a variety of soils (http://data.gns.cri.nz/geology/) and soil chemistry and structure have been shown to affect growth and flowering in many plant species (Sperens Citation1997; Brun et al. Citation2003; Ryser & Sauder Citation2006; Staggemeier et al. Citation2010; Cardoso et al. Citation2012). Hence the effect of New Zealand soils on plant growth and flowering in L. scoparium is an important field of research. The various subspecies of Leptospermum have been observed to flower over different periods from spring through summer in New Zealand (Stephens et al. Citation2005), while Yin et al. (Citation1984) reported significant differences in flowering phenology in a range of L. scoparium seedling populations grown under uniform environmental conditions, indicating a significant genotypic effect on flowering. However, the effects of soil type on flowering phenology have not been reported to date. Research that investigates optimum conditions to promote growth and flowering, and integrates this with predictive tools that assess the likely performance of L. scoparium plantations in different regions, is seen as beneficial to the economic development of the mānuka honey industry.
The current study was conducted in the context of this higher level objective and specifically investigated the influence of soil chemistry on L. scoparium through measurement of plant growth (measured by plant height, basal stem diameter, biomass and relative growth rate), flowering phenology (onset of flowering, flowering period and flower numbers), nectar yield and nectar quality (DHA concentrations), as a function of the soil chemistry from soils collected from a range of geographic locations within New Zealand.
Materials and methods
This research was conducted under controlled glasshouse conditions using three L. scoparium cultivars (R: cultivar variety L. scoparium var scoparium cultivar X L. scoparium var incanum; G: cultivar variety L. scoparium var incanum; and Y: cultivar variety L. scoparium var scoparium) on a range of New Zealand soils (10) over a 15-month period.
Soil collection and experimental design
Nine locations within New Zealand () that were representative of regions that might be suitable for mānuka plantation were selected to investigate possible effects of soil type on the nectar quality, growth and flowering of this species. At each location a composite bulk sample (200 kg) was collected from 10 random points within a 1 ha location. One square metre was dug for each collection and soil was sampled down to a depth of 30 cm. The top 5 cm of soil was discarded from collection to remove any grass or herbage. A commercial potting media developed specifically for shrubs and trees was used as the control soil in the study. Soil collected from each location was sieved and roto-mixed to ensure homogenous distribution before transfer into 300 mm diameter plant pots. The total pot volume for each soil was matched at 8 L per pot. Three proprietary cultivars of mānuka, labelled R, G and Y were planted into each soil and grown for 15 months. All treatments (cultivar and soil combinations) were replicated 10 times (300 pots in total). Each cultivar set were genetically identical clones of the parent material; they were the same age and grown from cuttings of a single parent plant. Cuttings were supplied by Comvita New Zealand and were transferred at age 3 months to the potted soil. The soil experiment was conducted at the Massey University Plant Growth Unit; Palmerston North, New Zealand. Plants were watered with in-line irrigation to ensure each pot received the same volume of water. All experimental units were planted into one greenhouse in a randomised latin block design (Figure S1). The glasshouse was ventilated by a fan system to provide a climate of mild temperate conditions. Plant response parameters measured were: basal stem diameter, plant height, relative growth rate (RGR), nectar DHA concentration normalised to 80°BRIX, nectar volume, start of flowering, flowering period and seed capsules numbers. The glasshouse trial ran for a period of 15 months; growth parameters were measured 3 monthly over a 15 month period from 1 October 2012 until January 2014. Nectar was collected when plants flowered and seed capsules numbers were counted near the end of the experiment in December 2014.
Table 1. Description of soil used for the experimental analysis. Soils are from a range of locations within the North and South Islands of New Zealand () plus commercial potting mix as a control soil.
Nectar collection
Leptospermum scoparium flowers, although fully open, do not start secreting nectar until the anthers are mature and fully extended from the hypanthium edge. This can be denoted as stage IV in flower stage development in eucalyptus, another member of the Myrtaceae family (Davis Citation1997). Stage IV of flower development in L. scoparium lasts on average 4–5 days. In the later stage V, anthers start to shrivel and detach from the hypanthium. Nectar production continues from stage IV to stage V; however, these flower stages were not included in the collection protocol to allow standardisation of the nectar collection at optimum health of the flower. Flowers were sampled at randomly selected times between 1000 and 1400 h on sampling days. Flowers were removed from plants using forceps and placed on ice. Nectar from each plant was collected immediately following flower collection and stored at −80 °C. Nectar collection was performed using a stereo microscope and pipette to ensure accurate rinsing and maximum nectar retrieval. Nectar was removed from individual flowers by rinsing the hypantheum with 5 µL of distilled H2O using a pipette then removing all liquid. Nectar from each plant was pooled into Eppendorf tubes for weighing for total yield measurements. The tubes and water were weighed prior to collection to allow for accurate nectar volume measurements. Preliminary experimentation revealed that at least 15 flowers needed to be sampled to allow for the intra-variability of nectar composition within each plant (data not shown); thus, for the current study, 20 flowers were taken from each plant. Cultivar Y did not flower in significant numbers for nectar collection on any of the natural New Zealand soils, and therefore no comparison on nectar yield and quality could be made for cultivar Y in this experiment.
Analysis of dihydroxyacetone
DHA levels in the nectar samples were measured using aqueous extraction, derivatisation and analysis by an adapted HPLC method (Windsor et al. Citation2012) for analysing DHA in honey samples. The standard range and reaction chemical and sample dilutions were modified to allow for the analysis of the lower concentration and the smaller volume (100–200 µL) of these components in floral nectar for each sample in the current study.
HPLC conditions
Analyses were performed on a Perkin Elmer Series 200 Pump and Auto sampler with a Flexar photo diode array detector (λ = 263 nm). HPLC separations were performed on a Synergi Fusion column (75 × 4.6 mm, 4 µm particle size) held at 30 °C. Mobile phase A was water: acetonitrile (ACN), 70/30, v/v and mobile phase B was 100% ACN. The following 23 min gradient elution was employed: A:B = 90:10 (isocratic 2.5 min), graded to 50:50 (8.0 min), graded to 0:100 (1.5 min), 0:100 (isocratic 7.0 min), graded to 90:10 (1.0 min), 90:10 (isocratic 3.5 min), detection wavelength 263 nm.
Preparation of reaction solutions
Hydroxyacetone (HA) (3.01 mg/ml) formed the HA internal standard solution. The O-(2,3,4,5,6-pentafluorobenzyl) hydroxylamine (PFBHA) derivatising reagent was 19.8 mg/mL in citrate buffer (0.1M) adjusted to pH 4 with sodium hydroxide (NaOH) (4M). DHA (3.88 mg/mL) formed the DHA standard solution.
For the preparation of standards, DHA standard stock solutions (100, 80, 60, 40, 20, 10 and 0 µL) were added to tubes 1 to 7, respectively and made up to 100 µL with nanopure water. For sample analysis, 20 µL of nectar or standard was pipetted into a mix tube and 25 µL of the HA was added. Derivatisation steps were performed at 25 °C in a controlled temperature room. Each of the HPLC samples and standards was thoroughly mixed and placed in a rack on a rotating table for 1 h to allow complete dissolution. PFBHA derivatising solution (100 µL) was added to each test tube, which was mixed and placed in a rack on a rotating table for 1 h to allow for complete derivatisation. ACN (1.5 mL) was added to each test tube and mixed. Nanopure water (0.5 mL) was added to each test tube and mixed. Samples were then syringe filtered with a 0.22 µm filter into HPLC vials. Vials were placed into the auto sampler and run overnight with repeat analysis of standards analysed through each run to check stability of the analysis. DHA calibration curves were generated from standards by linear regression using the HPLC peak area ratios of DHA: HA plotted against the mass of the DHA. Mass DHA content of the nectar samples were determined against these calibration curves.
Soil analysis
A soil corer with internal volume of 80 cm3 was used to collect a soil sample from each pot in the glasshouse at the end of the experiment (January 2014). Replicates 1–3; 4–6 and 7–10 for each treatment unit were combined, mixed then air dried and sieved to less than 2 mm to generate three replicate soil samples for each soil/cultivar combination.
Soil samples were analysed for soil volume (g/mL), pH, cation exchange capacity (CEC), macronutrients, phosphorus (P), sulphate (SO4), potassium (K), calcium (Ca), magnesium (Mg) and sodium (Na) by the Fertiliser and Lime Research Centre, Palmerston North according to the methods of Blakemore et al. (Citation1987). pH was measured in water at a soil:water ratio of 10.25 g/mL. Plant available P was assessed using the Olsen P method with bicarbonate extraction followed by the Murphy & Riley (Citation1962) colorimetric test. SO4 was assessed according to the method of Johnson & Nishita (Citation1952) but with a Technicon modern auto-analyser. CEC and cations; Ca2+, Mg2+, Na2+ and K+ were assessed by semi-micro leaching with 1M ammonium acetate H+ approximated by pH drop elemental analysis.
The plant available micronutrients boron (B), chlorine (Cl), iron (Fe), manganese (Mn), zinc (Zn), copper (Cu) and cobalt (Co) were quantified by Hills Laboratories (Waikato Innovation Park, Ruakura Lane, Hamilton). Soils for micronutrient analysis were air dried at 35–40 °C overnight with residual moisture typically 4%. Boron was assessed by extraction with boiling dilute calcium chloride followed by ICP-OES, chloride was assayed by saturated calcium sulphate extraction followed by potentiometric titration. The plant-available concentrations of Fe, Mn, Zn, Cu and Co were determined by 0.05M EDTA extraction followed by ICP-OES analysis of the extract.
Plant growth measurement methods
Plant height and basal stem were measured every 3 months using callipers to measure the basal stem diameter at the root stem node junction, denoted as the point where the first lateral root appears. Plant height was measured using the standing height at highest point with a metre rule. RGR in this work is defined as the average increase in basal stem diameter per month.
Statistics
Soil composition
Multivariate statistical methods using principal component analysis (PCA) was used to analyse the overall differences in the composition of the 10 soils in order to establish the main differences between the soils. PCA results give an overview of how similar or different the samples are with regard to each other and also the variations within the samples themselves is shown by how well they group together in any number of PC plots. Loadings plots show the influence of the various parameters measured on the separation and groupings in the relevant PC plot. Components close to the X–Y intercept in the loadings plots have a low influence on the separation and groupings in the PCA plots.
Plant data
Minitab statistical software v16.2.4 was used to determine whether the means of the response variables measured differed between the cultivars and/or the soils. Statistical methods, ANOVA, general linear model (GLM) and comparison of means using a Tukey pair-wise comparison at the 95% confidence level (P ≤ 0.05) were used to analyse the response data and assess for any significant differences between each cultivar, each soil type and any interactions between the cultivars and the soils. Any parameters showing significant differences were analysed against soil composition using partial least squares (PLS) regression techniques and analysis of relevant associated loadings. Soil composition data is highly co-linear due to the inter-relation of the parameters assayed. Co-linearity in data results in errors when using multiple regression analysis; in comparison PLS regression analysis allows for data of this type and was therefore chosen as the best method (Mattila et al. Citation2004). Outliers were hotelled and removed at the 95th percentile. R-squared values, model validation, weighted loadings and PLS score plots were analysed for influencing soil composition factors in the PLS results. PLS loadings were analysed to understand how much each variable contributes to the data and to interpret relationships between variables (Esbensen et al. Citation2004; Eriksson et al. Citation2014).
Statistical results for the analysis of plant data indicated that the three cultivars varied in their responses to the soils and therefore each line was also analysed for any correlation against soil composition separately. Interactions between the cultivars and soils were also analysed. Cultivar Y could not be sampled for nectar analysis as minimal number (12%) of plants flowered and those plants did not flower in substantial numbers to allow nectar collection.
Results
Soil chemistry
The chemical properties of the 10 soils used in this experiment are summarised in . Multivariate analysis of the soil properties in using PCA illustrate differences between the 10 soils ().
Figure 1. PCA plots and related loading plots of the soil chemistry data for all 10 soils. Individual soils are labelled and coloured separately to show soil groupings. PCA loadings plots show the influence of soil compositional data related to the separations in the PCA plots. A, PC1 vs PC2; B, loadings PC1 vs PC2; C, PC2 vs PC3; D, loadings PC2 vs PC3.
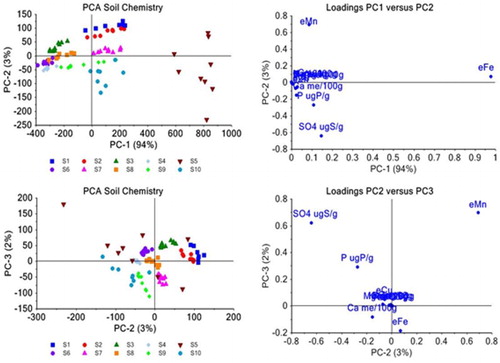
Table 2. Average macronutrient and micronutrient concentration in the 10 soils used for the glasshouse trial. Soil codes S1–10 are defined in . New Zealand (NZ) medium range values are taken from the Hill Laboratories database and represent the mean concentration of these macronutrients and micronutrients in productive New Zealand soils (http://www.hill-laboratories.com).
The distribution of the soils in the PCA plot shows groupings of soils with similar properties (). The loadings plots (B, D) show which variables are influencing the positioning of the soils in the PCA plot. The soils are generally tightly grouped showing similar properties, except soil 5 (A). The spread in the PCA for soil 5 is variable indicating that the properties of soil 5 are heterogeneous. Soil 5 is a commercial potting mix, with nutrients in the form of slow-release fertiliser grains. Data heterogeneity for this soil may represent random inclusion of fertiliser grains in the soil cores sampled. Soil 5 is grouped separately to the right of the PC plot away from the other soils indicating that the properties of soil 5 are substantially different from the natural New Zealand soils.
Soils 1, 2, 7 and 10 are similar in PC1 (A). Soils 1 and 2 have the same position in PC1 and PC2 and are essentially the same with respect to soil chemistry. Soils 3, 6, 4 and 8 form another grouping along PC1, while soil 9 spreads across both of these two major groupings along PC1. A shows the loadings plot for PC1 versus PC2 and indicates that the groupings along PC1 are due mainly to differences in plant-available Fe concentration (94% of the variation). The distribution of soils across PC2 (Y axis) are mainly due to the plant-available Mn and SO4 concentration in the soils, with other soil chemistry parameters measured not spreading in the X or Y direction in the loadings plot but located around the central X–Y axis. This indicates that they have very little influence on soil composition differences within the 10 soil types (). The plot of PC2 against PC3 (C) shows minor differences in the chemistry of the 10 soils due to SO4 and plant-available Mn concentration, with some additional influence from P, plant-available Cu, Ca and plant-available Fe concentration (D).
Plant response to soil chemistry
Plant growth
Basal stem diameter and plant height were significantly affected by soil type for each of the three cultivars ( and Tables S1–S3) indicating that soil type has a significant influence on the growth of L. scoparium. For cultivar R, basal stem growth was significantly affected by soil composition (P ≤ 0.001). Plants on soil 5 had a greater basal stem diameter than plants on soils 8, 1, 9 and 7. Plant height was also affected by soil composition (P ≤ 0.002) with plants on soils 10 and 6 having greater height than on soils 9 and 7 (, Table S1). For cultivar G, the differences in basal stem diameter were not statistically significant; however, the trend showed a difference in diameter of 5.27 mm with soil 5 having the largest stem diameter and soil 7 the smallest. Cultivar G growing on soil 5 had the greatest plant height (884.2 mm) at the end of the experiment; however, this was only significantly greater than soil 9 (616.6 mm, P ≤ 0.046) ( and Table S3). For cultivar Y, plants on soil 10 had a significantly greater stem diameter than plants on soils 1, 8, 4, 9 and 7 (P ≤ 0.001). Heights of cultivar Y were greater on soils, 5, 2 and 10 relative to the other soils (P ≤ 0.001) ( and Table S3).
Figure 2. Relative start day of flowering, total days flowering, DHA concentration normalised to 80oBRIX, numbers of seed capsules, basal stem diameter, plant height, nectar yield and relative growth rates for each cultivar R, G and Y. Plots are mean value and standard error.
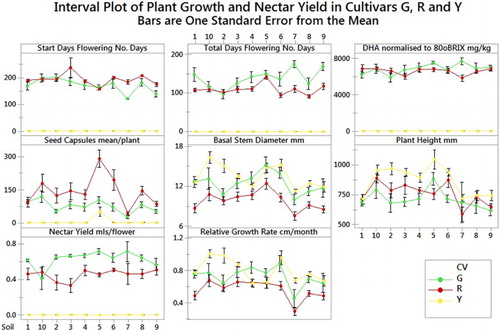
The RGR of the cultivars showed a significant interaction between soil and cultivars with the effect of soil composition on the RGR being dependent on the cultivar (P ≤ 0.005). For example, the RGR for cultivar Y was higher on soil 10 than soils 7, 9 and 5, whereas for cultivar G, RGR was higher on soils 6 and 4 than soil 7 ( and Table S3).
Overall, soils 5 and 10 had, on average, the most growth with plants on soil 7 consistently exhibiting less growth than on any other soil (soil 7 is a sandy loam with low fertility; ). PCA plots highlight that soils 5 and 10 are mainly characterised by higher SO4 concentration relative to the other soils (negative scores along PC2; ; ).
PLS regression was performed on growth and floral data against soil chemistry data to investigate if any individual or groups of soil compositional components were significantly influencing the response parameters measured. Plant response parameters for each cultivar were individually correlated against the soil properties in . lists all parameters correlated against each response parameter measured for each cultivar.
Table 3. PLS regression results from plant growth and nectar parameter data of cultivars R, G and Y regressed against soil chemistry. Sig = whether the PLS model was significant or not. RMSEC = relative mean square error of the calibration model. R2 is the regression correlation value and Influence lists the main chemicals influencing the regression correlation.
Flowering phenology
Onset of flowering
The onset of flowering (start days) varied as a function of soil for cultivar R but not cultivar G. Cultivar Y flowered poorly on most soils except soil 5 and therefore no quantitative assessment of start of flowering against soil type for this cultivar is made. Cultivar R began flowering significantly earlier on soils 5 and 9 than on soil 3 (P ≤ 0.002). Plants on soils 5 and 9 flowered up to 5 weeks longer than plants on soils 3, 8 and 2 and 10. PCA analysis of the soil properties () does not fully elucidate what is influencing flowering onset although regression analysis () of all properties show a low but significant correlation (R2 = 0.37) between Mn, chloride and SO4 concentration and onset of flowering (start days).
Flower numbers
To assess flower numbers, we assumed seed capsule numbers were a direct function of flower numbers and that all plants had an equal chance of being pollinated. The interaction of soils with cultivars was significant for flower numbers and depended on the cultivar (P ≤ 0.032). For cultivar Y, plants on soil 5 had significantly higher flower numbers than any of the other 9 soils with no significant difference between the other 9 soils. For cultivar R, plants on soil 5 had significantly higher numbers of flowers than those on soils 8, 3, 4, 2, 1, 7 and 9 but were the same as soils 6 and 10. Flower numbers on soils 7, 1 and 9 were significantly lower than the other soils. Flower numbers for cultivar G were not significantly affected by soil chemistry. We therefore suggest that soil properties have a significant effect on L. scoparium flowering which is important with respect to overall nectar yield (more flowers will lead to more nectar). Regression analysis in suggests that sulphate, manganese, iron and calcium concentration and CEC have a significant effect on flower numbers (R2 = 0.31 for cultivar R and R2 = 0.94 for cultivar Y).
Flowering period
Cultivar G had a significantly longer flowering period than cultivar R. However, the onset of flowering varied as a function of soil for cultivar R but not cultivar G. Cultivar R showed a significant difference (P ≤ 0.001) where plants on soil 5 flowered for significantly longer periods than those on soils 4, 3, 1, 2, 6 and 8 (). On average, cultivar R flowered for periods between 30 and 50 days longer on soil 5 than the same cultivar on soils 4, 3, 1, 2, 6 and 8. Cultivar Y flowered poorly and therefore no assessment of the effect of soil on the flowering period of cultivar Y is made. Regression analysis of flowering period for cultivar R against the soil parameters indicates a significant influence of sulphate, manganese and chloride concentration and CEC on flowering period (R2 = 0.65).
Nectar DHA concentration and yield
There was no significant effect of soil type or cultivar on DHA concentration ( and Tables S1 & S3). However, there was a significant difference in overall nectar yield (g sugar per flower) between cultivars R and G. Cultivar G had the highest sugar yield at 0.0063 g of sugar per flower, compared with R, at 0.0046 g of sugar per flower (). The nectar yield for Cultivar Y could not be measured due to limited flowering. ANOVA and GLM showed a significant interaction (P ≤ 0.038) between soils and cultivars for yield, indicating that the difference between the cultivars is affected by soil. Cultivar G had a significantly higher nectar yield on soils 5 and 3 than soil 10; up to 0.0037 g on soil 5 which is a 90% increase in yield. Yield on soil 10 is up to 90% lower than other soils and indicates that soil type is an important factor to consider in terms of potential overall yield to the honey industry. Indications from the PCA plot of PC2 versus PC3 illustrates that the increased yield in G on soil 5 and 3 is influenced by calcium levels although PLS regression analysis shows no significant influence on yield from soil properties. The factor influencing nectar yield in this cultivar is not clear from these results. Possibly soil structure and relative water availability due to soil structure could be a possible confounding factor in overall nectar yield and warrants further investigation.
Regression analysis of response parameters against each other
Correlations of response parameters against each other were also assessed. Linear regression analysis of the various growth factors against the various flowering factors showed no correlation indicating that aspects of flowering (start of flowering, flowering period and flower numbers) are not associated with the growth rate or amounts of growth in L. scoparium. Using simple linear regression for response factors against each other there is a significant correlation R2 = 0.87 between the start of flowering and how long the plants flowered for. There was no correlation between start of flowering or flowering period against flower numbers. A simple regression of soil structure type against response parameters showed some correlation of soil structure with the start of flowering and plant height, but no correlation with the other parameters measured.
Interaction effects between the cultivars grown on the 10 soils
Interaction effects represent the combined effects of factors on the response parameter measured. When an interaction effect is present, the impact of one factor depends on the level of the other factor. Differences in the growth and flowering response parameters on the soils were noted between the cultivars. ANOVA analysis showed a significant interaction for some parameters between the cultivars and the soils, indicating that response of the plants to the soil depended on the cultivar. The three cultivars R, G and Y did not respond to soils in the same pattern; some parameters were the same for a particular soil type and some were not. This has an important impact to the mānuka honey industry indicating that overall yield will depend in some cases on the cultivar chosen and the soil in the region chosen for planting. summarises the significance of the interactive effect of soils and cultivar for the measured parameters. For the response parameters that showed no interaction between the soil type and cultivar, presents the relative ranking of the cultivars for each parameter. Cultivar G had a significantly longer flowering period than R, however the onset of flowering was earlier for R than G. For basal stem and height, Cultivar Y was greater than R and G, however G had a greater basal stem than R but R had greater height than G. In terms of DHA composition there was no significant difference between cultivars G and R. For RGR, flower numbers and nectar yield in grams of sugar per flower, a significant interaction between the soil and the cultivar was observed and that the effect of soil depended on the cultivar (). describes the significant interactions among soils and cultivars and quantifies the similarity between the cultivars for those parameters.
Table 4. Summary of analysis of variance (ANOVA) to assess the differences between the cultivars in terms of response to measured parameters. Interaction category: Y, there was a significant interaction (P ≤ 0.05) between the cultivar and the soils for that parameter in which case further data analysis is shown in ; and N, no significant interaction between the soils and the cultivars and the overall differences between the three cultivars is listed in column CV.
Table 5. Interaction results for the parameters that showed a significant interaction between the cultivar (CV) and the soils (). This data show that the effect of soil on seed capsule numbers, relative growth rate (RGR) and nectar yield depended on the cultivar and differed for each cultivar depending on the soil. The interaction column designates which cultivars had the same ( = ) or different (≠) interactions with the soils.
The interactions described in show that nectar yield for cultivars G and R was the same on all soils except for soils 3 and 5. RGRs for all three cultivars were the same on soils 3, 4, 5, 8, 9 and 10 (i.e. Y = G = R). However, on soils 1, 6 and 7, the RGR for Y and G were the same (Y = G) and G and R were the same (G = R), however Y ≠ R. On soil 2 the RGR of G = R but Y ≠ G and Y ≠ R. The interaction of cultivar and soil for seed capsules was complex. Cultivar G = R for seed capsules for all soils except soil 5. For soil 5 all three cultivars had a different response in terms of seed capsule numbers. For the other nine soils whether G = Y or R = Y was very variable in all the soils (). This data reiterates that the response of the plants to the soil range depends on the cultivar and that overall yield will depend in some cases on the cultivar chosen and the soil in the region chosen for planting.
Ranking soils for best performance based on growth and floral data
Data on the growth and floral performance of the cultivars tested in this work were used to model soils which had the highest potential to increase overall yield for the mānuka honey industry. Two key parameters of this model are plant nectar yield (Yd):(1) where S = g of nectar per flower, SC = seed capsule numbers (a measure of floral density) and DHA = dihydroxyacetone concentration mg/kg and nectar potential (NP):
(2) where NP = nectar potential, FP = flowering period and YD = (ug nectar/flower*DHA conc.)*FD where FD = a measure of floral density.
Once calculated these parameters are used to define a mānuka soils index (MSI):(3) where NP = nectar potential, RGR = relative growth rate and BF = bee factor (i.e. * 1 if all bees out *0.5 if 50% bees out *0 if no bees out).
Calculated NP and MSI values are displayed in . The greatest nectar potential was recorded for soil 5 for both cultivars. Calculated NP provides data on the potential nectar resources available to bees in terms of a food source during a flowering season. For cultivar R, NP for soil 5 was significantly greater than all other soils with no significant difference in NP between the other soils. For cultivar G, NP was only significantly greater for soil 5 relative to soil 2.
Table 6. Calculated nectar potential (NP) and MSI value for cultivars R and G. Ranking is defined by Tukey’s comparison of means at the 95% confidence level. Means that do not share a letter are significantly different.
The MSI values in quantify the soils that offer the highest potential for overall NPA honey yield for each cultivar. The MSI value shows that soil 5 has the highest potential for both cultivar R and G, whereas soil 7 has the lowest potential for cultivar R and second lowest for cultivar G. The MSI for cultivar R on soil 5 was significantly greater than each of the other soils (P ≤ 0.001), whereas the MSI for cultivar G on soil 5 was only significantly greater than on soil 2 (P ≤ 0.001). Cultivar Y could not be assessed for an MSI value due to the lack of nectar data, but statistical analysis of data for seed capsules and RGR shows that plants on soil 5 had the best overall growth and flowering. Soil analysis PCA results in indicate that P, SO4, chloride and Fe are the most obvious elements that have significantly different concentrations in soil 5. However, PLS analysis results in show that Fe, Mn and Ca are the common soil nutrients significantly influencing flowering in cultivars R and Y with SO4 and Mn the common soil nutrients influencing overall plant growth in all three cultivars.
Overall, annual NPA honey potential would include assessment of bee activity, local and seasonal weather conditions; for example, reduced daily temperatures and rain at the time of flowering will affect bee activity and if plants flower when there is no bee activity then the potential MSI value is reduced to zero.
Discussion
Our results indicate that soil chemical characteristics in land areas being examined for high-yielding mānuka plantations is an important factor for consideration when selecting cultivars for the honey industry in New Zealand.
Our data indicate that, contrary to previously reported studies, L. scoparium has improved growth and floral density on soils with increased nutrient concentration. For example, improved performance was recorded on the control soil which contained significantly higher concentrations of the nutrients SO4, P, Fe and chloride than the field New Zealand soils in this experiment and greater than the mean range of natural New Zealand soils (). Common soil components across all cultivars that support further investigation are: CEC, SO4, Mn, Ca, chloride and Fe concentration for plant growth; SO4, Mn and chloride concentration for flowering period; and Fe, Mn and Ca concentration for flower numbers.
The Ca content of soil has been associated with flowering in tropical trees, as well as lilac, hazel and red currant (Wielgolaski Citation2001; Cardoso et al. Citation2012). While a relationship is demonstrated between Ca and flower numbers in the current work, PLS analysis also indicates that the Mn and Fe concentration of the soil may also affect flowering and growth of mānuka. Many woody shrubs are affected by Fe and Mn deficiencies and these elements are more readily available to plants in soils with more acidic pH (Wielgolaski Citation2001; Riki et al. Citation2014). The improved flowering on soils 5 and 9 may have been in response to greater plant-available Mn and Fe resulting from the higher acidity (< pH6) in those soils. However, superior flowering performance on soil 1 with a pH of 6.6 and lower Ca levels is inconsistent with this observation and indicates some other confounding factor, possibly soil structure having an additional influence. Soil 1 is a sandy loam whereas soils 5 and 7 are peat based. An effect of soil structure on the growth performance of Salix caprea and Prunus padus has been reported previously (Wielgolaski, Citation2001), where plant development in Prunus and flowering in S. caprea was correlated with the bulk density and gravel content of soil; this correlation was hypothesised to be related to the water holding potential of the soil or, possibly, the effect of the soil structure on the availability of nutrients.
Wielgolaski (Citation2001) suggests that soil factors, along with climatic factors, influence the timing of plant development including flowering in a number of plant species. In agreement, our observations showed that flowering phenology, nectar yield and plant growth were significantly different in the examined mānuka cultivars grown on a number of soils under constant and controlled environmental conditions, strongly suggesting that soil factors influence plant development and flowering in mānuka.
Furthermore, additional plantation worth may be realised through targeted fertilisation of mānuka stands and plantations. The potential of fertilisation strategies should be further researched through the correlation of field collected soil, plant data and field trials.
The usefulness of modelling mānuka growth and flowering using the MSI formulae to assess cultivar potential for various sites in New Zealand has the potential to inform the selection of locations for new mānuka plantations and, additionally, select cultivars relevant to soil characteristics of the various regions of New Zealand. Whilst L. scoparium does establish on nutrient-deficient soils and in marginal areas where there is little competition from climax forest, improved growth and flowering may be facilitated with improved commercial plantation development, and it is likely there is a degree of dependence on soil nutrition factors.
Table S3.
Download PDF (184.6 KB)Table S2.
Download PDF (202.4 KB)Table S1.
Download PDF (201.4 KB)Figure S1.
Download PDF (215.1 KB)Acknowledgements
We would like to acknowledge the staff at the Plant Growth Unit at Massey University, Palmerston North, New Zealand for support with the glasshouse experimental setup, Chris Rawlingson, Institute of Agriculture and Environment, Massey University, Palmerston North, New Zealand for assistance with HPLC instrumentation and supporting staff from Massey University, Palmerston North, New Zealand who assisted with nectar collection and plant growth data measurements. Associate Editor: Dr Janice Lord.
Disclosure statement
No potential conflict of interest was reported by the authors.
Additional information
Funding
References
- Adams CJ, Manley-Harris M, Molan PC. 2009. The origin of methylglyoxal in New Zealand manuka (Leptospermum scoparium) honey. Carbohydrate Research. 344:1050–1053. doi: 10.1016/j.carres.2009.03.020
- Alonso-Blanco C, Mendez-Vigo B, Koornneef M. 2005. From phenotypic to molecular polymorphisms involved in naturally occurring variation of plant development. The International Journal of Developmental Biology. 49:717–732. doi: 10.1387/ijdb.051994ca
- Atrott J, Haberlau S, Henle T. 2012. Studies on the formation of methylglyoxal from dihydroxyacetone in manuka (Leptospermum scoparium) honey. Carbohydrate Research. 361:7–11. doi: 10.1016/j.carres.2012.07.025
- Bergin DO, Kimberley MO. 2014. Factors influencing natural regeneration of totara (Podocarpus totara D.Don) on grazed hill country grassland in Northland, New Zealand. Journal of Forestry Science. 44:13–23.
- Blakemore LC, Searle BK, Daly BK. 1987. Methods for chemical analysis of soils. Lower Hutt, New Zealand: NZ Soil Bureau, Dept. of Scientific and Industrial Research, NZ Soil Bureau scientific report.
- Brun LA, Le Corff J, Maillet J. 2003. Effects of elevated soil copper on phenology, growth and reproduction of five ruderal plant species. Environmental Pollution. 122:361–368. doi: 10.1016/S0269-7491(02)00312-3
- Cardoso FCG, Marques R, Botosso PC, Marques MCM. 2012. Stem growth and phenology of two tropical trees in contrasting soil conditions. Plant and Soil. 354:269–281. doi: 10.1007/s11104-011-1063-9
- Davis AR. 1997. Influence of floral visitation on nectar-sugar composition and nectary surface changes in eucalyptus. Apidologie. 28:27–42. doi: 10.1051/apido:19970104
- Dawson M. 1997. A history of Leptospermum scoparium in cultivation—discoveries from the wild. The New Plantsman. 4(1):51–59.
- Donarski JA, Roberts DPT, Charlton AJ. 2010. Quantitative NMR spectroscopy for the rapid measurement of methylglyoxal in manuka honey. Analytical Methods. 2:1479–1483. doi: 10.1039/c0ay00125b
- Douglas MH, van Klink JW, Smallfield BM, Perry NB, Anderson RE, Johnstone P, Weavers RT. 2004. Essential oils from New Zealand manuka: triketone and other chemotypes of Leptospermum scoparium. Phytochemistry. 65:1255–1264. doi: 10.1016/j.phytochem.2004.03.019
- Eriksson L, Trygg J, Wold S. 2014. A chemometrics toolbox based on projections and latent variables. Journal of Chemometrics. 28:332–346. doi: 10.1002/cem.2581
- Esbensen KH, Guyot D, Westad F, Houmoller LP. 2004. Multivariate data analysis—in practice. An introduction to multivariate data analysis and experimental design. 4th ed. Oslo, Norway: CAMO.
- Forst JRG. 1986. Environmental factors involved in growth, flowering and post harvest flowers of Leptospermum scoparium. Israel Journal of Botany. 35:101–108.
- Funk JM, Field CB, Kerr S, Daigneault A. 2014. Modeling the impact of carbon farming on land use in a New Zealand landscape. Environmental Science & Policy. 37:1–10. doi: 10.1016/j.envsci.2013.08.008
- Greer DH, Muir LA, Harris W. 1991. Seasonal frost hardiness in Leptospermum scoparium seedlings from diverse sites throughout New Zealand. New Zealand Journal of Botany. 29:207–212. doi: 10.1080/0028825X.1991.10416722
- Haberlein H, Tschiersch K-P. 1998. On the occurrence of methylated and methoxylated flavonoids in Leptospermum scoparium. Biochemical Systematics and Ecology. 26:97–103. doi: 10.1016/S0305-1978(97)00084-7
- Hall IR. 1977. Effect of applied nutrients and endomycorrhizas on Metrosideros umbellata and Leptospermum scoparium. New Zealand Journal of Botany. 15:481–484. doi: 10.1080/0028825X.1977.10432553
- Johnson CM, Nishita H. 1952. Microestimation of sulfur in plant materials, soils, and irrigation waters. Analytical Chemistry. 24:736–742. doi: 10.1021/ac60064a032
- Mattila M, Koskinen K, Saloheimo K. 2004. Novel multivariate calibration methods for x-ray analyzer. New Technologies for Automation of Metallurgical Industry 221–226.
- Morris JD. 1984. Establishment of trees and shrubs on a saline site using drip irrigation. Australian Forestry. 47:210–217. doi: 10.1080/00049158.1984.10676004
- Murphy J, Riley JP. 1962. A modified single solution method for the determination of phosphate in natural waters. Analytica Chimica Acta. 27:31–36. doi: 10.1016/S0003-2670(00)88444-5
- Perry NB, Van Klink JW, Brennan NJ, Harris W, Anderson RE, Douglas MH, Smallfield BM. 1997. Essential oils from New Zealand mānuka and kanuka: chemotaxonomy of Kunzea. Phytochemistry. 45:1605–1612. doi: 10.1016/S0031-9422(97)00203-3
- Riki G, Mobasser HR, Ganjali HR. 2014. Effect of iron and manganese foliar spraying on some quantitative characteristics of canola. International Journal of Biosciences. 5:61–68.
- Ryser P, Sauder WR. 2006. Effects of heavy-metal-contaminated soil on growth, phenology and biomass turnover of Hieracium piloselloides. Environmental Pollution. 140:52–61. doi: 10.1016/j.envpol.2005.06.026
- Sperens U. 1997. Long-term variation in, and effects of fertiliser addition on, flower, fruit and seed production in the tree Sorbus aucuparia (Rosaceae). Ecography. 20:521–534. doi: 10.1111/j.1600-0587.1997.tb00421.x
- Staggemeier VG, Diniz-Filho JAF, Morellato LPC. 2010. The shared influence of phylogeny and ecology on the reproductive patterns of Myrteae (Myrtaceae). Journal of Ecology. 98:1409–1421. doi: 10.1111/j.1365-2745.2010.01717.x
- Stephens JMC, Molan PC, Clarkson BD. 2005. A review of Leptospermum scoparium (Myrtaceae) in New Zealand. New Zealand Journal of Botany. 43:431–449. doi: 10.1080/0028825X.2005.9512966
- Wielgolaski FE. 2001. Phenological modifications in plants by various edaphic factors. International Journal of Biometeorology. 45:196–202. doi: 10.1007/s004840100100
- Williams S, King J, Revell M, Manley-Harris M, Balks M, Janusch F, Kiefer M, Clearwater M, Brooks P, Dawson M. 2014. Regional, annual, and individual variations in the dihydroxyacetone content of the nectar of mānuka (Leptospermum scoparium) in New Zealand. Journal of Agricultural and Food Chemistry. 62:10332–10340. doi: 10.1021/jf5045958
- Wilson JB, Yin RH, Mark AF, Agnew ADQ. 1991. A test of the low marginal variance (LMV) theory in Leptospermum scoparium (Myrtaceae). Evolution. 45:780–784. doi: 10.2307/2409930
- Windsor SAM, Brooks P, Williams S, Manley-Harris M. 2012. A convenient new analysis of dihydroxyacetone and methylglyoxal applied to Australian Leptospermum honeys. Journal of Pharmacognosy and Phytotherapy. 4:6–11.
- Yin R, Mark AF, Wilson JB. 1984. Aspects of the ecology of the indigenous shrub Leptospermum scoparium (Myrtaceae) in New Zealand. New Zealand Journal of Botany. 22:483–507. doi: 10.1080/0028825X.1984.10425282