
ABSTRACT
We investigated the phylogeography of the New Zealand endemic monotypic coastal tree Entelea arborescens (whau; Malvaceae). The distribution of whau in the southern North Island and South Island has been suggested to result from pre-European Māori cultivation. Whau wood is extremely buoyant and was used to make fishing floats and rafts. We sequenced two chloroplast loci and the nuclear ITS region and genotyped nine microsatellite loci from samples collected across the species’ range. The different genetic markers produced concordant results and revealed two principal genetic clusters, which were estimated to have diverged during the Pleistocene. The distribution of these clusters shows an east–west split across the northern North Island, which does not correspond to the phylogeographic patterns observed to date for other New Zealand coastal plant species and is difficult to reconcile with any known geological or environmental events. Both clusters were represented in the putative translocated populations indicating that these southern populations had multiple origins. However, the wide distribution of these genetic clusters prevents determination of the source of these southern populations and a natural origin cannot be excluded.
Introduction
Since the Pliocene the evolution of New Zealand’s biota has been shaped by fluctuations in sea-level, tectonic activity and glacial cycling (Wardle Citation1963; Fleming Citation1975; McGlone Citation1985; McGlone et al. Citation2001). The northern North Island was not impacted as severely by volcanism and glaciation as elsewhere in New Zealand and is thought to have maintained extensive forest during this time (Newnham et al. Citation2013). Instead, fluctuations in sea-level may have influenced the evolution of the fauna and flora of this regions, with parts of Northland isolated as islands during times of elevated sea-level (Fleming Citation1975; Isaac et al. Citation1994).
Phylogeographic studies in the northern North Island have revealed extensive population structuring in plants (e.g. Gardner et al. Citation2004; Shepherd et al. Citation2016; Shepherd et al. Citation2017), invertebrates (e.g. Morgan-Richards et al. Citation2001; Buckley and Leschen Citation2013; Myers et al. Citation2017) and lizards (Hare et al. Citation2008). However, discordant phylogeographic patterns have been observed, even between related taxa with similar distributions (Spencer et al. Citation2006; Hare et al. Citation2008), indicating contrasting responses to historical processes. This illustrates the importance of examining multiple species in order to develop an accurate picture of how communities have been affected by past environmental changes.
Entelea (Malvaceae) is a monotypic genus endemic to New Zealand. The sole species, Entelea arborescens R.Br. is usually known by the Māori name whau though it has also been called hauama, houama or whauama (Riley Citation1994). It is a small tree reaching up to 15 m tall, though usually much less, with distinctive, large, soft leaves and white flowers borne in sub-umbellate, many-flowered cymes. The flowers are insect pollinated (Heine Citation1938). Unusually for a New Zealand tree, whau has subglobose to globes fruits covered in rigid, spinose black to charcoal grey hairs up to 25 mm long (Millener Citation1946; de Lange Citation2018). The main dispersal mechanism of whau seeds is unclear. They have been suggested to disperse through attachment of their encasing spiny capsules to animals (Thorsen et al. Citation2009), although no supporting evidence for this assertion was provided. Chloroplast and nuclear sequences indicate that the closest relative of whau is the Afro-Madagascan genus Sparrmannia (Brunken and Muellner Citation2012; Benor Citation2018), and molecular dating estimates that the two genera diverged 11.5 mya (Richardson et al. Citation2015).
Whau grows mostly near the coast from the Three Kings Islands in northern New Zealand to the northern South Island in lowland forest or shrubland but it is most common in the northern North Island north of Kawhia Harbour and Mahia Peninsula (de Lange Citation2018). South of those locations, in the North Island, whau is known from assumedly natural populations in scattered sites along the North Taranaki coastline, the southern Hawkes Bay, Eastern Wairarapa, Cape Palliser and Kapiti coastline (Dawson and Lucas Citation2011; de Lange Citation2018). Indications are that the species probably always had a naturally sporadic distribution (Millener Citation1946; Allan Citation1961). However, as the species is palatable to a range of introduced browsing animals, it is now scarce over large parts of its former range, and it is now most common on predator free offshore islands (de Lange Citation2018). Whau is also a short-lived, light demanding species that is intolerant of frost, strong winds and sites that are either too dry or too wet (Millener Citation1946). While whau is more usually associated with coastal habitats and northern offshore islands some occurrences inland and in the southern portion of its distribution have been suggested to derive from plantings by pre-European Māori (Clarkson Citation1991; Leach and Stowe Citation2005) Many of these sites are associated with archaeological features or grow in close association with other plants known to be to have been cultivated by pre-European Māori, such as karaka (Corynocarpus laevigaetus) (Leach and Stowe Citation2005). Whau may have been cultivated for its wood, which is extremely buoyant owing to its very low density (Butterfield Citation2003). Whau wood was used by Māori to make fishing floats and buoys (Taylor Citation1855; Colenso Citation1869), and Ngāti Porou, a Māori tribe inhabiting the eastern North Island, used it to make rafts (mōkihi) for fishing close to the shore (Best Citation1925). Whau wood was also used to make the flute-like instrument kōauau (Andersen Citation1923). In addition, the branches and leaves were used in healing rituals; the soft leaves as a wrapping for new-born infants, and the sap to embalm the dead (Riley Citation1994).
Here we examine the phylogeography of whau using both chloroplast and nuclear DNA markers. Our main aims were to (1) investigate the relationships of the whau populations hypothesised to derive from Māori cultivation and determine their source(s) and to (2) examine the phylogeography of whau within the northern North Island and provide a comparison with the phylogeographic patterns observed in other taxa with similar distributions.
Methods
Sampling
Specimens of Entelea arborescens were collected from 73 sites throughout its range (Table S1). Between one and four samples were collected per population giving a total of 107 samples included in the study. For each specimen approximately 3 cm2 of leaf tissue was cut into small pieces and stored in silica-gel. DNA was extracted from the silica-gel dried leaf tissue using the modified-CTAB extraction protocol specifically developed for the polysaccharide-rich leaves of this species (Shepherd and McLay Citation2011).
PCR amplification and sequencing
Eleven noncoding chloroplast loci from Shaw et al. (Citation2007) were tested for variation in a subset of Entelea samples. Two loci (the trnS(UGA)-trnfM(CAU) and psbD-trnT(GGU) regions) produced clean sequences and demonstrated more than one variable site so both loci were sequenced in 77 samples. The nuclear internal transcribed spacer (ITS) was PCR amplified with the primers ITS4 and ITS5 (White et al. Citation1990) and sequenced from 66 samples. For all three loci PCRs were performed in 12 µl reactions with 1 × MyTaq reagent buffer (Bioline, Australia), 5 pmol of each primer and 1 M betaine. PCR thermocycling followed the ‘slow and cold’ programme from Shaw et al. (Citation2007).
PCR products were visualised by agarose gel electrophoresis. Amplification products were purified by digestion with 0.5 U shrimp alkaline phosphatase (SAP, USB Corp.) and 2.5 U exonuclease I (ExoI, USB Corp.) at 37°C for 15 min, followed by inactivation of the enzymes at 80°C for 15 min. Sequencing was performed with the ABI Prism Big Dye Terminator cycle sequencing kit version 3.1 on an ABI 3730 DNA sequencer (Massey University Genome Service, Massey University, Palmerston North, New Zealand). Sequences were edited with Sequencer version 5.2.4 (Gene Codes Corp., Ann Arbor, MI, USA) and aligned by eye.
DNA sequence analyses
The genealogical relationships between DNA sequences were determined using median-joining networks (Bandelt et al. Citation1999) produced with PopART (Leigh and Bryant Citation2015). Transitions and transversions were equally weighted and indels were recoded as single events. Separate networks were produced for the concatenated chloroplast loci and the nuclear locus.
GST and NST were calculated for the purportedly natural populations (sites 1–61) to test for the presence of phylogeographic structuring with Spads 1.0 (Dellicour and Mardulyn Citation2014), with the concatenated chloroplast and nuclear loci analysed separately. For each comparison GST and NST were compared using a permutation test with 1000 permutations. GST is calculated using only haplotype frequency data, whereas NST takes the relationships between haplotypes into account. An NST significantly greater than GST suggests the presence of phylogeographic structuring with closely related haplotypes more likely to occur together in the same population (Pons and Petit Citation1996).
In order to date the divergence times within whau, we performed molecular clock analyses using the ITS sequences of whau, Sparrmannia ricinocarpa and S. palmata in BEAST 2.1.3 (Bouckaert et al. Citation2014). Indels between the two genera were difficult to align so were excluded from the alignment (5 bp were excluded of the 647 bp alignment). To test for clock-like evolution we examined the log of the standard deviation in rates (ucld.stdev statistic) in TRACER 1.6 (Rambaut et al. Citation2013). The frequency histogram abutted zero indicating that there is little rate variation across lineages and a strict molecular clock cannot be rejected (Drummond et al. Citation2007). Strict molecular clock analyses were performed on the ITS alignment with the GTR model of sequence evolution, selected using the Akaike information criterion in jModelTest v0.1.1 (Posada Citation2008), empirical base frequencies and a birth–death model tree prior. The fossil record of the Malvaceae is sparse (Carvalho et al. Citation2011) and the high level of ITS sequence variation within the Malvaceae makes sequence alignment difficult. Therefore, for molecular dating we used an average substitution rate of 2.15 × 10⁻⁹ substitutions per site per year ±1.85 × 10⁻⁹, based on independently calibrated ITS substitution rates from 18 woody plant groups (Kay et al. Citation2006). The analyses were run for 200 million generations, with the first 10% of samples discarded as burn-in. Convergence was confirmed by performing three independent analyses with different starting seeds and checking plots of –lnL across generations and ESS for each parameter (>200 for all cases) with TRACER 1.6 (Rambaut et al. Citation2013).
Microsatellite development and genotyping
Extracted DNA from four whau samples from different populations was pooled and amplified using a REPLI-g kit (QIAGEN, Hilden, Germany) following the manufacturer’s protocol to generate sufficient template for library construction. An Illumina paired-end genomic library was constructed using the TruSeq Nano DNA Library Prep Kit (Illumina) following the manufacturer’s instructions. The library was sequenced in a single lane using the Illumina MiSeq platform to generate 2 × 250 bp reads at the Massey Genome Service (Massey University, Palmerston North, New Zealand). The resulting 10015906 paired sequence reads were assembled using MEGAHIT (Li et al. Citation2015), as described in Bulgarella et al. (Citation2017). The SSR_pipeline (Miller et al. Citation2013) was used to detect di- and tetranucleotide repeats on this contig set with a minimum of 250 bp flanking sequence on each side to allow for PCR primer design. We used WebSat (Martins et al. Citation2009) to develop primers for 57 loci, which had at least seven tetra- or 20 dinucleotide repeat units. An M13 tag (TGTAAAACGACGGCCAGT) was added to the 5’ end of the forward primer of each locus. Primer pairs were tested on five whau samples, by amplification in 10 μL PCR reactions containing 1 μL of diluted template DNA, 2 pmol forward primer, 8 pmol each of reverse primer and M13 primer (labelled with FAM, NED, PET or HEX) and 1 × MyTaq mix (Bioline). PCR thermocycling conditions were an initial denaturation of 94°C for 5 min; 30 cycles of 94°C for 20 s, 53–56°C for 20 s, and 72°C for 20 s; followed by 8 cycles of 94°C for 20 s, 53°C for 20 s, and 72°C for 20 s and a final extension at 72°C for 15 min. PCR products were visualised by agarose gel electrophoresis.
Nine primer pairs amplified and were variable (Table S2). Three of these (EntArb13, EntArb24 and EntArb64) amplified weakly so the forward primers of each were re-ordered labelled with FAM. For these three loci PCR amplification was performed in 10 μL reactions that contained 1 μL of diluted template DNA, 5 pmol of each primer and 1 × MyTaq mix (Bioline). Seventy-two whau samples were genotyped for the nine loci.
Genotyping was performed on an ABI 3730 DNA sequencer at the Massey Genome Service (Massey University, Palmerston North, New Zealand). Alleles were sized using the internal size standard GeneScan 500 LIZ (Applied Biosystems) and scored using Geneious Software version 10.2.3 (Biomatters Ltd., Auckland, New Zealand).
Microsatellite analyses
Small sample sizes, such as our sampling for whau, may bias conventional population genetic statistics, such as observed heterozygosity and alleles per locus (Leberg Citation2002; Pruett and Winker Citation2008). Therefore we only calculated these values across all samples, using GenAlEx 6.5 (Peakall and Smouse Citation2012), rather than per population.
Population structure was examined with STRUCTURE v2.3.4 (Pritchard et al. Citation2000; Falush et al. Citation2007) without prior grouping assumptions. The number of genetic clusters (K) was set between 1 and 5, with 10 permutations for each. We used the admixture model with correlated allele frequencies and ran 100,000 generations of burn-in followed by 500,000 Markov Chain Monte Carlo (MCMC) iterations. The optimal number of genetic clusters (K) was obtained by calculating the ΔK statistic (Evanno et al. Citation2005) in STRUCTURE HARVESTER web v.0.6.94 (Earl and vonHoldt Citation2012). CLUMPP v.1.1.2 (Jakobsson and Rosenberg Citation2007) was used to average iterative runs of K and the results were visualised graphically with STRUCTURE PLOT (Ramasamy et al. Citation2014).
Results
Chloroplast sequences
The aligned length across both chloroplast loci was 1758bp (trnS(UGA)-trnfM(CAU) was 817 bp and psbD-trnT(GGU) was 941 bp). Within trnS(UGA)-trnfM(CAU) one 7 bp indel, one transition and one transversion defined three haplotypes. Three haplotypes were also detected at the psbD-trnT(GGU) region, these were distinguished by one 7 bp indel in a mononucleotide run and one transition. Combined, the aligned sequences of the two chloroplast loci distinguished four haplotypes in whau.
Population structuring in the chloroplast data was high (GST = 0.692, NST = 0.676) but NST was not significantly higher than GST (P = 0.67), indicating there was no phylogeographic component to the structuring. The relationships between the concatenated chloroplast sequences are shown in the median-joining network (). The two most common haplotypes, A and B, differed by three mutations. The two rarer haplotypes each differed from haplotype B by a single substitution. The distributions of the four chloroplast haplotypes are shown in . Haplotypes A and B were the most widespread. Haplotype A mainly occurred on the west coast of the North Island and haplotype B largely on the east coast. Haplotype C was only found on the east coast of the northern North Island in the Coromandel, Great Barrier Island and western Bay of Plenty. Haplotype D was found on both coasts with its distribution centred on Auckland.
Figure 1. A, Geographic distribution of chloroplast haplotypes in Entelea arborescens (whau). Each individual sample is represented by a single circle. The numbers in brackets are the sites’ identifying numbers (see Table S1 for more details). Sites 1–61 are believed to be naturally occurring and sites 62–73 suggested to derive from translocations. Basemap supplied by Kahuroa. B, Median-joining haplotype network for whau chloroplast haplotypes. The size of each circle is proportional to haplotype frequency. Hash marks indicate the number of mutational changes between each haplotype.
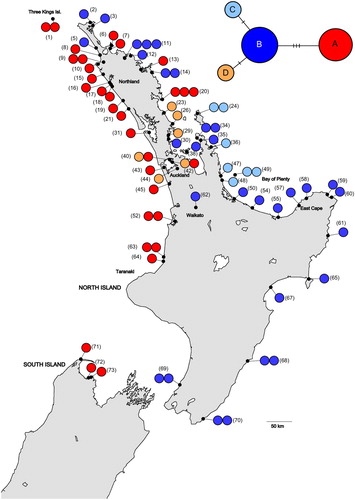
Two haplotypes (A and B) were detected in the putative translocated populations (sites 62–73). Haplotype A was found in north Taranaki (sites 63 and 64) and was the only haplotype detected in the South Island (sites 71–73). Haplotype B was detected from inland Waikato (site 62), the east coast of the North Island (sites 65, 67, 68 and 70) and the south-west of the North Island (site 69).
ITS sequences
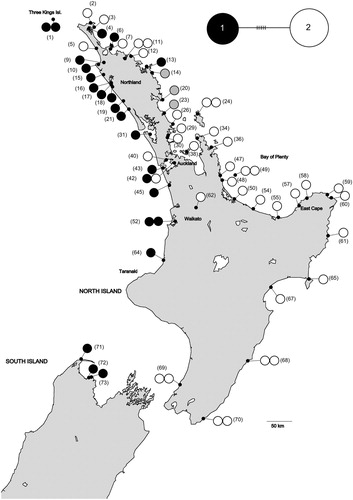
The aligned whau ITS sequences were 685 bp in length and included five substitutions (three transitions and two transversions), which distinguished two alleles. Three individuals showed additive nucleotides at the five allele-defining sites, indicating the presence of both alleles in these individuals. Population structuring was high in the ITS data but GST and NST were equal, indicating an absence of phylogeographic structuring (GST and NST = 0.820, p = 1.0).
The distribution of the ITS variants are mapped in . Allele 1 occurred predominantly on the west coast and allele 2 occurred mainly on the east coast. This distribution largely mirrored the distribution of chloroplast haplotypes A and B. Both ITS alleles were found in the putative translocated populations (sites 62–73). Allele 1 was found in north Taranaki (site 64) and the South Island (sites 71–73). Allele 2 was found in the inland Waikato (site 62), the east coast of the North Island (sites 65, 67, 68 and 70) and the south-west of the North Island (site 69).
Figure 2. A, Geographic distribution of internal transcribed spacer (ITS) sequences in Entelea arborescens (whau). Each individual sample is represented by a single circle. The three samples with grey circles have additive nucleotides at the five allele-defining sites, indicating the presence of both alleles in these individuals. The numbers in brackets are the sites’ identifying numbers (see Table S1). Sites 1–61 are believed to be naturally occurring and sites 62–73 suggested to derive from translocations. Basemap supplied by Kahuroa. B, Median-joining haplotype network for whau ITS variants. The size of each circle is proportional to haplotype frequency. Hash marks indicate the number of mutational changes between each variant.
The molecular clock analyses of the ITS sequences based on a substitution rate averaged from 18 woody plant species (Kay et al. Citation2006) indicated a Pleistocene divergence for the two ITS variants within whau (0.7 mya, 95% highest posterior density [HPD] 0–1.7 mya).
Microsatellite genotyping
The nine microsatellite loci (Table S2) displayed a total of 38 alleles, with 2–14 alleles per locus (mean ± SD: 4.2 ± 1.4). The putative translocated populations had lower diversity compared to the natural populations. Across all loci only 17 of the 38 microsatellite alleles were found in the putative translocated populations. No alleles were restricted to the putative translocated populations.
The Structure Harvester analysis of ΔK indicated that the optimal K was 2 (Figure S1). However, this method is unable to evaluate the ΔK value for K = 1 so we visually confirmed that the K = 2 plot made biological sense (). At higher values of K individuals were partitioned with low to moderate Q values across groups.
Figure 3. A, Structure plot of Entelea arborescens (whau) populations for K = 2 based on nine microsatellite markers. According to the ΔK, K = 2 represents the optimal structure partition in our dataset. The numbers are the sites’ identifying numbers. B, Pie charts for each whau sample indicate the assignment (Q-value) to each genetic cluster for K = 2. The numbers in brackets are the sites’ identifying numbers (see Table S1 for more details). Sites 1–61 are believed to be naturally occurring and sites 62–73 suggested to derive from translocations. Basemap supplied by Kahuroa.
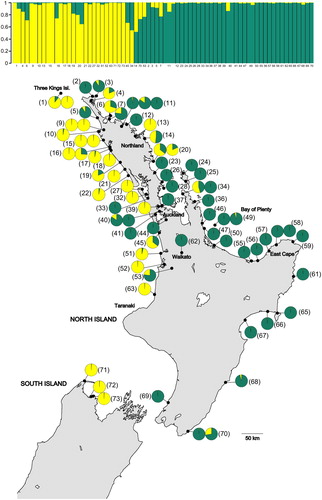
At K = 2 the split between the two microsatellite clusters broadly corresponded to the split in the chloroplast and ITS data. The putative translocated populations from northern Taranaki (site 63) and the South Island (sites 71–73) were assigned to a cluster predominantly found on the west coast of northern North Island. Individuals from the remaining putative translocated populations (sites 62, 65–70) were assigned to the other cluster, which was mainly restricted to the eastern North Island.
Discussion
Phylogeography of whau
Whau exhibited significant genetic structuring with two genetic lineages evident within all three genetic datasets. One lineage was found predominantly along the western coastline of the northern North Island and the other along the eastern coastline. The main area where the two lineages co-occurred was in the Auckland region, where the east and west coasts were connected prior to the formation of the Auckland isthmus in the Late Quaternary (Neall and Trewick Citation2008) and are still naturally in close proximity. However, there has also been much planting of whau over the last forty or so years by local councils, restoration groups and private individuals in Auckland using a range of often unspecified local sources. The observed east–west split does not correspond to the postulated position of Northland Pliocene islands during lowered sea level (Isaac et al. Citation1994). Our crude dating estimated a Pleistocene divergence for these lineages, which suggests that, despite the presence of continuous forest from this time (Newnham et al. Citation2013), there was not continual gene flow among whau populations.
The east–west split in whau contrasts with the phylogeographic patterns observed in the tree karaka (Corynocarpus laevigatus) and the herb rengarenga (Arthropodium cirratum), two other coastal plant species with similar northern North Island distributions to whau (Atherton et al. Citation2015; Shepherd et al. Citation2016; Shepherd et al. Citation2018). The only phylogeographic split observed at the ITS and waxy loci within karaka was also dated to the Pleistocene but it distinguished samples from the Three Kings Islands from the remainder of New Zealand (Atherton et al. Citation2015). Chloroplast sequences and microsatellite genotyping of rengarenga revealed very high genetic diversity and structuring, with almost every natural rengarenga population characterised by unique chloroplast haplotypes and/or microsatellite alleles (Shepherd et al. Citation2016; Shepherd et al. Citation2018). Higher level structuring in the rengarenga chloroplast data, as determined by a SAMOVA analysis (Dupanloup et al. Citation2002), did not reflect an east–west North Island split.
The different phylogeographic patterns observed in these three species may have originated by chance or from differences in their life histories. Whau, karaka and rengarenga all have insect pollinated flowers (Heine Citation1938; Walsh Citation1967; Zhou et al. Citation2012) indicating that the differences in phylogeographic patterns may not be a consequence of differences in pollen movement. However, there may be differences in seed dispersal between the three species. The seeds of karaka are eaten and dispersed by animals. Rengarenga seeds are dispersed either by gravity (Reid et al. Citation2009), or wind (Thorsen et al. Citation2009) but since they are relatively heavy for wind-dispersed seeds they are unlikely to disperse far. The high level of chloroplast and nuclear structuring in rengarenga indicates that seed dispersal is likely to be highly restricted in this species. The proposed dispersal of whau seeds through attachment to animals (Thorsen et al. Citation2009) would be unlikely to produce the observed east–west phylogeographic split. Dispersing animals, such as the following moa species, Euryapteryx curtus, Dinornis novaezealandiae and Pachyornis geranoides (Worth & Holdaway Citation2002; Tennyson & Martinson Citation2006), would be expected to cross the Northland isthmus thus facilitating gene flow of whau between both coastlines. Alternatively, the dispersal of whau seeds may occur via water and/or wind with the capsules observed to float and blow along the ground (PdL, pers. obs.; A. Veale, Unitec Institute of Technology, pers. comm. 2018). Wind or water dispersal would be more likely to have led to the development of an east–west phylogeographic split in whau because of the pattern of movement exhibited by near shore currents in the North Island (see de Lange & de Lange Citation1994) and a similar east–west split has been observed in several marine taxa, which disperse via water (reviewed in Ross et al. Citation2009). However, experimental research is required to determine which, if any, of these seed dispersal mechanisms occur in whau.
An east–west phylogeographic split across the northern North Island has previously been observed in two terrestrial taxa. The coastal skink Oligosoma smithi exhibited two clades, which broadly showed the same distribution as the two whau lineages (Hare et al. Citation2008). However, the date of divergence was estimated as Pliocene in age (4.29 mya), which is much older than our divergence estimate for the whau lineages and may indicate that the similarities in patterns are a result of pseudocongruence (Soltis et al. Citation2006). The kauri snail Paryphanta busbyi also demonstrated an east–west split across Northland, which was dated to 1–3.4 mya (Spencer et al. Citation2006). Spencer et al. (Citation2006) stated that there was no simple geological explanation for this observed pattern.
Origins of the putative translocated populations of whau
The lack of novel genetic variation (chloroplast haplotypes, ITS alleles and microsatellite alleles) in the putatively translocated populations of whau indicates that these populations have not been isolated for sufficient time for novel variation to have evolved. This is consistent with a translocation origin for these populations but the null hypothesis of a recent natural origin via chance long distance dispersals to suitable frost-free coastal locations cannot be rejected.
Regardless of whether the southern populations derive from natural or human-mediated dispersal, they result from at least two independent introductions. The South Island and Taranaki populations grouped in the western lineage. In contrast the southern North Island populations grouped with the eastern lineage. The wide distributions of each lineage within northern North Island prevents the identification of the precise sources of these southern populations. This result contrasts with Arthropodium cirratum (Shepherd et al. Citation2016; Shepherd et al. Citation2018) and Veronica speciosa (Armstrong and de Lange, Citation2005 – as Hebe speciosa), whose southern populations have also been proposed to derive from translocation. These species have high levels of structuring in their natural populations allowing the origins of the cultivated populations to be determined. Furthermore, the putative translocated populations of Arthropodium cirratum and Veronica speciosa were genetically more similar to more distant populations than the geographically-closest natural populations, supporting their origin through human-mediated dispersal.
Table S2
Download MS Word (79.4 KB)Figure S1
Download EPS Image (13.9 KB)Table S1
Download MS Word (112.3 KB)Acknowledgements
We would like to acknowledge all iwi and hapu who granted us permission to collect from within their rohe, in particular those who contacted and/or met with us in person: Ngāti Kuri, Te Aupouri, Tiakina te Taiao, Ngāi Tahu, Ngāti Wai, Patuharakeke Trust, Ngā Puhi, Te Rarawa and Ngā Rauru. Samples were collected under Department of Conservation permits WA-23814-FLO, BOP-23814-FLO, TT-23661-FLO, NO-233360-FLO and Otari Wilton’s Bush permit 145. We thank Kevin Matthews (Kaitaia), Barbara and Dan Ramsden (Moanaroa), Janeen Collings and Paul Cashmore (Department of Conservation), Trevor Thompson, Bill Wallace, Greg Blunden (QEII Trust), Tricia Aspin, Robin Atherton and Leon Perrie for assistance with sample collection. We also thank Leon Perrie and Andrew Veale for comments on the manuscript and Lydia Chin for preparing the herbarium specimens. Funding was provided through a Royal Society of New Zealand Rutherford Discovery Fellowship to LDS (contract number RDF-MNZ1201) and Marsden Fund (contract number MAU0709).
Disclosure statement
No potential conflict of interest was reported by the authors.
ORCID
Lara D. Shepherd http://orcid.org/0000-0002-7136-0017
Jonathan Frericks http://orcid.org/0000-0001-7340-248X
Patrick J. Biggs http://orcid.org/0000-0002-0285-4101
Peter J. de Lange http://orcid.org/0000-0001-6699-7083
Additional information
Funding
Related Research Data
References
- Allan HH. 1961. Flora of New Zealand. Vol. 1. Wellington: Government Printer.
- Andersen JC. 1923. An introduction to Māori music. Transactions of the Royal Society of New Zealand. 54:743–762.
- Armstrong TTJ, de Lange PJ. 2005. Conservation genetics of Hebe speciosa (Plantaginaceae) an endangered New Zealand shrub. Botanical Journal of the Linnean Society. 149:229–239. doi: 10.1111/j.1095-8339.2005.00437.x
- Atherton RA, Lockhart PJ, McLenachan PA, de Lange PJ, Wagstaff SJ, Shepherd LD. 2015. Molecular investigation into the origin and relationships of karaka/kopi (Corynocarpus laevigatus) in New Zealand. Journal of the Royal Society of New Zealand. 45:212–220. doi: 10.1080/03036758.2015.1093006
- Bandelt H-J, Forster P, Röhl A. 1999. Median-joining networks for inferring intraspecific phylogenies. Molecular Biology and Evolution. 16:37–48. doi: 10.1093/oxfordjournals.molbev.a026036
- Benor S. 2018. Molecular phylogeny of the genus Corchorus (Grewioideae, Malvaceae s.l.) based on nuclear rDNA ITS sequences. The Crop Journal. 6(5):552–563. doi: 10.1016/j.cj.2018.03.007
- Best E. 1925. The Maori Canoe. An account of various types of vessel used by the Maori of New Zealand in former times, with some description of these isles of the Pacific, and a brief account of the peopling of New Zealand. Wellington: AR Shearer.
- Bouckaert R, Heled J, Kühnert D, Vaughan T, Wu CH, Xie D, Suchard MA, Rambaut A, Drummond AJ, Prlic A. 2014. BEAST 2: a software platform for Bayesian evolutionary analysis. PLoS Computational Biology. 10(4):e1003537. doi: 10.1371/journal.pcbi.1003537
- Brunken U, Muellner AN. 2012. A new tribal classification of Grewioideae (Malvaceae) based on morphological and molecular phylogenetic evidence. Systematic Botany. 37:699–711. doi: 10.1600/036364412X648670
- Buckley TR, Leschen RAB. 2013. Comparative phylogenetic analysis reveals long-term isolation of lineages on the Three Kings Islands, New Zealand. Biological Journal of the Linnean Society. 108:361–377. doi: 10.1111/j.1095-8312.2012.02009.x
- Bulgarella M, Biggs PJ, de Lange PJ, Shepherd LD. 2017. Isolation and characterization of microsatellite loci from Arthropodium cirratum (Asparagaceae). Applications in Plant Sciences. 5(8):1700041. doi: 10.3732/apps.1700041
- Butterfield BG. 2003. Wood anatomy in relation to wood quality. In: Barnett JR, Jeronimidis G, editors. Wood quality and its biological basis. Carlton, Australia: Blackwell Publishing Ltd; p. 30–52.
- Carvalho MR, Herrera FA, Jaramillo CA, Wing SL, Callejas R. 2011. Paleocene Malvaceae from Northern South America and their biogeographical implications. American Journal of Botany. 98:1337–1355. doi: 10.3732/ajb.1000539
- Clarkson BD. 1991. Coastal plants inland. In: Clarkson BD, Smale MC, Ecroyd CE, editors. Botany of Rotorua. Rotorua: Forest Research Institute; p. 93–96.
- Colenso W. 1869. On the geographic and economic botany of the North Island of New Zealand. Transactions of the New Zealand Institute. 1:1–58.
- Dawson J, Lucas R. 2011. New Zealand’s native trees. Nelson: Craig Potton Publishing. p. 576.
- de Lange PJ. 2018. Entelea arborescens Fact Sheet (content continuously updated). New Zealand Plant Conservation Network; [accessed 2018 Oct 15]. http://www.nzpcn.org.nz/flora_details.aspx?ID=1377.
- de Lange WP, de Lange PJ. 1994. An appraisal of factors controlling the latitudinal distribution of mangrove (Avicennia marina var. resinifera) in New Zealand. Journal of Coastal Research. 10:539–548.
- Dellicour S, Mardulyn P. 2014. SPADS 1.0: a toolbox to perform spatial analyses on DNA sequence data sets. Molecular Ecology Resources. 14(3):647–651. doi: 10.1111/1755-0998.12200
- Drummond AJ, Ho SYW, Rawlence N, Rambaut A. 2007. A rough guide to BEAST 1.4; [accessed 2018 Oct 2]. http://www.molecularevolution.org/molevolfiles/beast/BEAST14_MANUAL-7-6-07.pdf.
- Dupanloup I, Schneider S, Excoffier L. 2002. A simulated annealing approach to define the genetic structure of populations. Molecular Ecology. 11:2571–2581. doi: 10.1046/j.1365-294X.2002.01650.x
- Earl DA, vonHoldt BM. 2012. Structure harvester: a website and program for visualizing structure output and implementing the Evanno method. Conservation Genetics Resources. 4(2):359–361. doi: 10.1007/s12686-011-9548-7
- Evanno G, Regnaut S, Goudet J. 2005. Detecting the number of clusters of individuals using the soft ware structure: a simulation study. Molecular Ecology. 14(8):2611–2620. doi: 10.1111/j.1365-294X.2005.02553.x
- Falush D, Stephens M, Pritchard JK. 2007. Inference of population structure using multilocus genotype data: dominant markers and null alleles. Molecular Ecology Notes. 7(4):574–578. doi: 10.1111/j.1471-8286.2007.01758.x
- Fleming CA. 1975. The geological history of New Zealand and its biota. In: Kuschel G, editor. Biogeography and ecology in New Zealand. The Hague: Dr W Junk b.v. Publishers; p. 1–86.
- Gardner RC, de Lange PJ, Keeling J, Bowala T, Brown HA, Wright SD. 2004. A late Quaternary phylogeography for Metrosideros (Myrtaceae) in New Zealand inferred from chloroplast DNA haplotypes. Biological Journal of the Linnean Society. 83:399–412. doi: 10.1111/j.1095-8312.2004.00398.x
- Hare KM, Daugherty CH, Chapple DG. 2008. Comparative phylogeography of three skink species (Oligosoma moco, O. smithi, O.suteri; Reptilia: Scincidae) in Northeastern New Zealand. Molecular Phylogenetics and Evolution. 46:303–315. doi: 10.1016/j.ympev.2007.08.012
- Heine EM. 1938. Observations on the pollination of New Zealand flowering plants. Transactions of the Royal Society of New Zealand. 67:134–148.
- Isaac M, Herzer R, Brook F, Hayward B. 1994. Cretaceous and Cenozoic sedimentary basins of Northland, New Zealand. Institute of Geological & Nuclear Sciences 8. Wellington, New Zealand: IGNS.
- Jakobsson M, Rosenberg NA. 2007. CLUMPP: a cluster matching and permutation program for dealing with label switching and multimodality in analysis of population structure. Bioinformatics. 23(14):1801–1806. doi: 10.1093/bioinformatics/btm233
- Kay K, Whittall J, Hodges S. 2006. A survey of nuclear ribosomal internal transcribed spacer substitution rates across angiosperms: an approximate molecular clock with life history effects. BMC Evolutionary Biology. 6:1471–2148. doi: 10.1186/1471-2148-6-36
- Leach H, Stowe C. 2005. Oceanic arboriculture at the margins – the case of the karaka (Corynocarpus laevigatus) in Aotearoa. Journal of Polynesian Society. 114(1):7–27.
- Leberg PL. 2002. Estimating allelic richness: effects of sample size and bottlenecks. Molecular Ecology. 11(11):2445–2449. doi: 10.1046/j.1365-294X.2002.01612.x
- Leigh JW, Bryant D. 2015. PopART: full-feature software for haplotype network construction. Methods in Ecology and Evolution. 6(9):1110–1116. doi: 10.1111/2041-210X.12410
- Li DC, Liu M, Luo R, Sadakane K, Lam TW. 2015. MEGAHIT: an ultra-fast single-node solution for large and complex metagenomics assembly via succinct de Bruijn graph. Bioinformatics. 31:1674–1676.
- Martins WS, Lucas DCS, Neves KFS, Bertioli DJ. 2009. WebSat - a web software for microsatellite marker development. Bioinformation. 3:282–283. doi: 10.6026/97320630003282
- McGlone MS. 1985. Plant biogeography and the late Cenozoic history of New Zealand. New Zealand Journal of Botany. 23:723–749. doi: 10.1080/0028825X.1985.10434240
- McGlone MS, Duncan RP, Heenan PB. 2001. Endemism, species selection and the origin and distribution of the vascular plant flora of New Zealand. Journal of Biogeography. 28:199–216. doi: 10.1046/j.1365-2699.2001.00525.x
- Millener LH. 1946. A study of Entelea arborescens. Part 1. Ecology. Transactions of the Royal Society of New Zealand. 76(3):267–288.
- Miller MP, Knaus BJ, Mullins TD, Haig SM. 2013. SSR_pipeline - Computer software for the identification of microsatellite sequences from paired-end Illumina High-Throughput DNA sequence data (ver. 1.1, 2014 Feb). USGS Data Series 778.
- Morgan-Richards M, Trewick SA, Wallis GP. 2001. Chromosome races with Pliocene origins: evidence from mtDNA. Heredity. 86:303–312. doi: 10.1046/j.1365-2540.2001.00828.x
- Myers SS, Holwell GI, Buckley TR. 2017. Genetic and morphometric data demonstrate alternative consequences of secondary contact in Clitarchus stick insects. Journal of Biogeography. 44:2069–2081. doi: 10.1111/jbi.13004
- Neall VE, Trewick SA. 2008. The age and origin of the Pacific islands: a geological overview. Philosophical Transactions of the Royal Society B: Biological Sciences. 363:3293–3308. doi: 10.1098/rstb.2008.0119
- Newnham R, McGlone M, Moar N, Wilmshurst J, Vandergoes M. 2013. The vegetation cover of New Zealand at the last glacial maximum. Quaternary Science Reviews. 74:202–214. doi: 10.1016/j.quascirev.2012.08.022
- Peakall R, Smouse PE. 2012. Genalex 6.5: genetic analysis in excel. Population genetic software for teaching and research—An update. Bioinformatics. 28(19):2537–2539. doi: 10.1093/bioinformatics/bts460
- Pons O, Petit RJ. 1996. Measuring and testing genetic differentiation with ordered versus unordered alleles. Genetics. 144(3):1237–1245.
- Posada D. 2008. Jmodeltest: phylogenetic model averaging. Molecular Biology and Evolution. 25:1253–1256. doi: 10.1093/molbev/msn083
- Pritchard JC, Stephens M, Donnelly P. 2000. Inference of population structure using multilocus genotype data. Genetics. 155(2):945–959.
- Pruett CL, Winker K. 2008. The effects of sample size on population genetic diversity estimates in Song Sparrows Melospiza melodia. Journal of Avian Biology. 39(2):252–256. doi: 10.1111/j.0908-8857.2008.04094.x
- Ramasamy RK, Ramasamy S, Bindroo BB, Naik VG. 2014. Structure plot: a program for drawing elegant structure bar plots in user friendly interface. SpringerPlus. 3(431).
- Rambaut A, Suchard MA, Xie W, Drummond AJ. 2013. Tracer v1.6. http://tree.bio.ed.ac.uk/software/tracer.
- Reid I, Sawyer J, Rolfe J. 2009. Introduction to the plant life in New Zealand: plant conservation training module 1. The New Zealand Plant Conservation Network; [accessed 2018 Oct 1]. http://nzpcn.org.nz/publications/Module_1_full_document.pdf.
- Richardson JE, Whitlock BA, Meerow AW, Madriñán S. 2015. The age of chocolate: a diversification history of Theobroma and Malvaceae. Frontiers in Ecology and Evolution. 3(120).
- Riley M. 1994. Māori healing and Herbal. Paraparaumu: Viking Sevenseas N.Z. Ltd. p. 528.
- Ross PM, Hogg ID, Pilditch CA, Lundquist CJ. 2009. Phylogeography of New Zealand’s coastal benthos. New Zealand Journal of Marine and Freshwater Research. 43(5):1009–1027. doi: 10.1080/00288330.2009.9626525
- Shaw J, Lickey EB, Schilling EE, Small RL. 2007. Comparison of whole chloroplast genome sequences to choose noncoding regions for phylogenetic studies in angiosperms: the tortoise and the hare III. American Journal of Botany. 94(3):275–288. doi: 10.3732/ajb.94.3.275
- Shepherd LD, Bulgarella M, de Lange PJ, Chiang T-Y. 2018. Genetic structuring of the coastal herb Arthropodium cirratum (Asparagaceae) is shaped by low gene flow, hybridization and prehistoric translocation. PLOS ONE. 13(10):e0204943. doi: 10.1371/journal.pone.0204943
- Shepherd LD, de Lange PJ, Cox S, McLenachan PA, Roskruge NR, Lockhart PJ, Kolokotronis S-O. 2016. Evidence of a string domestication bottleneck in the recent cultivated New Zealand endemic root crop, Arthropodium cirratum (Asparagaceae). PLOS ONE. 11(3):e0152455. doi: 10.1371/journal.pone.0152455
- Shepherd LD, de Lange PJ, Perrie LR, Heenan PB. 2017. Chloroplast phylogeography of New Zealand Sophora trees (Fabaceae): extensive hybridization and widespread last glacial maximum survival. Journal of Biogeography. 44:1640–1651. doi: 10.1111/jbi.12963
- Shepherd LD, McLay TGB. 2011. Two micro-scale protocols for the isolation of DNA from polysaccharide-rich plant tissue. Journal of Plant Research. 124(2):311–314. doi: 10.1007/s10265-010-0379-5
- Soltis DE, Morris AB, McLachlan JS, Manos PS, Soltis PS. 2006. Comparative phylogeography of unglaciated eastern North America. Molecular Ecology. 15:4261–4293. doi: 10.1111/j.1365-294X.2006.03061.x
- Spencer HG, Brook FJ, Kennedy M. 2006. Phylogeography of Kauri Snails and their allies from Northland, New Zealand (Mollusca: Gastropoda: Rhytididae: Paraphantinae). Molecular Phylogenetics and Evolution. 38:835–842. doi: 10.1016/j.ympev.2005.10.015
- Taylor R. 1855. Te Ika a Maui: New Zealand and its inhabitants. London: Wertheim and MacIntosh.
- Tennyson A, Martinson P. 2006. Extinct brids of New Zealand. Wellington: Te Papa Press. p. 180.
- Thorsen MJ, Dickinson KJM, Seddon PJ. 2009. Seed dispersal systems in the New Zealand flora. Perspectives in Plant Ecology, Evolution and Systematics. 11:285–309. doi: 10.1016/j.ppees.2009.06.001
- Walsh RS. 1967. Nectar and pollen sources of New Zealand. Wellington: National Beekeepers Association of New Zealand (Inc).
- Wardle P. 1963. Evolution and distribution of the New Zealand flora, as affected by Quaternary climates. New Zealand Journal of Botany. 1:3–17. doi: 10.1080/0028825X.1963.10429318
- White T, Bruns T, Lee S, Taylor J. 1990. Amplification and direct sequencing of fungal ribosomal RNA genes for phylogenetics. In: Innis M, Gelfand D, Shinsky J, White T, editors. PCR protocols: a guide to methods and applications. San Diego: Academic Press; p. 315–322.
- Worthy TH, Holdaway RN 2002. Prehistoric life of New Zealand – the lost world of the moa. Indiana: Indiana University Press. p. 718.
- Zhou W, Li D-Z, Wang H. 2012. Coexistence of delayed autonomous self-pollination and deceptive pollination in Arthropodium cirratum (Asparagaceae). Plant Diversity and Resources. 34:187–191. doi: 10.3724/SP.J.1143.2012.11169