Abstract
The potential threat of plastic pollution to seabirds within the Hauraki Gulf was assessed by determining its abundance and distribution at two different spatial scales and assessing the community of resident seabirds during July to September 2008. Samples of floating plastics within the gulf were taken during 66 trawls from the surface of the water in three regions within the inner gulf and Waitamata harbour. Within each of these regions, samples were taken in and outside of visually identified natural slick lines that are surface manifestations of small-scale convergence zones. During each trawl, the identity and abundance of seabirds were assessed. Plastic debris was recorded in all three regions sampled with the greatest abundance being recorded in the harbour. Plastics and debris were also significantly more concentrated within natural slick lines. Both user and industrial plastics were identified and consisted of colours and lengths likely to be mistaken as food items for small to medium seabirds. Surface or near-surface feeding seabirds in the gulf most likely mistakenly to consume plastics were fluttering shearwaters, Cape pigeons and Buller's shearwaters. However, these birds were most abundant in the area of the gulf where abundance of plastic pollution was lowest. The Hauraki Gulf is considered significantly less polluted by plastic debris than other severely polluted areas cited in literature.
Introduction
The ubiquitous use of plastic items is associated with the generation of pollution, substantial amounts of which find their way into the marine environment (Pruter Citation1987). Such pollution consists of manufactured items that commonly break down in smaller fragments (user plastics) and small, industrial plastic particles from which user plastics are manufactured (Azzarello & Van Vleet Citation1987). New Zealand is not exempt from such pollution and substantial quantities of stranded plastic pellets have been detected on New Zealand beaches (Gregory Citation1978), particularly around Auckland.
The distribution of such contamination is affected by surface currents, wind patterns as well as the location of geographic inputs (Azzarello & Van Vleet Citation1987; Pruter Citation1987; Ryan Citation1988). Debris is most likely to accumulate in oceanographic eddies and convergences (Moore et al. Citation2001). Such oceanographic features occur at different spatial scales. Very large accumulations of plastic pollution may occur associated with particular oceanographic features, for example the North (Day et al. Citation1989) and South Pacific subtropical gyres (Martinez et al. Citation2009). At much smaller scales, localised convergence zones visually manifested on the surface as areas of smooth water may accumulate marine organisms and debris and are known as slicks (Kingsford & Choat Citation1986). These features are confined largely to near-shore areas where biological production is high. They are associated with surface accumulations of naturally derived lipids or phenolic materials (Ewing Citation1950; Carlson Citation1982) and are discernible because of their damping effect on small wavelets. We suggest that these small-scale convergences may also accumulate plastic pollution.
Plastic pollution poses a threat to marine biota (Derraik Citation2002), particularly seabirds, as they are thought to ingest plastic mistakenly as food (Azzarello & Van Vleet Citation1987; Harper & Fowler Citation1987; Ryan Citation1987a; Copello & Quintana Citation2003). Although a range of field studies on Procellariiformes (albatrosses and petrels) are equivocal as to whether ingestion of small plastic items substantially compromise seabird health (Ryan Citation1987b; Vlietstra et al. Citation2002; Colabuono et al. Citation2009), ingested plastics provide a route by which toxic polychlorinated biphenyls are ingested (Ryan et al. Citation1988; Derraik Citation2002). Additional detrimental effects of plastic ingestion on seabirds potentially include blockages of enzyme secretion, lowered feeding stimulus, reduced hormone levels of steroids as well as delayed ovulation and reproductive failure (Azzarello & Van Vleet Citation1987). Mechanical threats include entanglement (Derraik Citation2002), punctures, ulcerations and physical blockages (Auman et al. Citation1997).
Plastic debris concentrates in surface waters and the likelihood of ingestion is correlated with the feeding methods of seabirds (Azzarello & Van Vleet Citation1987; Ryan Citation1987a; Auman et al. Citation1997; Blight & Burger Citation1997). Surface and shallow-diving seabirds appear particularly prone to ingesting plastic debris with petrels (Procellariiidae) and storm petrels (Oceanitidae) showing a tendency to accumulate larger loads because of the inability of the birds to pass them down the intestine through the pyloric sphincter (Furness Citation1985). Plastic debris does not appear to occur in plunging or kleptoparasitic feeding seabirds (Azzarello & Van Vleet Citation1987).
The Hauraki Gulf is a semi-enclosed coastal sea with the inner gulf exchanging water with the more open shelf regions with an approximate 60–80-day turnover period (Hauraki Gulf Forum Citation2004) and adjacent to some of New Zealand's most intensively developed areas. The Gulf also supports substantial populations of seabirds, including breeding colonies (Arnold Citation2003) and consequently the likelihood of resident and migratory seabirds encountering plastic pollution maybe high, particularly if seabirds associate with these small-scale convergence zones.
We describe here the nature and relative abundance of surface plastic debris across the inner Hauraki Gulf comparing particularly the characteristics and relative abundance of plastic debris collected from within and outside visually identified natural slicks. The abundance of plastic debris is examined in relation to the distribution and structure of the seabird community across this inner Gulf area.
Materials and methods
Data was collected during the austral winter and early spring, from 1 July to 19 September 2008. Sampling was restricted to days with wind speeds less than 25 knots and directed towards three areas of the inner Gulf. These were the Waitemata Harbour (Region 1), the area between the outer limit Waitemata Harbour and the 30-m depth contour (Region 2) and the area between the 30-m depth contour extending just northeast of a line from Tiritiri Matangi Island to the north tip of Waiheke Island (Region 3) (). At smaller spatial scales within these regions, we focused sampling in and outside natural slick lines visually identified from the research vessel.
Fig. 1 Map showing the location of trawls conducted within the inner Hauraki Gulf.
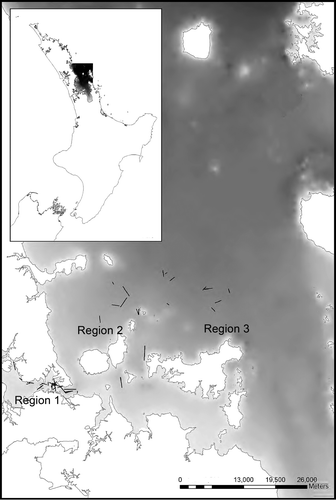
A total of 66 trawls was conducted (). All transects lasted for 8 min; however, the absolute length varied depending on tidal flow rate and direction. We assumed that the volume of water sampled during each trawl was approximately equal. A total of 32 trawls were collected from within the harbour (Region 1), of which 15 were conducted within and 17 outside of these natural slick lines. A total of 17 trawls each were conducted in both Regions 2 and 3 (eight within and nine outside natural slicks).
We sampled for plastic debris by deploying a plankton net (400-mm diameter, 250 µm) in the surface waters along the track of a visually identified natural slick for 8 min at a speed of 5 knots. Samples were also taken from transects at least 25 m outside of convergence zones. This second sample was similarly collected by trawling for 8 min at 5 knots. Plastic debris was extracted from the net contents by discarding large organic materials (seaweeds), collecting large plastic fragments and submerging the rest of the net contents into a water bath. Smaller plastic particles were removed from the surface of the water using tweezers. Collected plastic debris was classified as user, industrial pellets or fragments. The colour and the maximum length were also recorded. User plastics were items recognisable as products or remains of products directly used by humans, such as plastic bags, cups, packaging, rope or nets. Industrial pellets were generally in the form of cylindrical discs, spheres or rectangles with a diameter of less than 4 mm (Azzarello & Van Vleet Citation1987). Plastic debris classified as fragments were small items undistinguishable as particular user items. The classification of plastic debris into industrial or virgin pellets and user items or fragments is used widely in the literature (Ryan Citation1988; Vlietstra & Parga Citation2002; Mallory Citation2008).
Whilst conducting standardised trawls of 8 min, the number and identity of seabirds were recorded by a single observer situated at the bow of the boat. Partly consistent with standard ship-based survey techniques used in a range of studies in the north-eastern Atlantic (e.g. Garthe et al. Citation2007, Citation2009), observations were made by making continuous 180° forward scans. However, in contrast to the 300-m transect width used in such studies, we restricted observations to a narrow 20-m band on either side of the boat consistent with the width of many natural slicks. Although we did not incorporate techniques to avoid overestimation of the abundance of flying birds, the narrow transect width reduced biases associated with limited detectability of swimming or resting seabirds at increasing distances from the observer platform (Garthe et al. Citation2007, Citation2009). In addition to these observations, species attending feeding aggregations were recorded in Regions 2 and 3.
Trawling within the harbour was conducted from a 6-m, single hulled boat. Other samples were collected from a 20-m catamaran. Additional data collected included time of sampling, GPS location at the start and end of the trawl, Beaufort scale of water conditions and tidal status.
We tested for differences in the relative abundance of all types of plastic debris across the study area, and for differences in the relative of abundance of different types of plastic debris within the three sampling areas, and within and outside of natural slicks lines using the non-parametric Kruskal–Wallis procedure available in SPSS®. Similarly, we tested for differences in the number of birds per trawl among the three sampling areas using the Kruskal–Wallis procedure. Differences in the abundance of plastic debris inside and outside of natural slick lines were tested for significance using a Mann–Whitney procedure. We tested for the association between seabirds categorised by feeding method () and sampling region, and between feeding method and utilisation of areas inside and outside of natural slick lines using contingency tables. There was only one trawl in which we recorded a species that feed by dipping and this category was removed from the analysis to avoid bias in the chi-squared value because of low expected frequencies (Zar Citation1984).
Table 1 Mean (±SE) number of seabirds recorded per trawl in three regions of the inner Hauraki Gulf.
Results
Distribution and description of plastic debris
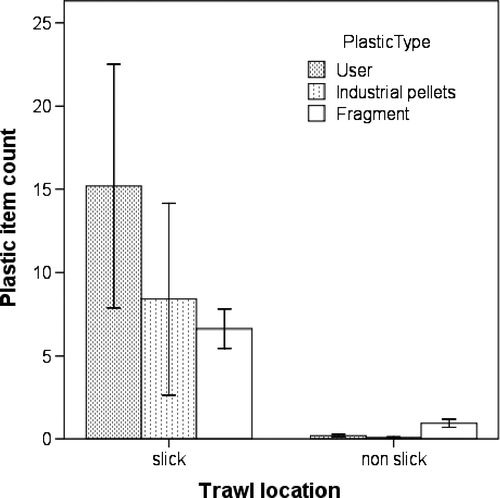
The mean number of plastic items collected per trawl varied significantly across the sampling area (Kruskal–Wallis Test, χ2=7.851, P=0.02) () with numbers declining from Region 1 through Region 3 (Region 1 mean: 8.18±2.96, Region 2: 2.33±0.61, Region 3: 1.14±0.31). The mean number of plastic objects collected per trawl within natural slicks was significantly different from those in non-slick areas across all three regions (, Region 1: U=388, P= < 0.01, Region 2: U=103, P<0.01, Region 3: U=206, P<0.01). The abundance of the three different plastic types was different both within (Kruskal–Wallis Test, χ2=9.785, P=0.008) and outside (Kruskal–Wallis Test, χ2=15.213, P<0.001) of natural slicks lines. In natural slicks lines, user plastics were the most prevalent plastic type followed by industrial pellets and then plastic fragments (). Outside of natural slick lines, fragments dominated with user and industrial items being much less common.
Fig. 2 Count of number of plastic items recovered during 8-min trawls conduct in and outside natural slicks within three regions of the inner Hauraki Gulf (mean±SE).
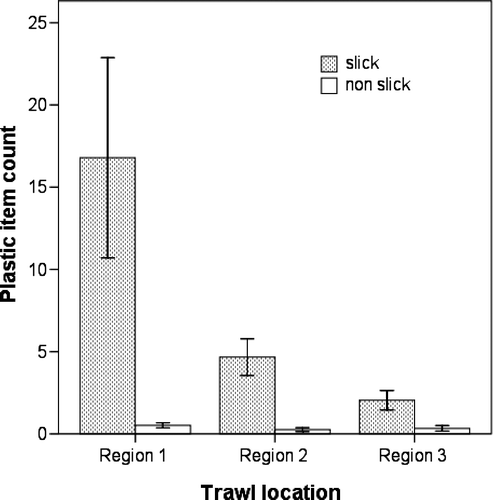
Fig. 3 Count of number of plastic items in and outside natural slicks separated by type of plastic (mean±SE).
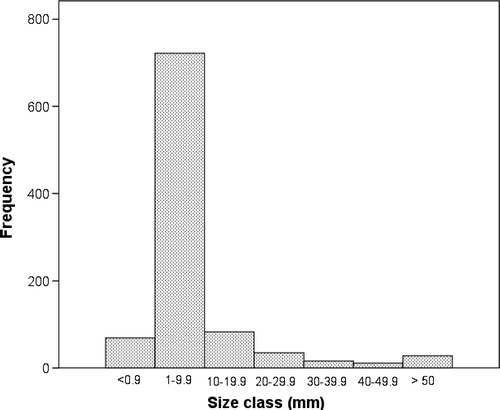
The commonest colours of recovered plastic debris from the Hauraki Gulf were white opaque, white translucent, blue, green and red items (). Most plastic items recovered from trawls measured between 1 and 9.9 mm (mean 2.33±1.2 mm, n=963) and represented mainly industrial pellets and fragments ().
Fig. 4 Proportion (%) of differently coloured plastic items recovered from the inner Hauraki Gulf.
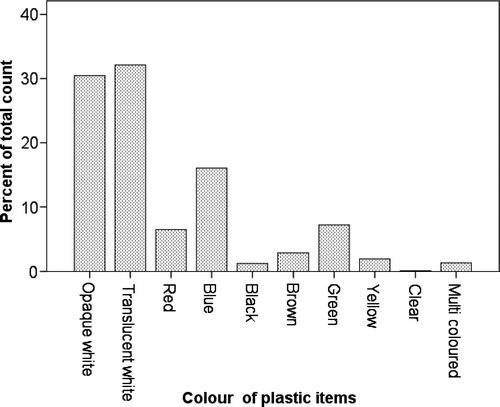
Fig. 5 Size frequency distribution of plastic items recovered from trawls.
Seabird observations
There were significant differences in the abundance of seabirds among the three regions of the gulf (Kruskal–Wallis Test, χ2=34.5, P <0.001) with high numbers of particularly Australian gannets (Morus serrator) and fluttering shearwaters (Puffinus gavia) in Region 3 (). When classified by feeding method, the community was dominated by pursuit diving and plunge diving seabirds. There were no significant differences in the frequency of occurrence of birds of different feeding methods within and outside of natural slick lines (χ2=3.075, P=0.545). αThere was a significant association between the frequency of birds of a particular feeding method and the sampling region (χ2=192.7, df = 4, P<0.001). Region 1 was dominated by surface feeding species namely gulls (Larus spp.). Regions 2 and 3 were characterised by the relatively higher encounter rates of plunge diving seabirds, particularly Australian gannets (Morus serrator). Outside of observations conducted during trawls, white faced storm petrels (Pelagodroma marina), and flesh footed shearwaters (Puffinus carneipes) were also observed. Our study was conducted before many of the summer breeding migratory seabirds had returned. Buller's shearwaters (Puffinus bulleri), white faced storm petrels, flesh footed shearwaters were only recorded during early September at the end of our study period.
Discussion
Plastic items were recovered in all three surveyed regions within the Hauraki Gulf. The higher incidence of plastic debris found within Region 1 probably reflects the close proximity to the terrestrial sources, and nature of the tidal movement of water through relatively narrow entrance, which may reduce water turn over time within the region allowing debris to accumulate. The greater number of plastic items collected within, compared to outside natural slicks lines, is consistent with the view that these represent localised areas of convergence and observations which indicate natural slick lines are also associated with higher densities of drift algae, larval fish and other zooplankton (Kingsford & Choat Citation1986). Ryan (Citation1988) has similarly noted the distribution of plastic debris at sea is clustered at small scales and presumed this concentration was occurring at convergence zones.
It is difficult to evaluate the severity of pollution by plastic particles in the Hauraki Gulf compared with other known polluted marine systems because methodologies used to measure the abundance of plastic debris at sea vary. Gregory et al. (Citation1984) indicated a density of 18 pellets per km2 in waters of the Southern Ocean to the south of New Zealand. Historical measurements in the North Atlantic indicate a density of over 8000 items/km2 (Colton et al. Citation1974), 3640 items/km2 in the South Atlantic off the Western Cape Province, South Africa (Ryan Citation1988) and within the North Pacific Gyre the density of plastic items was 334,271 items/km2 (Moore et al. Citation2001). There is some evidence that the abundance of particularly plastic pellets at sea has decreased over the last two decades (Ryan Citation2008). Our data suggests an estimated density in the Hauraki Gulf towards the lower limits of the range identified here ranging from 16626 items/km2 in Region 1 to 4735 items/km2 in Region 2 and 2317 items/km2 in Region 3.
The plastic items collected in the Hauraki Gulf were dominated by white or opaque items of less than 10 mm in length. Day (Citation1980), Cooper et al. (Citation2004) and Ryan (Citation2008) have suggested many seabirds show a preference for ingestion of plastic debris of a particular colour presumably related to how closely it resembles their characteristic prey. For example, samples recovered from short tailed shearwaters (Puffinus tenuirostris) in the Bering Sea contained mainly white or light-coloured plastic particles (Vlietstra & Parga Citation2002) consistent with the light colour of their euphausiid prey. Our data indicate not surprisingly the availability of plastic debris of different colours at sea varies considerably and assessment of any particular colour preference by seabirds needs to consider this (Vlietstra & Parga Citation2002).
Many seabirds are opportunistic foragers and will eat a wide range of marine prey of suitable size. The maximum size of prey taken by seabirds is likely to be dictated by the size of the birds. A substantial proportion of plastic debris collected in the Gulf fell into the size range 1.9–9 mm. This is a size of prey likely to be taken by smaller seabirds (Marchant & Higgins Citation1990; Colaguono et al. 2009) or potential prey species of fish that may ingest plastic debris which is then secondarily ingested by small or medium size seabirds (Colaguono et al. 2009).
Surface or shallow diving seabirds are at greatest risk of direct ingestion of plastic debris and in the Hauraki Gulf would include Cape pigeons (Daption capense), fluttering shearwaters, Buller's shearwaters, and white faced storm petrels (Pelagodroma marina). While numbers of birds of these species were low during the winter study period, abundances would rise markedly for the latter three species during their summer breeding period. The risk of ingestion of plastic debris for these birds would be further increased if feeding were targeted towards natural slicks where potential prey may accumulate (Kingsford & Choat Citation1986). However, these birds were only observed in Region 3 where the risk of encountering plastic debris was lowest and we found no evidence that surface feeding or shallow diving seabirds concentrated on natural slicks.
A number of studies have shown changes in the abundance of plastic debris ingested by seabirds over time (Harper & Fowler Citation1987; Moser & Lee Citation1992; Vlietstra & Parga Citation2002; Ryan Citation2008) that are thought to reflect changes in the composition of small plastic items over their oceanic range. These studies suggest that seabirds maybe used as monitors of broad scale patterns of plastic distribution and abundance (Ryan Citation2008; Ryan et al. Citation2009). Given these suggestions and the potential impacts of plastics on seabirds, the combination of the presence of plastic debris and high densities of seabirds in the Hauraki Gulf, particularly during summer, may provide particularly favourable circumstances for more detailed investigation into the relationship between plastic abundance at sea and plastic loads in seabirds.
Acknowledgements
Financial assistance for this study was provided by the Universities Federation of Animal Welfare (UFAW). Logistical support was provided by Hayden's Harbour Clean (Hayden Smith), the Waitemata Harbour Cleanup Trust (Ben Harris) and Explore NZ (Keith Algie, Joanna Logan, Andy Light and Cathy Goeldner) through providing access to their boats. Andy Farrant, Carol Lockett and Tom Young assisted with sampling and other aspects of the study.
References
- Arnold A 2003 Shining a spotlight of the biodiversity of New Zealand's marine ecoregion: experts workshop on marine biodiversity Wellington WWF
- Auman HJ Ludwig JP Giesy JP Colborn T 1997 Plastic ingestion by Laysan albatross chicks on Sand Island, Midway Atoll, in 1994 and 1995 Robinson G Gales R Albatross and Conservation Chipping Norton SurreyBeatty & Sons 239 244
- Azzarello , MY and Van Vleet , ES . 1987 . Marine birds and plastic pollution . Marine Ecology , 37 : 295 – 303 .
- Blight , LK and Burger , AE . 1997 . Occurrence of plastic particles in seabirds from the eastern north Pacific . Marine Pollution Bulletin , 34 : 323 – 325 .
- Carlson , DJ . 1982 . Surface microlayer phenolic enrichments indicate sea surface slicks . Nature , 296 : 426 – 429 .
- Colabuono , FI , Barquete , V , Domingues , BS and Montone , RC . 2009 . Plastic ingestion by Procellariformes in southern Brazil . Marine Pollution Bulletin , 58 : 93 – 96 .
- Colton , JB , Knapp , FD and Burns , BR . 1974 . Plastic particles in surface waters of the northwestern Atlantic . Science , 185 : 491 – 497 .
- Cooper , J , Auman , HJ and Klavitter , J . 2004 . Do the albatrosses of Midway Atoll select cigarette lighters by color? . Pacific Seabirds , 31 : 2 – 4 .
- Copello , S and Quintana , F . 2003 . Marine debris ingested by southern giant petrels and its potential relationships with fisheries in the southern Atlantic Ocean . Marine Pollution Bulletin , 46 : 1513 – 1515 .
- Day RH 1980 The occurence and characteristics of plastic pollution in Alaska's marine birds M.S. thesis, Universityof Alaska, Fairbanks, Alaska 111
- Day RH Shaw DG Ignell SE 1989 The quantitative distribution and characteristics of neuston plastic in the north Pacific Ocean 1985–1988 Proceedings of the Second International Conference on Maritime Debris, Honolulu, Hawaii Shomura RS Godfrey ML
- Derraik , JGB . 2002 . The pollution of the marine environment by plastic debris: a review . Marine Pollution Bulletin , 42 : 842 – 852 .
- Ewing , G . 1950 . Slicks, surface films and internal waves . Journal of Marine Research , 9 : 161 – 187 .
- Furness , RW . 1985 . Ingestion of plastic particles by seabirds at Gough Island, South Atlantic Ocean . Environmental Pollution , A38 : 261 – 272 .
- Gregory , MR . 1978 . Accumulation and distribution of virgin plastic granules on New Zealand beaches . New Zealand Journal of Marine and Freshwater Research , 12 : 399 – 414 .
- Garthe , S , Sonntag , N , Schwemmer , P and Dierschke , V . 2007 . Estimation of seabird numbers in the German North Sea throughout the annual cycle and their biogeographic importance . Vogelwelt , 128 : 163 – 178 .
- Garthe , S , Markones , N , Hüppop , O and Adler , S . 2009 . Effects of hydrographic and meteorological factors on seasonal seabird abundance in the southern North Sea, Marine Ecology Progress Series , 391 : 243 – 255 .
- Gregory , MR , Kirk , RM and Mabin , MCG . 1984 . Pelagic tar, oil, plastics and other litter in surface waters of the New Zealand sector of the Southern Ocean, and on Ross Dependency shores . New Zealand Antarctic Record , 6 : 12 – 26 .
- Harper , PC and Fowler , JA . 1987 . Plastic Pellets in New Zealand storm-killed prions (Pachyptila spp.) 1958–1977 . Notornis , 34 : 65 – 70 .
- Hauraki Gulf Forum 2004 The Hauraki Gulf State of the Environment Report http://www.arc.govt.nz/albany/fms/main/Documents/Environment/Coastal%20and%20marine/Hauraki%20Gulf%20State%20of%20the%20Environment%20Report%20-%20Preface.pdf (accessed 20 July 2008)
- Kingsford , MJ and Choat , JH . 1986 . Influence of surface slicks on the distribution and onshore movements of small fish . Marine Biology , 91 : 161 – 171 .
- Mallory , ML . 2008 . Marine plastic debris in northern fulmars from the Canadian high Arctic . Marine Pollution Bulletin , 56 : 1501 – 1504 .
- Marchant S Higgins PJ 1990 Handbook of Australian, New Zealand and Antarctic birds, Volume 1 Oxford University Press Melbourne
- Martinez , E , Maamaatuaiahutapu , K and Taillandiet , V . 2009 . Floating marine debris surface drift: convergence and accumulation toward the South Pacific subtropical gyre . Marine Pollution Bulletin , 58 : 1347 – 1355 .
- Moore , CJ , Moore , SL , Leecaster , M K and Weisberg , SB . 2001 . A comparison of plastic and plankton in the North Pacific Central Gyre . Marine Pollution Bulletin , 42 : 1279 – 1300 .
- Moser , ML and Lee , DS . 1992 . A fourteen-year survey of plastic ingestion by western North Atlantic seabirds . Colonial Waterbirds , 15 : 83 – 94 .
- Pruter , AT . 1987 . Sources, quantities and distribution of persistent plastics in the marine environment . Marine Pollution Bulletin , 18 : 305 – 310 .
- Ryan , PG . 1987a . The incidence and characteristics of plastic particles ingested by seabirds . Marine Environmental Research , 23 : 175 – 206 .
- Ryan , PG. 1987b . The effects of ingested plastic on seabirds: correlations between plastic load and body condition . Environmental Pollution , 46 : 119 – 125 .
- Ryan , PG . 1988 . The characteristics and distribution of plastic particles at the sea surface off the southwestern Cape Province, South Africa . Marine Environmental Research , 25 : 249 – 273 .
- Ryan , PG . 2008 . Seabirds indicate changes in the composition of plastic litter in the Atlantic and south-western Indian Oceans . Marine Pollution Bulletin , 56 : 1406 – 1409 .
- Ryan , PG , Connell , AD and Gardner , BD . 1988 . Plastic ingestion and PCBs in seabirds: is there a relationship? . Marine Pollution Bulletin , 19 : 174 – 176 .
- Ryan , PG , Moore , CJ , van Franeker , JA and Moloney , CL . 2009 . Monitoring the abundance of plastic debris in the marine environment . Philosophical Transactions of the Royal Society B , 364 : 1999 – 2012 .
- Vlietstra , LS and Parga , JA . 2002 . Long-term changes in the type, but not amount, of ingested plastic particles in short-tailed shearwaters in the southeastern Bering Sea . Marine Pollution Bulletin , 22 : 945 – 955 .
- Zar , JH . 1984 . Biostatistical analysis , 2nd edition , London : Prentice-Hall International .