Abstract
Economics provides an important driver of land use change between the four main economic activities of groundwater irrigators (dairy, apples, horticulture-other and market gardening) using the Lower Confined Aquifer, Waimea Plains, Nelson. Over the period between 2003–4 and 2007–8, most irrigated land moved to higher value uses. In particular, dairy land use, with the lowest average revenue per hectare, was largely replaced by horticulture-other and market gardening with average revenues per hectare three to seven times greater than dairy. A causal link between economics and groundwater use is established as dairy generally uses more water per hectare than horticulture-other and market gardening, and as apple orchards responded to low apple prices in 2004–5 by either closing or removing blocks of low-producing trees. Average groundwater use efficiency increased over time from $4.9/m3 to $16.7/m3 because of changes in land use, land use practices and product price.
Introduction
Economics drives land use and therefore determines water use. These drivers are manifested in the type and distribution of land use. Types of land use in modern societies demonstrate an ordering, by financial return, from high to low: ‘residential, cropland, grazing or forestry’ (Hubacek & Vazquez Citation2002). For example production value from irrigated land (e.g. up to $52k/ha for horticulture, Northington Partners Citation2010) is much greater than non-irrigated agricultural land ($1k/ha, A. Fenemor, Landcare Research, pers. comm. 2010) and irrigated land is worth more than non-irrigated agricultural land (e.g. approximately $8k/ha more in 1999; White et al. Citation2001). The distribution of land use is also influenced by economics with better lands being taken by higher-valued and more productive land uses (Hubacek & Vazquez Citation2002). Clearly, land use and crop type determine water use. For example, seasonal irrigation requirements are 100–500 mm for apples and 250–700 mm for pasture for a 1-in-10-year drought on Waimea Plains soils (Lincoln Environmental and Agfirst Consultants Citation2003).
Economic analysis of land use change incorporates a number of basic assumptions. Most importantly, it assumes that ‘economic agents, consumers and operators, are rational entities that try to maximise their income (profit) or welfare (utility)’ (Hubacek & Vazquez Citation2002) in response to prices. Hence, price allocates land and producers supply land through market signals, so ‘land resources tend to gravitate to those uses that command the highest market prices and offer the highest net returns to investment’ (Hubacek & Vazquez Citation2002). However, ‘land has often been owned for other purposes in life than maximisation of income’ (Hubacek & Vazquez Citation2002). Market signals may be implicit, such as land price, or explicit, such as production revenue and product price.
This paper used a longitudinal survey over the period from 2003–4 to 2007–8 to assess explicit market signals (production value and product price) as economic drivers of land use change by irrigators that take groundwater from the Lower Confined Aquifer (LCA), Waimea Plains, Nelson (). Survey participants represent most of the property owners, land area and groundwater allocation holders in the LCA (). Production values, as revenue per hectare, prices and profits are compared with land use to identify how these influence land use.
Figure 1 The Waimea Plains, Nelson, with location of three aquifers including the Lower Confined Aquifer (after Thomas Citation2001) and location of properties taking groundwater from the Lower Confined Aquifer for agricultural irrigation that contributed to the survey.
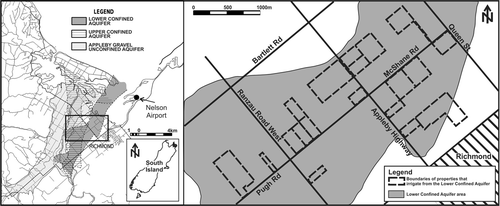
Table 1 Summary of groundwater allocation for irrigation, property numbers and land area (to the nearest hectare), Lower Confined Aquifer (LCA), 2003–4 to 2007–8 irrigation seasons.
The study examined how land use change impacts LCA groundwater use. These impacts include systematic changes in LCA groundwater use, in response to economic drivers, because of land use change between the main economic activities and changes in water use efficiency. This paper also includes a discussion on water use efficiency (e.g. groundwater use per hectare and revenue per cubic metre of groundwater applied), water use data and future water demand with comment on the relevance of results from the LCA survey to water management.
Methods
Study site
The LCA is a gravel aquifer (Dicker et al. Citation1992; White & Reeves Citation1999) managed by Tasman District Council (Tasman District Council Citation1991) with allocation for agricultural irrigation of 70,725 m3/week () and for municipal use of 50,900 m3/week (D. Page, Tasman District Council, pers. comm. 2009). Two types of soil occur in the LCA area. Light soils cover most of the area; profile available water (total water available for plant growth within the top 0.9 m of soil; McQueen Citation1993) is 100 mm (Landcare Research Citation2011). Average rainfall is in the range 1000–1100 mm/year (Wratt et al. Citation2008).
Irrigated land use, soils and climate in the LCA area are similar to those found in the Motueka catchment (Basher Citation2003, Landcare Research Citation2011). Therefore, the findings from this study are likely to be applicable to land use change and water use in the neighbouring Motueka Catchment.
Lower Confined Aquifer survey, groundwater use and rainfall data
Waimea Plains LCA groundwater users were chosen for this survey because a range of irrigated land uses are present in the zone (White et al. Citation2001) and good-quality weekly groundwater use data records were available from Tasman District Council for November–April irrigation seasons. A groundwater users group has been established in the LCA groundwater zone for many years (Tasman District Council Citation1991) and leadership of the LCA groundwater users’ group supported the survey.
The survey included the majority of properties, irrigated land area and irrigation allocation () over approximately 235 ha of the LCA (). All 21 LCA groundwater consent holders that use groundwater for agriculture were approached, through meetings of the groundwater users’ group and individual contact, with requests to contribute to the survey. Seventeen groundwater consent holders () agreed to contribute to the survey in 2003–4 and most of these agreed to contribute to the survey in the 5 following years (). The number of properties with groundwater allocation for agriculture increased to 22 in 2006–7 with the sale of land in part of a property; the purchaser of this land agreed to contribute to the survey in 2006–7 and 2007–8. Revenue from leased land was generally recorded in the survey as most lessees, and all lessees of larger blocks, contributed to the survey. However, revenues from small areas of leased land were not recorded; 2003–4 was the year with the most leased land area (18.1 ha) that had unrecorded revenue.
Table 2 Land area for nine classes of land use.
Surveys were completed with face-to-face interviews using a questionnaire that remained the same through the period of the survey. Interviews took place in September–October, with an aim of collecting information on land use and economic activity in the previous financial year. For example, face-to-face interviews in early October 2004 assessed land use and economic activity for the 2003–4 financial year. The survey assessed production and groundwater use by groundwater consent holders in the same irrigation season because financial years of groundwater consent holders end between March and August.
Land owners supplied information on production in each of five financial years 2003–4 to 2007–8. This information included: type of production, output, revenue (by product), production costs and product prices. Some property owners did not have, at the time of the survey, final revenue figures for the financial year and these owners estimated their full financial year revenue. Production was aggregated into five classes: dairy, including milk and stock; apples, including eight varieties; horticulture-other, including stone fruit, flowers and berry fruit with grapes that were not grown for commercial revenue; market gardening, including vegetables, tomatoes and herbs; and minor production including beef, sheep, maize, lucerne, hay and silage.
The survey had a small sample size with between 15 and 17 properties () and with relatively small land areas for some land uses, e.g. four horticulture-other properties irrigated 14.08 ha of land in 2003–4. The small sample size potentially affected assessments of trends over time in irrigated area, unit groundwater use (i.e. as m3/ha) and groundwater use efficiency (e.g. as production value/m3). Therefore, this paper only considered selected properties with the four main economic activities to assess trends in unit groundwater use and groundwater use efficiency.
Land uses recorded in the survey () were grouped into four main economic activities () for groundwater consent holders: dairy, apples, horticulture-other (various crops other than apples) and market gardening (various crops). Selected properties were identified so that land area, production and groundwater use could be reasonably attributed to the main economic activity and compared on a unit basis. Most groundwater irrigators took water from a single well on each property and groundwater would be used for multiple crops, if so planted. Therefore, selected properties were chosen where the main economic activity occupied 75%, or more, of the total irrigated area of the property and groundwater use was assigned to the main economic activity. Selected properties (e.g. eight properties in 2003–4) contained most of the land irrigated from the LCA, e.g. irrigation on selected properties was approximately 145 ha in 2003–4 (), which was 69% of the approximately 209 ha irrigated land in the LCA survey in that year.
Table 3 Revenue for four main economic activities and other land uses.
Table 4 Production revenue and irrigated area for selected properties.
Groundwater use records were collated by Tasman District Council from consent holders’ records submitted to the Council. Domestic use of groundwater by properties in the survey was minor. Only one property in the survey uses groundwater from the LCA for domestic use; for this property, domestic use was part of the metered irrigation pumpage. Annual groundwater use was assumed as equal to groundwater use in the irrigation season because groundwater use for irrigation outside the irrigation season was usually zero.
Rainfall and Penman Potential Evapotranspiration (PET) are calculated on a daily interval (G. Zemansky, GNS Science, pers. comm. 2010) at the National Institute of Water and Atmospheric Research's Nelson Airport () site. PET at this site has eight 1-day gaps in the period 2003–4 to 2007–8 and PET on these days was estimated as the average of PET on adjacent days.
Results
Main economic activities: trends in land use and revenue
The importance of the four main economic activities was indicated by the number of irrigators, area of properties, annual revenue and groundwater use. Irrigation for the four main economic activities occurred on 15 () of 17 () properties in the survey and approximately 190 ha () of the approximately 209 ha irrigated land in 2003–4. The four main economic activities dominated total revenue (). Properties with the four main economic activities were the largest users of groundwater as they took at least 97% of groundwater use by LCA irrigators. The land area () and revenue () for dairy and apples generally decreased over time. However, horticulture-other and market gardening typically increased in land area and revenue during the period of the survey.
Land use and explicit market signals
Total production revenue for selected properties increased significantly in the survey period from approximately $2.7 million to approximately $6.7 million reflecting land use changes with an increasing proportion of higher value uses over time (), consistent with Hubacek & Vazquez (Citation2002). In particular, dairy land use declined by 72.2 ha between 2004–5 and 2007–8 to be largely replaced by horticulture-other and market gardening. Returns from horticulture-other and market gardening, as measured by average revenue per hectare, were approximately three to seven times greater than dairy, and as measured by average gross profit per hectare were approximately two to five times greater than dairy ().
Most land use change (i.e. 93 ha of a total land use change of 130 ha, ) resulted in an increase in revenue per hectare. The move to higher values was emphasised by commercial land use transfer mechanisms such as leases and sales where payments were associated with land use change. Commercial mechanisms dominated land use change (i.e. land leases and a land sale totalled 77 ha, ) where land moved to higher value uses.
Table 5 Mechanism of land use change and revenue change, 2003–4 to 2007–8.
However, not all land use change was to higher value uses. ‘Owners own’ land use change commonly resulted in decreased revenue per hectare (), in agreement with Hubacek & Vazquez (Citation2002), who suggested that maximisation of income is not the sole aim of landowners. ‘Owners own’ land use change is where a property owner changed their own land use without entering into a lease or selling. Retirement of apple orchards was a significant ‘owners own’ land use change where returns from land decreased. Approximately 16 ha of apple orchards were converted to pasture between 2004–5 and 2005–6 (most of this land was then replanted in apples in 2008); reasons for these land use changes given by landowners included low returns and an intention to use land for a dwelling.
Economic signals can result in owners changing farm operation and moving to more efficient land use. For example, the behaviour of apple orchardists in selected properties over the period of the survey indicated multiple changes in land use practices in response to economic drivers, as follows:
| • | four apple orchards operated in 2003–4 and 2004–5 with a total irrigated area of 46.06 ha (); | ||||||||||||||||||||||||||||
| • | apple prices dropped to a low, in the survey period, of $12.50/TCE in 2004–5 (), which impacted on revenue per hectare () and profitability; in this year, selected properties showed an average gross loss of $9518/ha. As a result, growers decided to reduce the area of apple orchards so that the irrigated area of apples decreased to 20.64 ha in the 2005–6 season () as:
| ||||||||||||||||||||||||||||
| • | two apple orchards operated in 2005–6 and 2006–7 and one of these removed blocks of apple trees in 2005–6, which were providing low production per hectare; | ||||||||||||||||||||||||||||
| • | two apple orchards operated in 2007–8, planting 11.5 ha in new apple trees as a result of improved economics for apples. | ||||||||||||||||||||||||||||
Table 6 Dairy and apple production and efficiency measures, selected properties 2003–4 to 2007–8.
The effect of these land use changes was reduced production after 2004–5. However, production efficiency increased in remaining apple orchards with increased production per hectare, and increased production per cubic metre of water used, in 2005–6 and 2006–7 (). Returns for apple production per hectare in 2005–6 and 2006–7 were approximately twice the return in 2004–5 (). Greater returns are explained by production per hectare increasing approximately 50%, and by prices increasing 32% to 41%, over the 2004–5 figures (). The decline in revenue per hectare in 2007–8 was largely related to new plantings in apple orchards, which resulted in increased land area for apples (), but no production from the new plantings.
Groundwater use, land use and rainfall
A general decline in groundwater use per hectare occurred over the period of the survey as average total groundwater use by selected properties was 3070 m3/ha in 2003–4 and 2702m3/ha in 2007–8 (). Groundwater use efficiency increased over time as demonstrated by the increase in average revenue per cubic metre of groundwater applied ($4.9/m3 in 2004–5 and $16.7/m3 in 2007–8, ) because of changes in land use, increased efficiency of land use practices and product price.
Table 7 Groundwater use for selected properties with rainfall and rainfall minus Penman Potential Evapotranspiration (PET) at Nelson Airport during irrigation seasons.
Table 8 Groundwater use efficiency as revenue per cubic metre of groundwater applied on selected properties.
Land use change occurred with conversion of dairy to horticulture-other and market gardening. This typically caused water use per hectare to decline because dairy had a high water use (average 2368 m3/ha) relative to horticulture-other (average 2219 m3/ha) and market gardening (average 1790 m3/ha) ().
Production efficiency changed in the period of the survey, as demonstrated by dairy and apple production. Dairy production decreased in 2006–7 () as did groundwater use (). However, the efficiency of dairy production increased in 2006–7 with increased milk solid production per cubic metre of groundwater use (), decreased groundwater use per hectare () and increased revenue per cubic metre of groundwater applied (). A substantial price increase for milk solids in 2007–8 () contributed significantly to increased revenue per cubic metre of groundwater applied for dairy in that year ().
Multiple changes in land use practices in response to low apple prices in 2004–5 resulted in increased apple production per cubic metre of groundwater applied in 2005–6 and 2006–7. This was probably because of significantly increased average production per hectare (), as orchards focussed on better-performing varieties. New apple plantings in 2007–8 reduced apple production per cubic metre of groundwater use ().
Trends in total groundwater use and groundwater use by the four main economic activities in the period 2003–4 to 2007–8 () largely followed trends in land area (). For example, groundwater use by dairy declined significantly with the decline in irrigated land area by dairy. The coefficient of determination for a linear regression of total groundwater use with total irrigated land area was high (R 2=0.91). Coefficients of determination for groundwater use with irrigated land area by each of the four main economic activities were also high (dairy R 2=0.99, apples R 2=0.84, horticulture-other R 2=0.99 and market gardening R 2=0.98). Coefficients of determination were calculated, for comparative purposes, in the period 2004–5 to 2007–8, when all four land uses were represented by selected properties.
Rainfall and rainfall minus PET measured at Nelson Airport () are poor determinants of groundwater use by the four main economic activities. For example, the coefficient of determination for a linear regression of groundwater use by horticulture-other with irrigation season rainfall minus PET () had an R 2 of only 0.12 in the period 2004–5 to 2007–8. Counter-intuitively, total groundwater use by selected properties was typically less in drier irrigation seasons, e.g. the 2006–7 irrigation season had the lowest total groundwater use (276,704 m3/year) by selected properties and the least rainfall of any irrigation season in the period of the survey with rainfall 273 mm/season and rainfall minus PET-445 mm/season ().
Discussion
Explicit market signals drove a considerable improvement in groundwater use efficiency from 2004–5 to 2007–8 with a general increase in revenue per hectare () and a trend of declining water use per hectare (), e.g. with conversion of dairy land to horticulture-other and market gardening. Therefore, increased revenue from land was generally consistent with decreased irrigation applications. However, this may not always be the case. As an example, wholesale land conversion from market garden to horticulture would increase production value but would result in higher water use per hectare. This is because the average revenue was $26,160/ha for market garden and $56,714/ha for horticulture-other () with average groundwater use 1790 m3/ha for market garden and 2219 m3/ha for horticulture-other ().
An understanding of the economic value of land uses, variability of prices and impacts of price changes on water use is relevant to water management including estimates of future water demand. Future water demand can, to some extent, be predicted by product price. As an example, the decline in total groundwater use in 2005–6 by selected properties () was largely related to relatively low apple prices in 2004–5 ().
Information on water use and future water demand are critical information for those managing the freshwater resource. Water management aims by Central Government, and water management authorities, include measurement of water use to contribute to improvements in the efficient use of freshwater (Ministry for the Environment Citation2006). The LCA survey showed that economic signals were driving groundwater use efficiency in selected properties as measured by m3/ha () and revenue/m3 (). Therefore, this survey suggests that price and revenue data will be useful for water managers in understanding water use efficiency drivers. Water managers could collect data on product price, revenue and irrigated land area to analyse drivers, such as price sensitivity, for the range of actual and possible irrigated land uses.
Lastly, an assessment of economic signals is relevant to best irrigation practices. Groundwater use efficiency varied considerably across land uses and within land uses. For example, revenue per cubic metre of groundwater use for apple production was between $7.3/m3 and $13.3/m3 in the period of the survey (), with considerable variability between individual apple orchardists. Land owners generally aim to maximise their overall return and not water use efficiency. However, best practice water use by irrigators could be encouraged, ideally as a community-based initiative between peer groups, by comparing groundwater use efficiencies and land use practices amongst irrigators.
Conclusions
A longitudinal survey of users taking groundwater from the LCA for agricultural purposes assessed land use, groundwater use, production and revenues in the five financial years from 2003–4 to 2007–8. The survey included the majority of properties, irrigated land area and irrigation allocation in the LCA groundwater zone. For example, groundwater allocation to properties in the survey was in the range 97–99% of total allocation for irrigation in the zone. Four main economic activities (dairy, apples, horticulture-other and market gardening) occupied up to 190 ha, which is most of the approximately 235 ha land area in the survey.
Revenue and profit from land were important drivers of land use change between the four main economic activities as land owners sought to increase their income, which is consistent with Hubacek & Vazquez (Citation2002). Most land use change in the survey period (i.e. 93 ha of a total land use change of 130 ha) resulted in an increase in revenue per hectare. Significant trends in irrigated land area in the survey period included an increase in horticulture-other by approximately 44 ha, an increase in market gardening by approximately 33 ha and a decrease in dairy by approximately 72 ha. Land uses with relatively annual high returns (horticulture-other with average revenue $56,714/ha and market gardening with average revenue $26,160/ha) generally replaced land with relatively low return (i.e. dairy with average revenue $8,265/ha).
Economic signals also resulted in changing land use practices by each land use. For example, apple production demonstrated how product price affects land use, and land use practices, leading to increased revenues per hectare. The low apple price, and financial losses by orchardists, in 2004–5 caused a significant reduction in the irrigated area of apples with removal of whole orchards and blocks of trees that gave low production per hectare. This led to an approximate 50% increase in production per hectare in 2005–6 and 2006–7 contributing, along with higher prices, to an approximate doubling in revenue per hectare in these years.
A causal link between economic returns and groundwater use change was identified. The general decline in groundwater use per hectare occurred with horticulture-other and market gardening typically using less groundwater per hectare than dairy and retirement of land used for apple orchards because of low apple prices in 2004–5. Economics provided an efficiency driver for groundwater use. Groundwater use efficiency typically increased over time in the LCA with average revenue per cubic metre of groundwater applied of $4.9/m3 in 2004–5 and $16.7/m3 in 2007–8 because of changes in land use, land use practices and product price. However, groundwater use efficiency does not necessarily increase over time for all crops. For example, groundwater use efficiency by apples, as measured by revenue per cubic metre, declined in 2007–8 with new apple plantings.
Land use, not rainfall, controlled groundwater use in the LCA as the variability of groundwater use was explained by the variability of irrigated land area but not by seasonal rainfall, and seasonal rainfall minus PET. This finding suggests that an understanding of economic signals will aid water management because groundwater use efficiency measures were linked to economic drivers. An understanding of economic signals by water managers may also assist in identifying drivers for future water demand.
Acknowledgements
The contribution of irrigators that take groundwater from the LCA has been crucial to this project. I would like to thank them all for their assistance including design of the survey and annual interviews. I would particularly like to thank Murray King, Chairman of the Waimea Water Users Committee, who assisted through the period of the survey.
I would also like to thank staff at Tasman District Council, including Daryl Page, for supplying water users’ weekly records, and Joseph Thomas for supplying the map that was the basis of . Thanks also go to GNS Science staff: Connie Tschritter and Kate Goodrich, for processing some of the data collected in the survey; and Jenny Rose and Magali Moreau-Fournier for useful comments on a draft of this paper.
The bulk of the funding for this project was provided by GNS Science. Part of this project has been funded under NZ Foundation for Research Science and Technology contract C09X0305 Integrated Catchment Management (ICM) and I thank Andrew Fenemor, Programme Leader ICM, for his support.
Related Research Data
References
- Basher L 2003 (compiler) . The Motueka and Riwaka catchments: a technical report summarising the present state of knowledge of the catchments, management issues and research needs for integrated catchment management . Lincoln , Canterbury, Landcare Research .
- Dicker MJI , Fenemor AD , Johnston MR 1992 . Geology and groundwater resources of the Waimea Plains, Nelson . New Zealand Geological Survey Bulletin 106. . Department of Scientific and Industrial Research ,
- Hubacek K , Vazquez J 2002 . The economics of land use change. International Institute for Applied Systems Analysis . Interim report IR-020015 .
- Landcare Research 2011 . New Zealand Land Resource Inventory, Fundamental Soil Layer . lris.scinfo.org.nz .
- Lincoln Environmental and Agfirst Consultants 2003 . Tasman regional water study technical report Stage 1: land and climate suitability for irrigated crops . Report 4487/1 for Tasman District Council .
- McQueen DJ 1993 . Glossary of soil physical terms . Lincoln , Canterbury, Landcare Research .
- Ministry for the Environment 2006 . Proposed National Environmental Standard for Water Measuring Devices Discussion Document . ISBN: 0-478-30114-6 .
- Northington Partners 2010 . Waimea Water Augmentation Committee Financial and Economic Assessment of Water Augmentation in the Waimea Catchment .
- Tasman District Council 1991 . Waimea Catchment Water Management Plan .
- Thomas , JA . 2001 . “ Tasman ” . In Groundwaters of New Zealand , Edited by: Rosen , MR and White , PA . 411 – 425 . Wellington : New Zealand Hydrological Society Inc .
- White , PA and Reeves , RR . 1999 . Waimea Plains aquifer structure as determined by three-dimensional computer modelling . Journal of Hydrology (NZ) , 38 : 49 – 75 .
- White , PA , Sharp , BMH and Kerr , GN . 2001 . Economic valuation of the Waimea Plains groundwater system . Journal of Hydrology (NZ) , 40 : 59 – 76 .
- Wratt D , Mullan B , Ramsey D , Baldi M 2008 . Climate change and variability—Tasman District . National Institute of Water and Atmospheric Research , Wellington Client Report WLG2008-51 .