Abstract
The Sherry River, a tributary of the Motueka River (Tasman District, upper South Island, New Zealand), has somewhat degraded water quality related to a high proportion of the catchment being used for pastoral agriculture (which comprises 30% dairying). We undertook a campaign to estimate loads of phosphorus, nitrogen and Escherichia coli for comparison with other dairy-impacted catchments and against which to measure future reductions in pollutants in the Sherry River, expected from changed management practices. Monthly water quality sampling in the Sherry River was augmented with storm chasing for one year (October 2008 to October 2009). Loads of pollutants in events increased disproportionately with event peak flow, probably because the proportion of overland flow increases systematically with increasing event size. Stormflows (occurring 9.5% of the time) transported 33% of the total flow from the Sherry River, and between 22% (for nitrate) and 92% (for E. coli) of pollutant loads.
Introduction
Deterioration of water quality due to pastoral farming is widely documented, with livestock known to be a major contributor to pollutant loads (FAO Citation2006). In New Zealand, water quality is compromised in urban and pastoral catchments and has been declining generally as pastoral agriculture (currently occupying about 40% of the country's land area) intensifies (Ballantine & Davies-Colley Citation2009; Ballantine et al. Citation2010; Verburg et al. Citation2010; Howard-Williams et al. Citation2011). Three main categories of pollutant are mobilised by pastoral farming: fine sediment; nutrients (nitrogen and phosphorus); and faecal microbes, all of which can have a detrimental effect on rivers and downstream waters (Howard-Williams et al. Citation2011). Fine sediment reduces visual water clarity and light penetration (Davies-Colley & Smith Citation2001; Davies-Colley et al. Citation2003) and causes downstream sedimentation issues with multiple impacts on the health of aquatic ecosystems, leading to the loss of diversity and dysfunction of community structure (Wood & Armitage Citation1997; Bilotta & Brazier Citation2008; Collins et al. Citation2010; Kemp et al. Citation2011). The nutrients nitrogen (N) and phosphorus (P) promote eutrophication with algal blooms that can degrade the ecological integrity of freshwater and affect recreation and aesthetic values. Faecal microbes compromise the suitability of waters for water supply, contact recreation and shellfish harvest.
We need information on pollutant loads from catchments to help us understand processes which govern the mobilisation, transport and delivery of pollutants from land to water, so that we can manage land and water more effectively (e.g. Roygard et al. Citation2012). Diffuse loads of some pollutants (e.g. E. coli) are hard to quantify for a variety of reasons. The pollutant sources can be sporadic and difficult to trace because of interactions between a range of physical processes and landscape characteristics which change continually throughout the year. Characterisation of water quality over time is straightforward in principle and is achieved by sampling at regular intervals, usually monthly. While establishing time-distributions of water quality is useful, monthly sampling is usually inadequate to estimate loads of certain pollutants (notably suspended sediment, total phosphorus and faecal indicator bacteria) to downstream waters (lakes, estuaries; Roygard et al. Citation2012). Such loads are typically dominated by stormflows occurring only a small proportion of the time in which fluxes (concentration×flow) may be orders of magnitude higher than in baseflows (e.g. Kirchner et al. Citation2004). Sampling through high flows normally requires the use of autosamplers that are triggered when a predetermined flow threshold is exceeded. Samples are collected throughout the storm event while flows remain above this threshold. Load estimation is therefore a significant challenge and usually requires intensive year-round sampling programmes that are configured to generate detailed information on pollutant concentrations and fluxes over a range of hydrological conditions.
The Sherry River, in the Motueka catchment, Tasman Bay, South Island, New Zealand, has been of particular interest in the Motueka integrated catchment management (ICM) programme ever since it was identified as a ‘hot spot’ of faecal microbial pollution in a 2000–2001 survey of water quality over the whole Motueka catchment (Young et al. Citation2005). The faecal pollution of the Sherry River was plausibly attributed to dairy farming, and specifically to dairy herd crossings (on average about twice per day) when cows were moved from pasture to milking parlour and vice versa. A special study of herd crossings (Davies-Colley et al. Citation2004) quantified loads of pollutants and suggested that the microbial status of the Sherry River would be greatly improved by elimination of crossings. All four habitual crossings of the main-stem Sherry River are now bridged (since September 2007). In addition, best management practices (BMPs) are now being implemented progressively in the Sherry catchment, and are expected to improve water quality and gradually reduce loads of a range of pollutants to downstream waters over time.
Water quality data from routine monthly sampling in the Sherry River shows that the river remains polluted by faecal microbes. Concentrations of other water quality variables are mostly within the ANZECC & ARMCANZ (Citation2000) guidelines. Information on time variation of water quality from routine sampling is, however, insufficient for a comprehensive assessment of water quality because downstream impacts tend to be dominated by stormflows, particularly contaminated river plumes in coastal waters. This is particularly true for E. coli, concentrations of which may be three orders of magnitude higher in stormflows than in baseflows. For example, McKergow and Davies-Colley (Citation2010) found that the faecal microbial load from the whole Motueka catchment was yielded in stormflows, and it is these stormflow plumes that are a particular hazard to swimmers and harvesting of shellfish within Tasman Bay (Cornelisen et al. Citation2011; Wilkinson et al. Citation2011). Concentrations of other water quality variables are less strongly related to flow; however, storm loads may still represent a large proportion of the total loads simply because of the high water volumes discharged.
There is a need, therefore, to include data from storm events into any comprehensive assessment of water quality and impacts on waters downstream. However, until now, there has been no information gathered specifically on water quality and pollutant loads in high flow events in the Sherry River, when, as has been found for other catchments (e.g. Sharpley et al. Citation2008; McKergow & Davies-Colley Citation2010), high pollutant fluxes may be expected to occur. In agricultural catchments, elevated nutrient loads will frequently be associated with elevated loads of faecal bacteria, and the Sherry River is no exception. In recognition of this, we have examined loads of nutrients and E. coli through high flow events. Examination of a range of these pollutants through both base and stormflow conditions should help us understand differences in delivery and transport mechanisms, which will in turn help support decision-making on how best to target load reductions of each contaminant over time.
The aim of this paper is therefore to report on the water quality of the Sherry River, with particular emphasis on water quality and pollutant loads through high flows. The measurements of water quality and pollutant loads presented here will provide a valuable baseline against which to gauge the success of management action in the Sherry catchment.
Catchment description
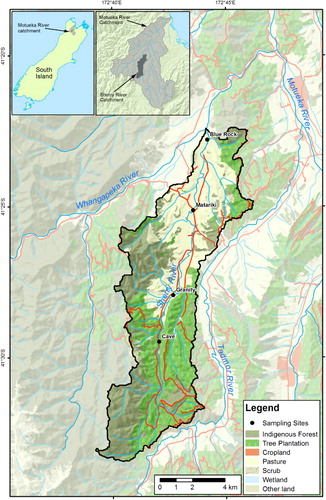
The Sherry River flows into the Wangapeka River, which, in turn, is a tributary of the Motueka River that drains to Tasman Bay in the north of the South Island (). In the lower reaches, the Sherry catchment is predominantly pastoral, accounting for 30% of the total catchment, while tree plantations and indigenous forest dominate in the upper reaches. The catchment area above the Blue Rock hydrometric station is 78.4 km2. The overall climate of the Motueka catchment is classified as cool humid (Basher Citation2003). The annual rainfall in the Sherry catchment is approximately 1250 mm, with maximum rainfall in winter and spring. The catchment is underlain by granite on the western side and upper reaches, mudstone and sandstone on the eastern side, and terrace gravels of various ages in the valley itself. The mudstone deposit acts as an impervious barrier to groundwater, giving rise to a high water table in the river basin. Soils in the catchment are highly variable, and include the Sherry sand and sandy loams on the river flats, and Matariki silt loams on the terraces. Low elevation hills are covered with Tadmor hill soils, while Kaiteriteri and Glenhope soils occur on the steeper hill country along the western margins of the valley. Elevation ranges from 150 m in the lower reaches to 874 m in the upper reaches. Environmental concerns in the Sherry River include microbial, sediment, habitat and water quality issues associated with pastoral agriculture (Young et al. Citation2005).
Materials and methods
Hydrometric infrastructure
A hydrometric station was established at the Blue Rock sampling site on 14 January 2008 to aid interpretation of water quality and to enable load quantification. The hydrometric instruments included a pressure transducer (ISD analog, 0–5 m, developed by NIWA) and a Waterlog DAA H500XL data logger. A continuous field turbidity meter (Greenspan TS1200, 0-2000 NTU nominal range) was deployed at Blue Rock from 15 October 2008 (beginning of the one-year storm chasing period), and turbidity data was logged every 15 min by the hydrometric logger. The turbidity record was used as a continuous surrogate for certain water quality variables calibrated to measurements on autosamples, as discussed below. Rainfall was measured at Matariki in the Sherry catchment ().
Water quality sampling
Water quality samples were collected over a range of hydrological conditions, both manually on regular monthly visits and using an autosampler to target stormflows.
Monthly samples (mainly in baseflow conditions) have been collected since May 2003 from four sampling sites on the Sherry River (in order moving downstream): Cave; Granity; Matariki; and Blue Rock (). Samples were stored on ice and transported by overnight courier to NIWA's water quality laboratory in Hamilton.
For a 13-month storm chasing period (October 2008–October 2009) samples were also collected through high flow events by an autosampler (ISCO 3700) installed at Blue Rock station. The autosampler was activated when flow exceeded 3.76 m3 s−1 (8.5 percentile flow) and samples were thereafter collected hourly until flows dropped below the trigger or until the sampler carousel was full with 24 samples. Storm event samples were retrieved within 24 h of the event and a fraction of the samples, selected using the turbidigraph as a guide, analysed by the Cawthron Institute's laboratory in Nelson.
Monthly samples were analysed for total phosphorus (TP), dissolved reactive phosphorus (DRP), total nitrogen (TN), nitrate–nitrogen (NO3–N) and ammoniacal–nitrogen (NH4–N), turbidity (Hach 2100 AN bench nephelometer) and the faecal indicator bacterium, E. coli. Water samples for E. coli analyses were processed within 24 h of collection using a standard culture method (APHA Citation2005; 9223B Colilert). Subsamples for dissolved and total nutrient analysis were filtered within 48 h of collection and frozen. Samples collected over storm hydrographs were analysed by the Cawthron Institute's laboratory for the same variables by closely comparable methods to those used on routine monthly samples.
Load calculations and analysis
To calculate pollutant loads through high flow events, two different methods were used. Turbidity has been shown to be a reliable predictor of E. coli, TP, TN and other contaminants in a range of studies (Stubblefield et al. Citation2007; Davies-Colley et al. Citation2008; McKergow & Davies-Colley Citation2010; Jones et al. Citation2011; Kim et al. Citation2012). Events were analysed individually and, where water quality variable concentrations (TP, TN, E. coli, DRP, NO3–N) for a given event correlated strongly with turbidity (R2>0.5), the continuous variable was used as a surrogate. The regression equation, a function of turbidity (or flow), was used to simulate ‘continuous’ (15 min) water quality data. These simulated concentrations (g/m3) were multiplied by the relevant flows (m3/s) to give fluxes in g/s. Multiplying each flux by the 15 min (900 s) time step gave 15 min partial load estimates (g), and summing these 15 min loads provided a total load value (g) for the whole event. This method was used for 14 of the 16 events monitored.
For the two events for which the correlation between the water quality variable and turbidity was weaker than the level stated above, the concentration of each water quality sample (g/m3; assumed to be characteristic of a certain time interval), was multiplied by the relevant average 15 min flow (m3/s) to estimate an average flux (g/s) over that interval (‘average discharge–average concentration’ method). Measured concentrations (g/m3) were multiplied by volume (m3) discharged during the time interval over which they were assumed to be characteristic, to give partial loads (g), which were then summed over the whole event to give total event load (g). Individual events were defined from the start of the hydrograph rise until flow recession rates had returned to baseflow levels.
Baseflow loads (i.e. loads delivered between storm events) were calculated using the average discharge–average concentration method from monthly water quality data. The concentration of each water quality variable for a particular month (assumed constant for baseflow conditions for that month) was multiplied by the (15 min) flow data for the same month to give the flux (g/s), which was then multiplied by the 15 min time step (900 s) to give 15 min loads (g). Fifteen minute loads were then summed to provide a mass load value (g) for the baseflow portion of each month.
Results
Hydrology
Over the period October 2008 to October 2009, total rainfall was 1213 mm (mean annual rainfall 1250 mm). Rainfall for sampled storm events ranged from 16.3 mm to 63.1 mm, with a median rainfall of 34.6 mm (). Event duration ranged from 26 to 105 h (median 46 h), and was correlated with the runoff coefficient (total water yield/total rainfall volume) (Spearman's ρ=0.56, significant at the 95% level). From October 2008 to October 2009, sampled stormflow events accounted for 9.4% of the time, and discharge ranged more than 1000-fold from 0.031 to 47 m3 s−1 (mean discharge was 1.64 m3 s−1, median discharge was 0.95 m3 s−1). Sixteen events () were sampled over the year from October 2008 to October 2009, encompassing a wide range of storm size with peak discharges ranging from 5 m3 s−1 to 47 m3 s−1. Some events occurred after periods of dry weather, as indicated by the flow 48 h prior to the peak event flow (), while others were more closely spaced (for example, events in December 2008; ). Peak flow was not significantly correlated with the rainfall volume (Spearman's ρ=0.385, P>0.05) highlighting the strong influence of antecedent conditions. Event 7 was the smallest, in terms of peak flow and total water yield, yet had a comparable amount of rainfall to other events. This late summer event followed a very dry period and had the lowest average flow 48 h before peak flow. Event 16 had the highest peak flow and rainfall volume. Event 14 had the highest total water yield.
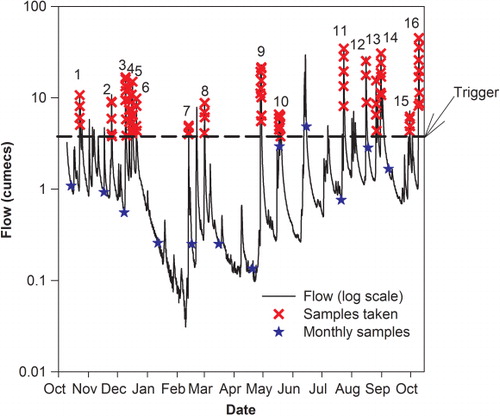
Table 1 Monitored event characteristics.
Turbidity
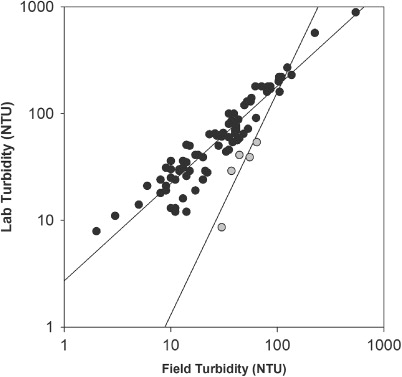
Results from laboratory turbidity and field turbidity differed numerically by about 2-fold on average, but were strongly correlated (; Spearman's ρ=0.886) overall. However, there was evidence of significant offset of the field sensor on one event (Event 7, 12 February 2009) for which data plotted much higher and at a very different slope to other events (), possibly because it was the first event recorded after a prolonged summer dry spell during which flow had receded to less than 0.1 m3 s−1 ().
Water quality state: monthly sampling
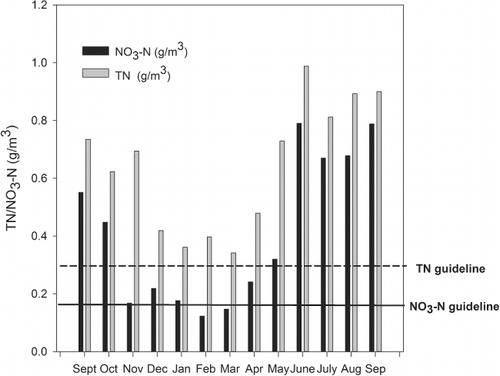
Median values for water quality variables were compared with the ANZECC & ARMCANZ (Citation2000) upland (>150 m) guidelines (). Median concentrations of TP, DRP and NH4–N were lower than the upland guideline values at all sites, while median concentrations of NO3–N and TN were higher than the upland guideline values at Matariki and Blue Rock. Concentrations of water quality variables tended to increase with distance downstream, and concentrations of NH4–N, TN, NO3–N, TP and E. coli were significantly lower at Cave, and concentrations of NH4–N, TN and NO3–N were significantly lower at Granity, when compared with Blue Rock (P<0.001, Kruskal Wallis, Tukey Test). With the exception of the 95th percentile for E. coli, concentrations of water quality variables in the Sherry River are low when compared to those in other monitored dairy catchments ().
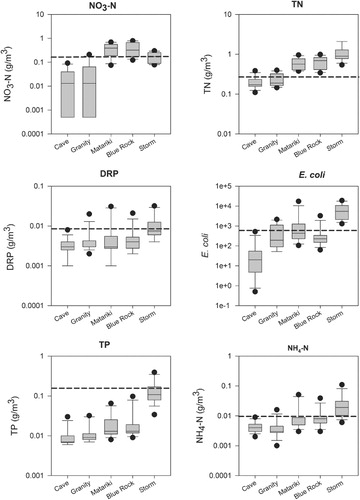
Table 2 Median concentrations and annual specific yield of water quality variables for the Sherry River at Blue Rock (October 2008–October 2009) compared with medians and annual specific yields of water quality variables for three monitored dairy catchments (Wilcock et al. Citation2007).
There is evidence of high nitrogen leakage in this catchment. NO3–N concentrations at Blue Rock were higher than the upland ‘trigger’ values on 11 of the 13 sampling occasions (), while the median TN concentration, and TN concentrations for all months, exceeded the ANZECC & ARMCANZ (Citation2000) upland ‘trigger’ value at Blue Rock (). Patterns of NO3–N and TN concentrations at Matariki were very similar to those at Blue Rock, and NO3–N concentrations exceeded the ANZECC & ARMCANZ upland trigger values for 11 of the 13 months, while TN concentrations exceeded the ANZECC & ARMCANZ upland trigger value every month. At all Sherry River sites except Cave, E. coli concentrations exceeded the Ministry for the Environment (MfE) and Ministry of Health (MoH) (Citation2003) action ‘alert’ threshold based on 95th percentiles (550 E. coli/100 ml; 95th percentile used).
Water quality state: stormflow
Median concentrations of water quality variables measured through storm events at Blue Rock in the Sherry River are given in . Median stormflow concentrations of all water quality variables (DRP, TP, TN, NH4–N and E. coli) are significantly higher (P<0.05, Mann Whitney) than those measured in baseflow, except NO3–N concentrations, which are significantly lower in stormflow than baseflow (P<0.05, Mann Whitney).
Indices of event size
Runoff coefficients (calculated as total water yield/rainfall) for the sampled events are given in . The highest runoff coefficient was associated with event 14, which also had the highest water yield, highest flow 48 h before the event, third highest peak flow and was the second longest event. This event transported the highest DRP and NO3–N loads. Event 7, the event with the lowest runoff coefficient, and the smallest water yield, followed a prolonged dry period and transported the lowest loads of pollutants. While the rainfall volume for event 7 was comparable with that recorded for other events, peak flow, runoff coefficient and pollutant transport were lowest for this event, reflecting the dry conditions, minimal runoff from land and subsequently minimal in-channel pollutant accumulation.
Loads of all pollutants were significantly correlated with peak flow, while loads of all pollutants except E. coli were significantly correlated with water yield and runoff coefficients at the 99% level (). All pollutants except E. coli were correlated with event rainfall (). Runoff coefficients, peak flow and water yields for storm events are closely related and significantly correlated, while event rainfall was significantly correlated only with water yield.
Table 3 Spearman rank correlations between (1) runoff coefficient and pollutant loads (2) peak flow and pollutant loads (3) water yield and pollutant loads and (4) event rainfall.
Loads of pollutants in events
Information on loads of selected pollutants transported through storm events is presented in and . Total pollutant loads (stormflow and baseflow) were generally lower in dry seasons (summer–autumn) than in wet seasons (winter–spring), as might be expected from the generally lower than average flow in the former season. Stormflow was most important for transporting E. coli, TP and NH4–N, and less important for NO3–N and TN, transporting only 22% and 45% of the total annual loads of these latter variables respectively (). Loads of pollutants in storm events increased with event size (indexed by peak flow), although with appreciable scatter (). For all variables, pollutant load increased faster than peak flow, as shown by linear regression on log-transformed variables, with power law exponents >1.0. Peak flow was used as the index of event size because it is significantly correlated with all pollutants ().
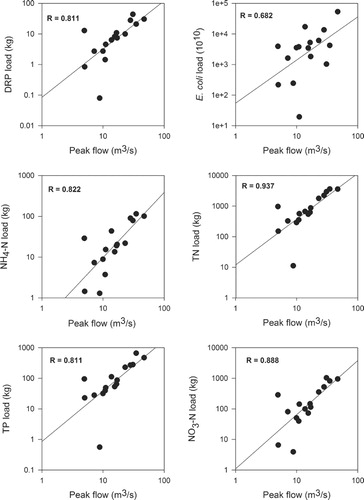
Table 4 Loads of pollutants transported in 16 sampled storm events in the Sherry catchment (October 2008–October 2009).
Table 5 Water yields, total loads of pollutants and% of water yields and total pollutant loads transported in stormflows and baseflows.
The contribution of dissolved to total nutrients varied by event, with the lowest contribution from NO3–N to TN (4%) and DRP to TP (4%) reported for event 7 (12 February 2009), possibly due to instream uptake over the preceding dry period.
Discussion
Overview of water quality in the Sherry River
Water quality within the Sherry catchment, upstream of most pastoral influence, is generally good, with baseflow concentrations of most pollutants less than the ANZECC & ARMCANZ (Citation2000) upland guidelines. However, water quality deteriorates with distance downstream through pastoral land, with concentrations of some water quality variables (most notably NO3–N and TN) exceeding ANZECC & ARMCANZ (Citation2000) upland trigger values.
NO3–N and TN concentrations showed a strong seasonal pattern, with lower concentrations observed through the growing season (summer time) and higher concentrations observed in the pre- and post- growing seasons (winter time). This pattern has been reported by other researchers (Luz Rodriguez-Blanco et al. Citation2009; Zhu et al. Citation2011, Citation2012; Melland et al. Citation2012). The lower NO3–N concentrations can be explained by greater plant uptake and enhanced microbial activity (denitrification) during the growing season, and low leaching rates through dry periods. The higher NO3–N concentrations observed outside of the growing season reflect: (1) reduced uptake by crops outside of the growing season, and suggest that there is a lot of nitrate taken up by crops in the growing season; and (2) greater leaching through the soil profile to the river (Luz Rodriguez-Blanco et al. Citation2009). The geology of the Sherry River valley will also facilitate easy leaching of nitrate through the soil and gravels, and into the river. Deeper leaching into the soil profile is impeded by the impervious mudstone layer.
As with NO3–N, DRP concentrations were lower in summer and, for this study, were highest in May, outside of the growing season, which may also reflect lower uptake by crops and greater leaching through the soil profile. TP concentrations were highest in November and May, with lower concentrations through the growing season. The elevated TP concentrations may be attributable to sampling through elevated flows, as TP concentrations were higher in stormflow than baseflow.
E. coli numbers exceeded the MfE and MoH (Citation2003) guidelines for microbiological quality, showing that, despite improvements following bridging of dairy crossings, the Sherry River is still microbially polluted.
Dairying accounts for about 30% of land use in the Sherry catchment, and water quality is generally better when compared with other more intensively farmed dairy catchments in New Zealand. Median values for nutrients (DRP, TP, TN, NO3–N and NH4–N) in the Sherry River are generally lower than those reported by Wilcock et al. (Citation2007) for the Toenepi, Waiokura and Bog Burn catchments, in which land use is predominantly dairy. Visual clarity in the Sherry River is also higher than reported for the dairy catchments.
Water quality through storm events
Concentrations of water quality variables are generally higher in storm events than at baseflow. This was especially the case for E. coli concentrations, the concentrations of which were 21 times higher in stormflow than in baseflow. Other authors have observed similar increases in E. coli through storm events; for example, McKergow and Davies-Colley (Citation2010) observed higher E. coli concentrations in the Motueka River in elevated flow conditions.
TP concentrations also increased in stormflow and were 9 times higher than at baseflow. Again, other authors have observed similar increases in TP concentrations; for example, Sharpley et al. (Citation2008) and Luz Rodriguez-Blanco et al. (Citation2009) reported elevated TP concentrations when monitoring high flow events in agricultural and agroforestry catchments. Considerable tree cropping occurred in the upper Sherry valley during this study and may have contributed to the elevated TP concentrations.
In this study we observed little difference between baseflow and stormflow DRP concentrations, which contrasts with the observations of Sharpley et al. (Citation2008), Luz Rodriguez-Blanco et al. (Citation2009) and Roygard et al. (Citation2012), who all observed elevated DRP concentrations through high flows.
Concentrations of TN increased (1.5 times baseflow concentration), but to a lesser degree than TP concentrations, which is similar to the finding of Zhu et al. (Citation2011) who observed that stormflow TN concentrations varied little from baseflow concentrations, but in contrast to the observations of Kato et al. (Citation2009), who found that TN concentrations decreased through high flows. TN losses are mainly from surface losses through storms (Zhu et al. Citation2011). As has been observed by other authors (e.g. Granger et al. Citation2010; Chen et al. Citation2012), NH4–N concentrations increased in stormflows, most likely because its source is from wash-in of livestock dung and farmyard areas (Granger et al. Citation2010), so this constituent behaves more like a particulate than other dissolved materials. NO3–N concentrations decreased through storm conditions, indicating dilution, as has also been observed by Zhu et al. (Citation2011), Luz Rodriguez-Blanco et al. (Citation2009) and Zhang et al (Citation2011). In contrast to TN and NH4–N losses, NO3–N losses are mainly subsurface (Granger et al. Citation2010; Zhu et al. Citation2011; Chen et al. Citation2012). Pollutant concentrations tended to be higher in winter storms when compared to summer storms, with NO3–N concentrations showing the greatest tendency to be higher in winter events.
Storm loads versus event size
Stormflow events monitored in the Sherry catchment had a median length of 47 hours (range 26–106 h), resulting in stormflow for approximately 9% of the study period. Stormflows were very important however, for both concentrations and loads of all pollutants sampled. Loads of pollutants correlated with water yield and tended to increase disproportionately with event size.
Runoff coefficients for the monitored events in the Sherry River catchment ranged from 0.06 to 0.73 (median 0.34) and are high compared to other studies. For example, Sasal et al. (Citation2010) calculated runoff coefficients ranging from 0.07 to 0.31 for rainfall events greater than 70 mm and in the range 0.02 to 0.34 for intermediate rainfall events (41–69 mm). The maximum runoff coefficient observed by Leitinger et al. (Citation2010) in alpine pasture was 0.25 (range 0–0.25). High runoff coefficients for this study suggest the effect of rainfall is rapid and that the catchment is very responsive, with flows rising from, and falling back to, baseflow swiftly. A high runoff coefficient may also be associated with higher pollutant loads because there is increased opportunity for entrainment of particulate pollutants. For this study, runoff coefficients were significantly correlated with all pollutants except E. coli. The high runoff coefficients may be partly due to the fact that rainfall was monitored at Matariki, while flow was measured at Blue Rock, a short distance downstream; however any influence is considered to be negligible.
Pollutant loads through storm events
Storm yields of all pollutants were strongly correlated with peak flows (and all except E. coli are strongly correlated with water yield, runoff coefficient and event rainfall), although there was considerable scatter which may reflect antecedent conditions prior to flushing events. However, stormflow yields tended to increase disproportionately with flood size (water yield or peak flow) because in bigger events, entraining stream power is higher and contributing areas expand in the catchment. Escherichia coli loads were not significantly correlated with the runoff coefficient, and E. coli concentrations tended to peak ahead of peak flow, which is consistent with the concept of in-channel mobilisation of E. coli from the channel bed sediment in floods dominating over wash-in with runoff (Davies-Colley et al. Citation2004, Citation2008; Wilkinson et al. Citation2006; McKergow & Davies-Colley Citation2010). If washed-in with overland flow, E. coli loads should be significantly correlated with the runoff coefficient. The lack of correlation with water yield also suggests a finite supply of E. coli, again consistent with mobilisation of in-channel stores, rather than wash-in with overland flow.
Stormflow versus baseflow
Stormflow water yield was about one third, and baseflow water yield about two thirds, of the total water yield over the monitored period, which agrees with other studies. For example, Tomer et al. (Citation2005) found that stormflows represented 34% of total flow in streams in western Iowa, while Sharpley et al. (Citation2008) found that 32% of flow was stormflow in tributaries of the Susquehanna River, Pennsylvania. In the dairy-dominated Toenepi catchment (New Zealand), stormflows occurred 24% of the time (Davies-Colley et al. Citation2008).
Yields of DRP and TP were higher through stormflows than in baseflow conditions. For the year October 2008–October 2009, 51% of DRP and 74% of TP were transported in stormflows. Other authors have reported similar results, for example Sharpley et al. (Citation2008) reported exports of 65% and 80% of DRP and TP in stormflow. The proportion of DRP transported in baseflows and stormflows was similar (49%–50%), but stormflows accounted for only 9% of the study period, meaning that they were still important for DRP transport. As with NO3–N, subsurface transport may also be important for DRP (Luz Rodriguez-Blanco et al. Citation2009) through both stormflows and baseflows. In-channel sources may dominate DRP loads at the beginning of storm events but, later, DRP loads may come from subsurface sources. TP loads throughout were dominated by the particulate fraction, as was also found by Luz Rodriguez-Blanco (2009), with the contribution of DRP to TP only 8% and 21% in stormflows and baseflows respectively. Areas close to the river are likely to be the main sources of TP and particulate phosphorus (PP), with banks also contributing.
In the Sherry catchment, high flow events were relatively less important for nitrogen fractions, except for NH4–N. Sixty-three per cent of NH4–N was transported in storm events, suggesting that NH4–N transported in the Sherry River was mainly particulate material from surface sources. Only 22% and 45% of total loads of NO3–N and TN respectively were transported in storm events, meaning that yields were lower in stormflow than baseflow due to dilution (). Also, the contribution of NO3–N to TN was higher for baseflow (69%) than in stormflow (4% to 35%), highlighting the degree of dilution. These observations for nitrogen compounds are consistent with those of Zhu et al. (Citation2011), who noted that only 25% of NO3–N and 35% of TN were exported in stormflow, and Schilling and Zhang (Citation2004) who found that more than 50% of NO3–N was exported in baseflow in two central Iowa catchments with mixed land use. In direct contrast, Drewry et al. (Citation2009) found that 96% and 93% of NO3–N and TN loads were transported in storm events monitored in South Australia.
Yields of E. coli were higher through stormflows than in baseflow conditions. For the year October 2008–October 2009, 92% of E. coli was transported in stormflows. McKergow and Davies-Colley (Citation2010) reported that 98% of E. coli was exported in stormflows from the Motueka River, while Davies-Colley et al. (Citation2008) reported that 95% of the E. coli load from the (dairy-dominated) Toenepi catchment (15 km2 area) was transported in high flow events.
Pollutant yields from Sherry River compared with other catchments
Total specific yields DRP, TN, NO3–N in the Sherry () are lower than those in the Toenepi, Waiokura and Bog Burn catchments (Wilcock et al. Citation2007). The specific yield of TP was higher in the Sherry River than in the Bog Burn.
Specific yields of E. coli are much higher in the Sherry River than in the Motueka River into which it eventually flows (McKergow & Davies-Colley Citation2010). Escherichia coli specific yields by event for the Sherry River are, however, lower than those reported by McKergow and Davies-Colley (Citation2010) for events 4 and 8 in the larger Motueka catchment, as are total annual E. coli loads (McKergow & Davies-Colley Citation2010), most likely reflecting the larger catchment and greater E. coli supply. Specific yields of E. coli by event in the Sherry River are similar to the mean event faecal coliform export coefficients for United Kingdom catchments with >75% woodland or >75% rough grazing, as reported by Kay et al. (Citation2008). Kay et al. (Citation2008) do not report E. coli export coefficients as such, but we would expect these to be only slightly lower because E. coli typically comprises the majority of the faecal coliform group.
The significance of storm events in pollutant transport
This paper highlights the important contribution of storm events to total loads of certain pollutants transported in river catchments. Stormflows occurred 9.5% of the time and transported 33% of the water; however concentrations of pollutants were often much higher in stormflows, and disproportionately high loads of some pollutants (notably E. coli and TP) were often transported in larger events. In stormflows, E. coli concentrations are usually much higher than at baseflow, mainly because of entrainment of faecal microbes stored in stream sediments (e.g. Davies-Colley et al. Citation2008; McKergow & Davies-Colley Citation2010). TP concentrations are also elevated in storms due to mobilisation and transport of phosphorus-rich sediment from land to water, and its subsequent remobilisation from stores in the channel bed. Storms were also important for DRP; however most phosphorus transport in storms was of the particulate fraction. Storm events were less important for TN and NO3–N, as most NO3–N is transported in baseflow, due to dilution, but were still important for NH4–N transport.
This study highlights the importance of storm event transport for water quality variables. It also reflects the different physical processes and pathways taken by different pollutants from land to the channel network. The loads of water quality variables transported through each of the events were highly variable, and were related to the size of the event (water yield and peak flow). However, the events with the highest water yield, highest rainfall total or highest peak flow did not necessarily transport the highest pollutant loads, and other factors (e.g. distance of pollutant sources from waters, in-channel processing and antecedent conditions) may account for residual scatter. When rainfall is higher, there is the potential for greater amounts of runoff from land and for greater loads of particulate bound pollutants to be transported. Higher rainfall also means that there is greater potential for subsurface transport of pollutants, and this study shows that the role of subsurface transport of pollutants cannot be neglected, either through stormflow or baseflow, as it is the main route for NO3–N transport and possibly also an important pathway for DRP.
Events that occur after an extended dry period may transport relatively high pollutant loads because of mobilisation of the accumulated store of particulates, including faecal bacteria in the channel bed. For example Drewry et al. (Citation2009), in their study of storm events, observed highest pollutant loads for an event which followed a prolonged dry spell. However, for this study, the event which transported the lowest pollutant loads occurred in late summer after a prolonged dry spell. Flushing of the channel had occurred earlier in the summer, and accumulation and remobilisation of pollutants may have been minimal because of low rainfall, runoff and low antecedent flow conditions. Pollutant loads tend to decline in successive closely-spaced events, due to exhaustion of in-channel stores, as demonstrated by the gradually reducing loads of pollutants transported in a sequence of three events in December 2008.
Conclusion
In conclusion, this paper highlights the value of storm sampling as a monitoring tool. Storm chasing: (1) augments regular monitoring and captures high flow events more quickly and efficiently than fixed-interval monitoring; (2) allows storm dynamics to be considered, with insights into sources of pollutants; and (3) supports more realistic calculation of loads of pollutants (notably faecal microbes, sediment and particulate nutrients) that are primarily transported by these events. This study also highlights the varying role of storm events for different pollutants in the Sherry catchment. Phosphorus loads in both baseflows and stormflows are dominated by particulates, with most phosphorus transport in storm events. Particulate nitrogen dominates nitrogen transport in stormflow, while NO3–N dominates in baseflow. In contrast to phosphorus, nitrogen loads are higher at baseflow than in stormflow, highlighting the importance of year-round subsurface flows of NO3–N. Loads of E. coli are negligible in baseflow. This information suggests that methods to control dissolved nutrient transport (NO3–N and DRP) are required year-round in the Sherry catchment, while BMPs to control particulates (e.g. TP, TN and E. coli) should focus on high flow events. When a range of BMPs have been widely implemented in the Sherry catchment, a repeat of the storm chasing study presented here should demonstrate reduced pollutant loads as well as improved water quality.
Acknowledgements
Rob Merrilees was ably assisted in field work for this study by Kieran Scott and Ralph Dickson from NIWA–Nelson. Trevor James (TDC) and Roger Young (Cawthron Institute) assisted with study design, local information and liaison with the Cawthron laboratory; and Les Basher (LCR–Nelson) kindly loaned instruments for storm sampling. John Nagels (NIWA–Hamilton) collated monthly monitoring data. Thanks to Barbara Stuart (New Zealand Landcare Trust) and Andrew Fenemor (Landcare Research) for ongoing support and interest. Funding was from FRST programme ‘Integrated Catchment Management from the Ridgetops to the Sea’ (contract number C09X0305), and from ‘Freshwater Values, Monitoring and Outcomes’ (C09X1003), augmented by Envirolink contract ELF09214 to the Tasman District Council.
References
- Australian and New Zealand Environment and Conservation Council (ANZECC) & Agriculture and Resource Management Council of Australia and New Zealand (ARMCANZ) 2000. Australia and New Zealand guidelines for fresh and marine water quality, vol. 8. The guidelines. Environment Australia, Townsville, Australia. 678 p.
- APHA (American Public Health Association) 2005. Standard methods for the examination of water and wastewater. 21st edition. American Public Health Association, American Water Works Association and Water Environment Federation. Washington, D.C., USA.
- Ballantine DJ, Booker D, Unwin M, Snelder T 2010. Analysis of national river water quality data for the period 1998–2007. NIWA Client Report CHC2010-038 for MfE, Christchurch, New Zealand. 61 p.
- Ballantine DJ, Davies-Colley RJ 2009. Water quality trends at National River Water Quality Network sites for 1989–2007. NIWA Client Report, Hamilton, New Zealand. 43 p.
- Basher LR 2003. The Motueka and Riwaka catchments: a technical report summarising the present state of knowledge of the catchments, management issues and research needs for integrated catchment management. Landcare Research, Lincoln, New Zealand. 120 p.
- Bilotta GS, Brazier RE 2008. Understanding the influence of suspended solids on water quality and aquatic biota. Water Research 42: 2849–2861.10.1016/j.watres.2008.03.018
- Chen NW, Wu JZ, Hong HS 2012. Effect of storm events on riverine nitrogen dynamics in a subtropical watershed, southeastern China. Science of the Total Environment 431: 357–365.10.1016/j.scitotenv.2012.05.072
- Collins AL, Walling DE, Stroud RW, Robson M, Peet LM 2010. Assessing damaged road verges as a suspended sediment source in the Hampshire Avon catchment, southern United Kingdom. Hydrological Processes 24: 1106–1122.10.1002/hyp.7573
- Cornelisen CD, Gillespie PA, Kirs M, Young RG, Forrest RW, Barter PJ, et al. 2011. Motueka River plume facilitates transport of ruminant faecal contaminants into shellfish growing waters, Tasman Bay, New Zealand. New Zealand Journal of Marine and Freshwater Research 45: 477–495.10.1080/00288330.2011.587822
- Davies-Colley R, Lydiard E, Nagels J 2008. Stormflow-dominated loads of faecal pollution from an intensively dairy-farmed catchment. Water Science and Technology 57: 1519–1523.10.2166/wst.2008.257
- Davies-Colley RJ, Nagels JW 2008. Predicting light penetration into river waters. Journal of Geophysical Research 113: G03028.10.1029/2008JG000722
- Davies-Colley RJ, Nagels JW, Smith RA, Young RG, Phillips CJ 2004. Water quality impact of a dairy cow herd crossing a stream. New Zealand Journal of Marine and Freshwater Research 38: 569–576.10.1080/00288330.2004.9517262
- Davies-Colley RJ, Smith DG 2001. Turbidity, suspended sediment, and water clarity: a review. Journal of the American Water Resources Association 37: 1085–1101.10.1111/j.1752-1688.2001.tb03624.x
- Davies-Colley RJ, Vant WN, Smith DG 2003. Colour and clarity of natural waters. Science and Management of Optical Water Quality. Caldwell, NJ, Blackburn Press. 310 p.
- Drewry JJ, Newham LTH, Croke BFW 2009. Suspended sediment, nitrogen and phosphorus concentrations and exports during storm-events to the Tuross estuary, Australia. Journal of Environmental Management 90: 879–887.10.1016/j.jenvman.2008.02.004
- FAO (Food and Agriculture Organization) 2006. Livestock's long shadow: environmental issues and options. Rome, Italy, FAO. 391 p.
- Granger SJ, Hawkins JMB, Bol R, White SM, Naden P, Old G, et al. 2010. High temporal resolution monitoring of multiple pollutant responses in drainage from an intensively managed grassland catchment caused by a summer storm. Water Air and Soil Pollution 205: 377–393.10.1007/s11270-009-0083-z
- Howard-Williams C, Davies-Colley RJ, Rutherford K, Wilcock RJ 2011. Diffuse pollution and freshwater degradation: New Zealand perspectives. In: van Bochove E, Vanrolleghem PA, Chambers PA, Theriault G, Novotna B, Burkart MR eds. Issues and solutions to diffuse pollution: selected papers from the 14th International Conference of the IWA Diffuse Pollution Specialist Group, DIPCON 2010, Quebec, Canada. Pp 126–140.
- Jones AS, Stevens DK, Horsburgh JS, Mesner NO 2011. Surrogate measures for providing high frequency estimates of total suspended solids and total phosphorus concentrations. Journal of the American Water Resources Association 47: 239–253.10.1111/j.1752-1688.2010.00505.x
- Kato T, Kuroda H, Nakasone H 2009. Runoff characteristics of nutrients from an agricultural watershed with intensive livestock production. Journal of Hydrology 368: 79–87.10.1016/j.jhydrol.2009.01.028
- Kay D, Crowther J, Stapleton CM, Wyer MD, Fewtrell L, Anthony S, et al. 2008. Faecal indicator organism concentrations and catchment export coefficients in the UK. Water Research 42: 2649–2661.10.1016/j.watres.2008.01.017
- Kemp P, Sear D, Collins A, Naden P, Jones I 2011. The impacts of fine sediment on riverine fish. Hydrological Processes 25: 1800–1821.10.1002/hyp.7940
- Kim J, Nagano Y, Furumai H 2012. Runoff load estimation of particulate and dissolved nitrogen in Lake Inba watershed using continuous monitoring data on turbidity and electric conductivity. Water Science and Technology 66: 1015–1021.10.2166/wst.2012.275
- Kirchner JW, Feng X, Neal C, Robson AJ 2004. The fine structure of water-quality dynamics: the (high-frequency) wave of the future. Hydrological Processes 18: 1353–1359.10.1002/hyp.5537
- Leitinger G, Tasser E, Newesely C, Obojes N, Tappeiner U 2010. Seasonal dynamics of surface runoff in mountain grassland ecosystems differing in land use. Journal of Hydrology 385: 95–104.10.1016/j.jhydrol.2010.02.006
- Luz Rodriguez-Blanco M, Mercedes Taboada-Castro M, Teresa Taboada-Castro M, Oropeza-Mota JL 2009. Nutrient dynamics during storm events in an agroforestry catchment. Communications in Soil Science and Plant Analysis 40: 889–900.10.1080/00103620802697921
- McKergow LA, Davies-Colley RJ 2010. Stormflow dynamics and loads of Escherichia coli in a large mixed land use catchment. Hydrological Processes 24: 276–289.
- Melland AR, Mellander PE, Murphy PNC, Wall DP, Mechan S, Shine O, et al. 2012. Stream water quality in intensive cereal cropping catchments with regulated nutrient management. Environmental Science & Policy 24: 58–70.10.1016/j.envsci.2012.06.006
- Ministry for the Environment, Ministry of Health 2003. Microbiological water quality guidelines for marine and freshwater recreational areas. Ministrt for the Environment, Wellington, New Zealand. 159 p.
- Roygard JKF, McArthur KJ, Clark ME 2012. Diffuse contributions dominate over point sources of soluble nutrients in two sub-catchments of the Manawatu River, New Zealand. New Zealand Journal of Marine and Freshwater Research 46: 219–241.10.1080/00288330.2011.632425
- Sasal MC, Castiglioni MG, Wilson MG 2010. Effect of crop sequences on soil properties and runoff on natural-rainfall erosion plots under no tillage. Soil and Tillage Research 108: 24–29.10.1016/j.still.2010.03.010
- Schilling K, Zhang Y-K 2004. Baseflow contribution to nitrate–nitrogen export from a large, agricultural watershed, USA. Journal of Hydrology 295: 305–316.10.1016/j.jhydrol.2004.03.010
- Sharpley AN, Kleinman PJA, Heathwaite AL, Gburek WJ, Folmar GJ, Schmidt JP 2008. Phosphorus loss from an agricultural watershed as a function of storm size. Journal of Environmental Quality 37: 362–368.10.2134/jeq2007.0366
- Stubblefield AP, Reuter JE, Dahlgren RA, Goldman CR 2007. Use of turbidometry to characterize suspended sediment and phosphorus fluxes in the Lake Tahoe basin, California, USA. Hydrological Processes 21: 281–291.10.1002/hyp.6234
- Tomer MD, Meek DW, Kramer LA 2005. Agricultural practices influence flow regimes of headwater streams in Western Iowa. Journal of Environmental Quality 34: 1547–1558.10.2134/jeq2004.0199
- Verburg P, Hamill K, Unwin M, Abell J 2010. Lake water quality in New Zealand 2010: status and trends. NIWA Client Report HAM2010-107 for MfE. Project: OIC10202. NIWA, Hamilton, New Zealand. 53 p.
- Wilcock RJ, Monaghan RM, Thorrold BS, Meredith AS, Betteridge K, Duncan MJ 2007. Land–water interactions in five contrasting dairy catchments: issues and solutions. Land Use and Water Resources Research 7: 2.12.10.
- Wilkinson J, Kay D, Wyer M, Jenkins A 2006. Processes driving the episodic flux of faecal indicator organisms in streams impacting on recreational and shellfish harvesting waters. Water Research 40: 153–161.10.1016/j.watres.2005.11.001
- Wilkinson RJ, McKergow LA, Davies-Colley RJ, Ballantine DJ, Young RG 2011. Modelling storm-event E. coli pulses from the Motueka and Sherry Rivers in the South Island, New Zealand. New Zealand Journal of Marine and Freshwater Research 45: 369–393.10.1080/00288330.2011.592839
- Wood PJ, Armitage PD 1997. Biological effects of fine sediment in the lotic environment. Environmental Management 21: 203–217.10.1007/s002679900019
- Young RG, Quarterman AJ, Eyles RF, Smith RA, Bowden WB 2005. Water quality and thermal regime of the Motueka River: influences of land cover, geology and position in the catchment. New Zealand Journal of Marine and Freshwater Research 39: 803–825.10.1080/00288330.2005.9517354
- Zhang B, Tang JL, Gao C, Zepp H 2011. Subsurface lateral flow from hillslope and its contribution to nitrate loading in streams through an agricultural catchment during subtropical rainstorm events. Hydrology and Earth System Sciences 15: 3153–3170.10.5194/hess-15-3153-2011
- Zhu Q, Schmidt JP, Bryant RB 2012. Hot moments and hot spots of nutrient losses from a mixed land use watershed. Journal of Hydrology 414: 393–404.10.1016/j.jhydrol.2011.11.011
- Zhu Q, Schmidt JP, Buda AR, Bryant RB, Folmar GJ 2011. Nitrogen loss from a mixed land use watershed as influenced by hydrology and seasons. Journal of Hydrology 405: 307–315.