
Abstract
Phytoplankton and environmental variables were studied during a year in a shallow eutrophic lake and its inflow in the ‘depressed Pampa’ of Argentina. The taxa were classified according to the competitors, stress tolerators, ruderals and intermediate categories (CSR) model and were allocated to morpho-functional groups (MFG). As was expected according to the trophic state, scarce transparency and mixing condition, the R-strategists (several cyanobacteria and pennate diatoms) dominated almost all of the study period. C-strategists were more scarce and favoured by short periods of transparency, whereas only three species were attributed to the S-strategist category. Each MFG was represented by a single species at a time, resulting in a high functional miscellany in this shallow lake. Thus, we can assume that the CSR approach is a useful tool to explain the success of the different species of phytoplankton in this shallow lake.
Introduction
In recent decades several studies (Izaguirre et al. Citation1991; Izaguirre & Vinocur Citation1994; Claps et al. Citation2002) have analysed the plankton of San Miguel del Monte Lake, situated in the eastern-central portion of Argentina. The phytoplankton of this shallow lake is typical of a eutrophic-mesotrophic environment (Gabellone & Gomez Citation1998; Gabellone et al. Citation2002) with a dominance of cyanobacteria and chlorophytes (Solari et al. Citation2003). The influence of the Salado River water level on related shallow lakes was described by Gabellone et al. (Citation2001, Citation2002). In their opinion, the variable direction of flow, characteristic of this region of the basin, determines the inputs of inocula from the El Totoral Stream or from the Salado River, into San Miguel del Monte Lake. For this reason, changes in phytoplankton biovolume and abundance over space and time were analysed in three sectors of San Miguel del Monte Lake along the main axis of the lake. The general aim of this investigation is to use the competitors, stress tolerators, ruderals and intermediate categories (CSR) functional classification and the morpho-functional group (MFG) approach in order to interpret the temporal dynamics of phytoplankton considering the influence of the environmental variables, particularly those related to hydrological and meteorological variations relevant at this river-connected lake.
Certain strategic mechanisms of the species of phytoplankton have evolved, each involving adaptations of cell morphology and physiology that equip them to survive under various combinations of low- or high-nutrient conditions and low or high physical disturbance (Reynolds Citation1988a). Salmaso & Padisák (Citation2007) pointed out that phytoplanktonic life strategies are strongly related to an individual's geometrical dimensions and shape, since these morphologic characteristics influence physical and biological properties as different as sinking and growth rates, efficiency of nutrient and light utilisation, and susceptibility to grazing. The resulting classification of such adaptive strategies is then based on the degree of tolerance to environmental conditions and on the species' response to nutrient concentrations and hydraulic disturbances. Reynolds, in turn, identified three primary strategies among phytoplankton species based on Grime's CSR-triangle model for terrestrial plants (Reynolds Citation1988a, Citation1997). The ecological differences among these strategists lie in their degree of tolerance to stress (i.e. S-stress tolerators are adapted to nutrient scarcity) or to disturbance (i.e. R-ruderals support loss of biomass by flushing or destruction by long periods of darkness). C-strategists are characterised by rapid growth under favourable conditions of high nutrient concentration and stratification. Several authors, including Reynolds, have recognised intermediate examples among these three main strategies (Reynolds Citation1988a; Dos Santos & Calijuri Citation1998; Kruk et al. Citation2002; Bonilla et al. Citation2005). The MFG approach, besides morphological characteristics, incorporates other physiological characters and environmental preferences by segregating the species of similar morphology and ecology into 31 morpho-functional groups (Reynolds Citation1997, Citation2006; Reynolds et al. Citation2002; Padisák et al. Citation2009).
In shallow lakes, periodic meteorologic (e.g. rainfalls and storms) and hydrologic events (e.g. floods) cause large temporal and spatial variations in phytoplankton structure and dynamics as a result of changes in nutrient concentrations and transparency which these perturbations may induce (Reynolds Citation1988a; Salmaso Citation2003; Bonilla et al. Citation2005). Many environmental conditions, such as variations in the day length, insolation intensity, temperature, hydraulic resistance to wind mixing and rainfall fluctuate seasonally in temperate lakes, influencing both flushing and nutrient-loading rates (Reynolds Citation1984, Citation1990). This seasonal variability drives the notable periodic variations in the structure of the phytoplankton. Individual species become selected on the basis of their strategic adaptations so that, at any given time, any one of the C-, S-, or R-strategists would be selectively favoured and then become dominant. Constantly mixed nutrient-rich lakes are dominated by R-strategists, while those that alternate between constant mixing and stratification periods would be dominated alternatively by R- or C-strategists (Reynolds Citation1988a). On the other hand, Reynolds et al. (Citation2002) and Padisák et al. (Citation2009) recognised a great number of MFGs (C, D, F, H1, J, K, M, MP, SN, S1, S2, X1 and X2) as characteristic of mixed shallow meso-eutrophic lakes. We therefore expected that in this frequently mixed nutrient-rich shallow lake the R-strategists and some of the above mentioned MFGs, which are favoured by these environmental traits, would predominate almost all of the time.
Materials and methods
San Miguel del Monte is a small shallow lake with an area of 665 ha and a mean depth of about 1.3 m located in the so-called ‘depressed Pampa’ of the lower basin of the Salado River at 35°27′S, 58°48′W (Dangavs Citation1973). The lake receives flow from the El Totoral Stream (21.5 km long) which, in turn, drains an extensive agricultural and cattle-breeding area and has been permanently colonised by submerged, emergent and floating macrophytes. Although the normal outflow of San Miguel del Monte Lake is regulated by a gate, whenever the Salado River overflows this lake receives the river's water from backflow through Las Perdices Lake because of the minimal slope of the terrain (). The lake acts as effluent in December, January, July and August and as influent in June (Claps et al. Citation2004) (). This region has a temperate humid climate with a mean annual precipitation of 890 mm and a mean annual temperature of 15.7 °C (Gabellone et al. Citation2005).
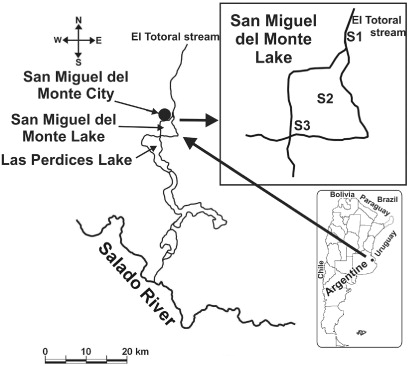
Replicate samples of phytoplankton were collected monthly from September 1997 through August 1998 (except in May, due to flooding of the Salado River). The sampling stations were located in the inflow El Totoral Stream (S1), in the deepest part of the lake (S2) and near the connecting gate with Las Perdices Lake (S3). Water samples for phytoplankton, chlorophyll-a and chemical analyses were taken with a suction pump at all the sampling stations. At S2, samples were obtained at 0.30 m intervals from the bottom to the surface and the 4–6 samples (according to hydrometric level) integrated. At S1 and S3 only subsurface samples were taken. Physical and chemical parameters (pH, temperature, conductivity, dissolved oxygen concentration [DO] and turbidity) were measured in situ with a Horiba U-10 multimeter. Transparency was estimated with a Secchi disk. Chemical analyses were performed following the APHA methods (APHA Citation1995). Soluble reactive phosphorus (SRP) and total phosphorus (TP) were measured by the ascorbic acid method, the latter with a previous acid digestion. Nitrates plus nitrites were determined by the hydrazine reduction procedure. Dissolved polyphenols (DPPs) were measured according to method 5550 B as an estimation of allelopathic substances produced by macrophytes (Gross & Sütfeld Citation1994). Chlorophyll-a and pheopigment concentrations were extracted with 90% acetone and measured spectrophotometrically on Whatmann GF/C filters, the latter after acidification with 0.1N HCl (APHA Citation1995).
The phytoplankton samples were preserved with 1% (w/v) acetic Lugol's iodine solution and algal unit counts performed according to Utermöhl (Citation1958). The organisms (cells, colonies, cenobia and filaments) were enumerated in chambers of 5 or 10 ml that were left for sedimentation for at least 24 h. The diversity of the phytoplankton community was estimated according to the Shannon-Wiener index. A minimum of 10 to 20 individuals of more relevant species were measured to calculate the biovolume (mm3 L−1) by applying the formulas for solid geometric figures according to Lewis (Citation1976), Wetzel & Likens (Citation1991) and Hillebrand et al. (Citation1999). Then, the maximum linear dimension (MLD), surface area (SA) and volume (V) of each taxon were obtained and the ratio of surface area to volume (SA/V) of individual units (cells, filaments or colonies) was calculated.
The taxa were classified according to Reynolds (Citation1988a, Citation1996, Citation1997) into CSR categories, following a deductive approach on the basis of their morphometric characteristics (Salmaso & Padisák Citation2007). The categorisation of strategists was made from a 2-D biplot based on maximum linear dimension and SA/V ratio. Species with a biovolume greater than 20% in any sampling were considered.
We chose to extend the lines drawn by Reynolds (Citation1996) in an attempt to accommodate small taxa not included in Reynolds' scheme. Species that lay near the dividing lines were assigned to the intermediate categories (CR and SR). Each species was assigned to the corresponding MFG according to Padisák et al. (Citation2009) and Reynolds et al. (Citation2002).
Linear methods were chosen because the longest gradient in the detrended correspondence analysis (DCA) performed was lower than three standard errors (ter Braak & Smilauer Citation2002). Therefore, a redundancy analysis (RDA) was performed in order to determine which environmental variables were associated with the occurrence of algal strategies. A subset of variables was chosen by stepwise manual selection, with only significant variables being included; sampling stations were set as supplementary variables. The significance of these environmental variables was evaluated by the Monte Carlo permutation test (499 permutations), and variables were considered to be significant at P < 0.05. The permutations within each sampling station were done considering time series rules. All statistical analyses were carried out with the CANOCO 4.5 software (ter Braak & Smilauer Citation2002).
Results
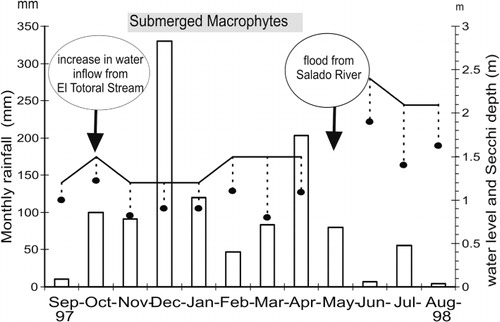
Three main hydrometeorological events occurred at San Miguel del Monte Lake during the study period (September 1997 to August 1998). The first increase in the water level, during October and November, was accompanied by a sudden decrease in conductivity in S1 (the inflow). The second, in December, was an extraordinary peak of local rainfall (330 mm), and the third, in May, produced a backflow of water from Las Perdices Lake through the connecting gate (S3). The development of the submerged macrophyte Stuckenia pectinata (L.) Böerner began in November in a restricted sector and then spread to the whole lake by March. This progressive growth led to an increase in the water transparency (to 0.70 m) by the end of the summer ().
The water of the lake was alkaline (mean pH values 9.2), whereas that of the stream varied from slightly acid to neutral. The maximum conductivity value in the lake was recorded at the beginning of the sampling period (2500 µS cm−1 at both S2 and S3), and then declined towards the end of the study (1210 at S2 and 1410 µS cm−1 at S3). A similar, but more striking, trend was recorded at S1 in the stream (). The mean values for the DO were higher at the sampling sites in the lake than at S1. Nitrates plus nitrites showed a similar trend at the three sampling stations, with some higher values at S3 (November and June). The mean values for the SRP concentration, however, though similar at both S2 and S3, reached more than double at S1. A similar trend was found for the concentrations of DPPs (). Mean temperature values were similar at the three sampling sites () and the temperature profile was almost uniform ().
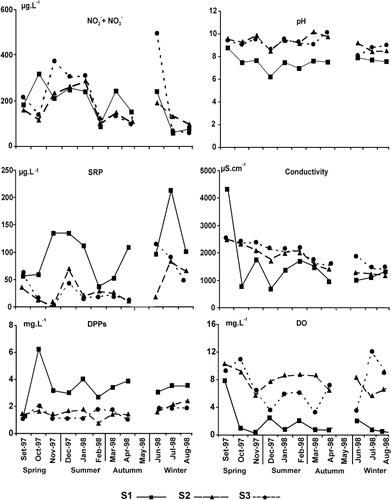
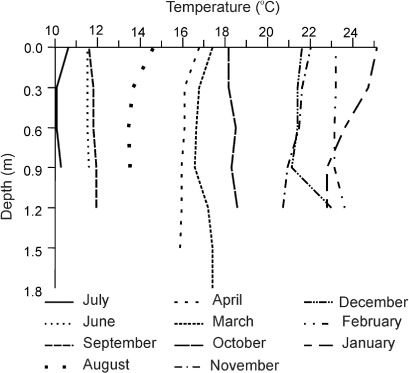
Table 1 Physical, chemical and biological variables at the sampling sites (mean, SD and range).
A total of 267 species were recorded: 47 Cyanobacteria, 102 Chlorophyceae, 70 Bacillariophyceae, 44 Euglenophyceae, two Cryptophyceae and two Dinophyceae. At S2 and S3 the total species richness was high and similar (157 and 141 respectively), whereas S1 had fewer species (87). The maximum phytoplankton density was recorded in March at S3 (92,969 ind ml−1), while the minimum value occurred in April at S1 (1064 ind ml−1). The biovolume ranged between 105.65 (S3, in September) and 0.11 mm3 L−1 (S1, in November). The phytoplankton density and biovolume values were always higher at S2 and S3 than at S1 (). The chlorophyll-a values varied between 219 µg L−1 at S2 (in September) and 6 µg L−1 at S1 (in April), and the species diversity ranged from 1.28 (S3 in October) to 4.45 (S2 in January) with a mean value of 2.96 for the overall shallow lake ().
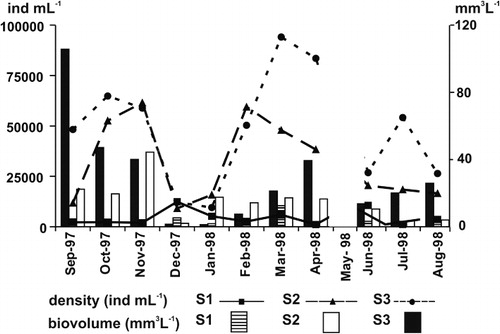
The highest diversity values at S1 were recorded in September (3.70) and the lowest in January (1.42). At the lake stations the higher values were found in January (S2: 4.44, S3: 4.05) following the December peak in local rainfall and in June (S2: 4.45, S3: 3.8) after the May flooding (, ). Cyanobacteria were the dominant group on several occasions, reaching values above 50% of biovolume (). Among filamentous species the most important were Raphidiopsis mediterranea and Oscillatoria tenuis. The former dominated at S2 and S3 in the spring, late summer and autumn, and at S1 at the end of the study period. The latter attained 96% of biovolume in August at S3. Some species (Spirulina abbreviata and Microcystis pseudofilamentosa) were only abundant at S1 during late spring and early summer, respectively, and M. aeruginosa from late summer to autumn. Diatoms occasionally dominated in biovolume, particularly in January, although with some differences in species composition at each sampling station. Cryptophyceae developed at different times, both at the inflow and at the lake stations, with the maximum biovolume (Cryptomonas aff. erosa 56% of biovolume) recorded at S3 in July. Euglenophyceae accounted for 36% of biovolume in September at S2 ().
Life strategies and morpho-functional groups
Most taxa were R-strategists (ruderals) and C-strategists (competitors), and only three species were attributed as S-strategists (stress tolerators) (). Several taxa fell into an intermediate zone, not clearly delimited in the literature. For example, species such as Cyclotella glomerata, Chlamydomonas sp.1, Crucigenia tetrapedia and Chlorella vulgaris were grouped into the category CR (). Other species, such as Navicula radiosa and Coelospherium kuetzingianum, were grouped into the category RS because they fell on the borderline.
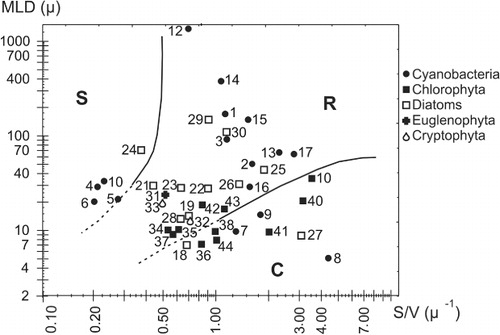
Table 2 Main phytoplankton species of San Miguel del Monte Lake placed into functional groups following Reynolds et al (Citation2002) and Padisák et al. (Citation2009).
R-strategist and RS-strategist
The R-strategist group was the most important during this study, both in absolute and relative terms. After the increase in water inflow from El Totoral Stream (October–November) the R-strategists were favoured and the highest biomass of phytoplankton was directly related to their dominance during spring at S2 and S3. At S1 the R-strategists Nodularia spumigena, Spirulina abbreviata, Planothidium lanceolatum and Cryptomonas aff. erosa along with the RS-strategist C. kuetzingianum, prevailed, but their proliferation was restricted to the first sampling month. At lake stations, the dominance of R-strategists was longer and they reached a maximum biovolume during November (S2: 42 mm3 L−1) and September (S3: 105 mm3 L−1) (). These R-strategists were Raphidiopsis mediterranea, Nodularia spumigena and Euglena spp. at S2 and S3, plus Anabaena aphanizomenoides at S2 ().
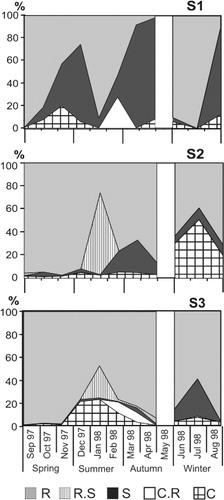
During summer several R-strategist diatoms codominated along with some RS-strategist diatoms. Especially in January, the RS-strategist N. radiosa reached a biovolume of almost 70% at S2 and 28% at S3, with other diatoms likewise categorised as R-strategists (Cyclotella meneghiniana at S2 and Navicula mutica and Nitzschia acicularis at S3) as codominants.
After the May flooding of the Salado River, the R-strategists R. mediterranea and Cryptomonas aff. erosa became dominant only at S1 (at a > 90% of the total biovolume in June). The R-strategists C. meneghiniana, C. aff. erosa, Epithemia sorex and Entomoneis alata also proliferated during that season at S2 and S3 (, ).
C- and CR-strategists
At different times of the year the C-strategists (especially Monoraphidium minutum) proliferated during short periods, coinciding with increases in the SRP concentration. Nevertheless, these C-strategist peaks did not occur coincidentally at all sampling stations. At S2 the C-strategists were prevalent during winter whereas this was the case at S3 by early summer. During late summer, with lower SRP concentrations, the CR-strategists reached their maximum biovolume percentage (, ).
S-Strategist
Only three species corresponded to the category S (Microcystis aeruginosa, Aphanocapsa delicatissima and Chroococcus dispersus). The S-strategists reached their higher values at S1 in early and late summer and were mainly represented by M. pseudofilamentosa (3.4 mg L−1) and M. aeruginosa (11.15 mg L−1) respectively (at 88% of the total biovolume) (, ). In all instances the colonies found during the sampling study were of small size () compared to the biovolumes generally recorded in shallow lakes.
Morpho-functional groups
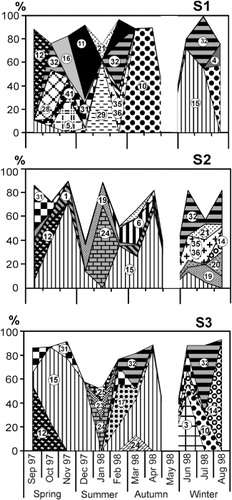
Considering the MFG, we found a high functional miscellany in this shallow lake. At every sampling occasion, each functional group found was represented by only one species (, ).
Statistical analysis
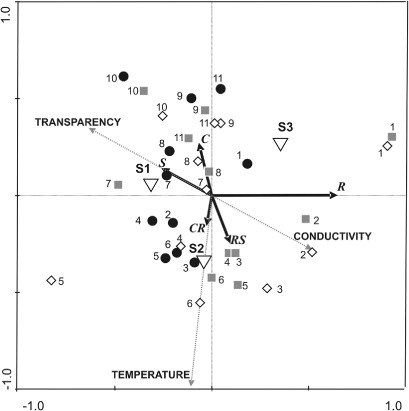
Ordination of the plankton assemblages indicated a pattern of algal strategies related to changes in the selected environmental variables. The significant variables according to the Monte Carlo test were transparency (F = 6.218, P = 0.022), conductivity (F = 6.69, P = 0.016) and temperature (F = 4.735, P = 0.038). At the beginning of the study period, the dominance of the R-strategists was related to the low transparency and high conductivity levels. As the temperature increased the R-strategists diminished and the strategies became diversified, but none of the strategic groups predominated. From March onwards the transparency increased and the prevalence of the C-strategists at that time appeared to be related to the change in this condition ().
Discussion
Environmental perturbations have been shown to produce changes in plankton community structure (Reynolds et al. Citation1993; Barbiero et al. Citation1999). Furthermore, phytoplankton strategies are most likely a response to environmental conditions such as nutrient concentrations and hydraulic disturbances (Reynolds Citation1988a).
Two conditions contribute to promote a hydrodynamically unstable environment in San Miguel del Monte Lake. First, the lake is shallow and is therefore easily mixed by the wind (Dangavs Citation1973), especially during the cooler months. Second, the connection with the Salado River can cause instability due to unpredictable flooding which does not follow a seasonal pattern (Gabellone et al. Citation2003; Solari & Mac Donagh Citation2014). These characteristics would contribute to prevent the development of an autogenic succession from the C-strategists to the S-strategists and would favour the R-strategist (Reynolds Citation1982, Citation1984, Citation1988a). In line with these results, in a coastal lagoon, Bonilla et al. (Citation2005) found that pronounced and frequent changes in the physical conditions related to periods of high hydrologic connectivity favoured the development of C- and R-strategists. On the other hand, Unrein et al. (Citation2010) found that the development of S-strategist (as N-fixing cyanobacteria) was favoured in a river-connected lake characterised by a long isolation time that allowed the succession. The frequent mixing of the water column in San Miguel del Monte Lake favoured the R-strategists which predominated almost all of the time. Among these strategists we found alternately filamentous cyanobacteria and pennate diatoms, as shown in Ryan et al. (Citation2006), which highlights the predominating effect of frequent mixing over other environmental factors in selecting these phytoplankton groups. As a result of their elongated shape and high SA/V ratio (Scheffer Citation1998; Havens et al. Citation1998; Naselli-Flores et al. Citation2007; Stanca et al. Citation2013), these strategists take advantage of the well mixed water column and scarce light conditions prevailing during periods of high turbidity (Reynolds Citation1988a, Citation1997, Citation2006). Diatoms could arise from the sediments and the periphyton of submerged macrophytes and then be kept in suspension by the movements of the water. Furthermore, the development of those macrophytes produced a diversification of strategies as a result of the contribution of tychoplanktonic diatoms such as N. radiosa (RS-strategist), Nitzschia romana (C-strategist) and Nitzschia palea (R-strategist).
The water backflow from Las Perdices Lake through the gate as a result of the Salado-River floodings favoured the entrance of an inoculum of Cryptomonas spp. populations which were abundant in the Salado River by this time (Neschuck et al. Citation2002). The Cryptophyceae have been characterised by their ability to withstand dilution effects during flood pulses of rivers and to tolerate variable conditions of mixing intensity and light climate, achieving high density populations at flooding areas (García de Emiliani & Devercelli Citation2003). They have also been shown to be characteristic of turbulent environments (Dokulil Citation1984; Reynolds Citation1988a,Citationb; Barbiero et al. Citation1999). Cryptomonas spp. and Oscillatoria tenuis–likewise both R-strategists–were favoured by that flooding and were prevalent in winter, probably outcompeting other species on the basis of their superior light-harvesting properties and high photosynthetic efficiencies (Reynolds Citation1988b).
The hydraulic disturbances that occurred adversely affected the largest colonial cyanobacteria (i.e. S-strategists), since this group is known for its inability to grow in turbulent or frequently mixed systems (Garnier et al. Citation1995). The failure to find algae with a low SA/V ratio could be interpreted as indicating that the prevailing environmental conditions were unfavourable for the S-strategists in this lake, due to frequent disturbances and low grazing pressure. According to Claps et al. (Citation2004), the zooplankton biomass of this shallow lake (mainly attributable to small Cladocera and Copepoda) was found to be positively correlated with chlorophyll-a concentrations. Even the colonies of the cyanobacteria, such as Microcystis aeruginosa and Chroococcus dispersus found during this study had an SA/V ratio in the range of 0.20 to 0.23 µm−1 whereas, according to the literature, large colonies of M. aeruginosa can usually attain SA/V ratios of around 0.03 µm−1 (Reynolds Citation1984, Citation1988a). Accordingly, in our biplot of life strategies, the high proportion of species of very small size (MLD between 7 and 15 µm and an SA/V ratio between 0.2 and 1 µm−1) is notable. It is likely these algae of small size found a favourable environment in the lake, at least for short periods, after the disturbances (Happey-Wood Citation1988).
The S-strategists M. aeruginosa and M. pseudofilamentosa were recorded mainly in the inflow stream–probably because of the high input of organic matter washed in from the basin but not as a result of stress from nutritional limitation. The high DPPs concentration recorded at S1 could also have acted as a stress factor for phytoplankton development (Gross & Sütfeld Citation1994). In addition to these S-strategists characteristic of S1, we found several species tolerant to stress conditions that were not included among the S-strategists by morphological criteria–Synechococcus elongatus and Spirulina abbreviata–which, due to their small size and low SA/V ratio, could be categorised as C- and R-strategists, respectively. Nevertheless, these algae had been described as tolerant to water polluted with organic matter (Geitler Citation1932; Kómárek & Anagnostidis Citation2005).
Since the environmental conditions favoured the R-strategists almost all of the time, and because that group tolerates its own shading effect, the C-strategists' development was probably limited because of their high light requirements (Happey-Wood Citation1988; Reynolds Citation1997). C-strategists were scarce, though the RDA revealed that they were probably favoured by the short period of transparency increase and the lower conductivities and temperatures. In agreement with Melo & Huszar (Citation2000), the scarcity of S-strategists and the dominance of mixing-dependent species (R-strategists) and of flushing-tolerant invasive nano-algae (C-strategists) could show that environmental physical properties are the strongest determinants of the phytoplankton dynamics in shallow and high-flushing lakes in detriment of grazing or nutrient effects.
According to the RDA presented here, transparency and conductivity were the two variables that best explained the life-strategy variations in this lake. The former could be related to biological influences since transparency is directly conditioned by phytoplanktonic density and indirectly promoted by macrophyte development. Even though the extent of macrophyte cover throughout the study period was not measured, the spatial ordination of the samples in the RDA indicated an environmental shift between the conditions prior to and following the development of macrophytes during the summer. Similar trends have been recorded in another shallow lake of the region, where short periods of macrophyte development induced changes in phytoplankton composition that continued after an environmental shift, whether the high biomass of macrophytes persisted or not (Cano et al. Citation2008; Casco et al. Citation2009). The second variable distinguished by the analysis–conductivity–indicated that the changes in that variable resulting from the inflow of water from different sources played a key role in determining the structure of the phytoplankton community.
The heavy rainfall of December and the flooding in May could be interpreted as disturbances because of the unpredictability involved, since those perturbations caused abrupt differences in the species composition (Flöder & Sommer Citation1999). The highest values of species diversity at the lake sampling stations were registered after the occurrence of those principal disturbances. However, the higher diversities observed after the flooding event could be the result of the entrance of inocula from other aquatic systems (Devercelli & O'Farrell Citation2013) and the possibility of a coexistence of species with different strategists during these periods. In contrast, the water inflow from S1 in October did not affect the diversity of the phytoplankton at the lake stations, probably related to the small catchment that this inflow drains, in comparison with that of the Salado River. These results agree with the proposal of Ward & Tockner (Citation2001) that, in the lentic patches located within river corridors, species diversity would be at a maximum when those areas became connected with other ecosystems through some intermediate level of hydrologic disturbance.
A high functional diversity in this shallow lake was found according to the MFG of Reynolds et al. (Citation2002). The main species found at the different sampling dates belong to different functional groups; thus, we do not believe that, in this case, this approach can be conveniently applied as a way of simplifying phytoplankton patterns. Instead, it could be useful in order to recognise the most important ecological traits in this lake. The environment characteristics preferred by several groups are the mixing of the water column (S1, SN, F, J and MP), the meso or eutrophic conditions (X1, X2, F, J, K, H1 and M) and the turbidity of water (D, MP, S1). A few groups are related to particular environmental traits, such as high organic matter concentration (W1) and alkalinity (S2). On the other hand, group Y can be found under a broad range of environmental conditions and, as such, cannot be used in order to characterise the environment (Reynolds et al. Citation2002; Padisák et al. Citation2009).
According to the limiting concentrations established by Reynolds (Citation2006) DRP was below 6 ug L−1 only in November at S2 and S3 while nitrogen concentrations were under 100 ug L−1 at the end of the study period (July S1, August S1 and S2). However, as ammonia concentrations were not measured, the fact that environmental nitrogen concentration was really limiting cannot be confirmed. Nitrogen-fixing cyanobacteria were recorded at the onset of the study period at the three stations, but did not persist beyond October. This fact could be related to the low Secchi values by this time, and to the depletion of DRP in November (S2 and S1). Nitrogen-fixing cyanobacteria require good light availability and high phosphorus concentrations due to their elevated metabolic cost. Furthermore, their growth can be inhibited by mixing, as was explained by de Tezanos Pinto & Litchman (Citation2010). In agreement with Izaguirre et al. (Citation2012), heterocysts in the filamentous dominant Raphidiopsis mediterranea were not observed, probably because its nitrogen requirements were satisfied.
Biological influences, such as macrophyte colonisation, affect the proportion of different life strategists because they create new conditions that indirectly influence the composition of the phytoplankton (Scheffer Citation1998). It is likely that many factors, such as the presence of submerged macrophytes and periphitic algae, inocula and water inputs, or changes in conductivity, contributed to the different assortments of life strategists and MFGs observed during this study. Moreover, according to the nature of the disturbance, different life strategies were favoured during short periods after each of the hydrometeorological events. Therefore, their influence in the phytoplankton structure cannot be generalised.
Acknowledgements
The authors wish to thank Dr Judit Padisák and Dr Colin Reynolds for their helpful suggestions about the selection of strategies and to the anonymous reviewers for their valuable comments on the manuscript. Also, we want to thank Monica Caviglia for the last English revision and Dr Donald F. Haggerty, a retired career investigator and native English speaker, for editing the manuscript. We are furthermore grateful to Dr N. Castillo for her collaboration with the phytoplankton counts. This work was partially supported by the FONCyT, CONICET and Universidad Nacional de La Plata. Graduate G. Ruiz and Dr K. Quaíni had fellowships from the National Council of Sciences and Technology (CONICET) and from the Argentine Agency for Science and Technology Promotion (ANPCyT), respectively. Scientific contribution number 942 from Instituto de Limnología ‘Dr R. Ringuelet’.
References
- APHA 1995. Standard methods for the examination of waters and wastewaters. 19th edition. Washington, DC, APHA/AWWA/WPCF.
- Barbiero RP, James WF, Barko JW 1999. The effect of disturbance on phytoplankton community structure in a small temperate reservoir. Freshwater Biology 42: 503–512.10.1046/j.1365-2427.1999.00491.x
- Bonilla S, Conde D, Aubriot L, Pérez MC 2005. Influence of hydrology on phytoplankton species composition and life strategies in a subtropical coastal lagoon periodically connected with the Atlantic Ocean. Estuaries 28: 884–895.10.1007/BF02696017
- Cano MG, Casco MA, Solari LC, Mac Donagh ME, Gabellone NA, Claps MC 2008. Implications of rapid changes in chlorophyll-a of plankton, epipelon and epiphyton in a Pampean shallow lake: an interpretation in terms of a conceptual model. Hydrobiologia 614: 33–45.10.1007/s10750-008-9534-6
- Casco MA, Mac Donagh ME, Cano MG, Solari LC, Claps MC, Gabellone NA 2009. Phytoplankton and epipelon response to turbid and clear phases in a seepage lake (Buenos Aires, Argentina). International Review of Hydrobiology 94: 153–168.10.1002/iroh.200711036
- Claps MC, Benítez HH, Gabellone NA 2002. Vertical distribution of zooplankton in a pampasic shallow lake (Argentina). Verhandlungen Internationale Vereinigung für Theoretische und Angewandte Limnologie 28: 1032–1036.
- Claps MC, Gabellone NA, Benítez HH 2004. Zooplankton biomass in a eutrophic shallow lake (Buenos Aires, Argentina): spatio-temporal variations. Annales de Limnologie - International Journal of Limnology 40: 201–210.10.1051/limn/2004018
- Dangavs NV 1973. Estudios geológicos en la laguna San Miguel del Monte. Revista del Museo de La Plata 8: 1–313.
- de Melo S, Huszar VLM 2000. Phytoplankton in an Amazonian flood-plain lake (Lago Batata, Brasil): diel variation and species strategies. Journal of Plankton Research. 22(1): 63–76.10.1007/s10750-009-0014-4
- de Tezanos Pinto P, Litchman E 2010. Eco-physiological responses of nitrogen-fixing cyanobacteria to light. Hydrobiologia 639: 63–68.10.1007/s10750-009-0014-4
- Devercelli M, O'Farrell I 2013. Factors affecting the structure and maintenance of phytoplankton functional groups in a nutrient rich lowland river. Limnologica 43: 67–78.10.1016/j.limno.2012.05.001
- Dokulil M 1984. Assessment of components controlling phytoplankton photosynthesis and bacterioplankton production in a shallow, alkaline, turbid lake (Neusiedlersee, Austria). Internationale Revue gesamten Hydrobiologie 69: 679–727.10.1002/iroh.19840690506
- Dos Santos ACA, Calijuri MC 1998. Survival strategies of some species of the phytoplankton community in the Barra Bonita Reservoir (Sao Paulo, Brazil). Hydrobiologia 367: 139–152.10.1023/A:1003276016149
- Flöder S, Sommer U 1999. Diversity in planktonic communities: an experimental test of the intermediate disturbance hypothesis. Limnology and Oceanography 44: 1114–1119.10.4319/lo.1999.44.4.1114
- Gabellone NA, Gomez N 1998. Diatoms and phosphorus fractions in recent sediments of San Miguel del Monte Pond (Argentina). Verhandlungen Internationale Vereinigung für Theoretische und Angewandte Limnologie 26: 1552–1555.
- Gabellone NA, Solari LC, Claps MC 2001. Planktonic and physico-chemical dynamics of a markedly fluctuating backwater pond associated with a lowland river (Salado River, Buenos Aires, Argentina). Lakes & Reservoirs: Research and Management 6: 133–142.10.1046/j.1440-1770.2001.00130.x
- Gabellone NA, Solari LC, Ardohain M 2002. Changes of the trophic status of a pampean shallow lake: causes and consequences. Verhandlungen Internationale Vereinigung für Theoretische und Angewandte Limnologie 28: 1626–1630.
- Gabellone NA, Sarandón R, Claps MC 2003. Caracterización y zonificación ecológica de la Cuenca del Río Salado. In: Maiola OC, Gabellone NA, Hernández MA eds. Inundaciones en la región pampeana. La Plata, Edulp, Editorial de la National University of La Plata. Pp. 87–123.
- Gabellone NA, Claps C, Solari L, Neschuk N 2005. Nutrients, conductivity and plankton in a landscape approach to a Pampean saline lowland river (Salado River, Argentina). Biogeochemistry 75: 455–477.10.1007/s10533-005-3273-9
- García de Emiliani MO, Devercelli M 2003. Influencia del fenómeno “El Niño” sobre el transporte y la estructura del fitoplancton en el cauce principal del río Paraná Medio, Argentina. Boletín de la Sociedad Argentina de Botánica 38: 29–38.
- Garnier J, Billen G, Coste M 1995. Seasonal succession of diatoms and Chlorophyceae in the drainage network of the Seine River: observations and modeling. Limnology and Oceanography 40: 750–765.10.4319/lo.1995.40.4.0750
- Geitler L 1932. Cyanophyceae. In Kryptogamen-Flora von Deutchland, Oesterreichs und der Schweiz (Ed: Rabenhorst, P.) Leipzig: Akademische Verlagsgesellschaft 14: 1–1196.
- Gross EM, Sütfeld R 1994. Polyphenols with algicidal activity in the submerged macrophyte Myriophyllum spicatum L. Acta Horticulturae 381: 710–714.
- Happey-Wood CM 1988. Ecology of freshwater planktonic green algae. In: Sandgren CD ed. Cambridge, Cambridge University Press. Pp. 175–226.
- Havens KE, Phlips EJ, Cichra MF, Li B-L 1998. Light availability as a possible regulator of cyanobacteria species composition in a shallow subtropical lake. Freshwater Biology 39: 547–556.10.1046/j.1365-2427.1998.00308.x
- Hillebrand H, Dürselen C-D, Kirschtel D, Pillingher U, Zohary T 1999. Biovolume calculation for pelagic and benthic microalgae. Journal of Phycolgy 35: 403–424.10.1046/j.1529-8817.1999.3520403.x
- Izaguirre IA, Vinocur A, O'Farell I 1991. Nuevos aportes a la ficoflora Argentina. I. Cuenca del río Salado (Pcia. Buenos Aires). Boletín de la Sociedad Argentina de Botánica 27: 183–199.
- Izaguirre IA, Vinocur A 1994. Typology of shallow lakes of Salado river basin (Argentina) based on phytoplankton communities. Hydrobiologia 277: 49–62.10.1007/BF00023985
- Izaguirre I, Allende L, Escaray R, Bustingorry J, Pérez G, Tell G 2012. Comparison of morpho-functional phytoplankton classification in human-impacted shallow lakes with different stable states. Hydrobiologia 698: 203–216.10.1007/s10750-012-1069-1
- Kómárek J, Anagnostidis K 2005. Cyanoprokariota. Teil 2: Oscillatoriales. In: Büdel B, Krienitz L, Gärtner G, Schagerl M eds. Süßwasserflora von Mitteleuropa. Munich, Germany, Spektrum Akademischer Verlag. 759 p.
- Kruk C, Mazzeo N, Lacerot G, Reynolds CS 2002. Classification schemes for phytoplankton: a local validation of a functional approach to the analysis of species temporal replacement. Journal of Plankton Research 24: 901–91.10.1093/plankt/24.9.901
- Lewis WM 1976. Surface/volume ratio: implications for phytoplankton morphology. Science 192: 885–887.10.1126/science.192.4242.885
- Naselli-Flores L, Padisák J, Albay M 2007. Shape and size in phytoplankton ecology: do they matter?Hydrobiologia 578: 157–161.10.1007/s10750-006-2815-z
- Neschuck N, Gabellone N, Solari L 2002. Plankton characterization of a lowland river (Salado River, Argentina). Verhandlungen Internationale Vereinigung für Theoretische und Angewandte Limnologie 28: 1336–1339.
- Padisák J, Crossetti LO, Naselli-Flores L 2009. Use and misuse in the application of the phytoplankton functional classification: a critical review with updates. Hydrobiologia 621: 1–19.10.1007/s10750-008-9645-0
- Reynolds CS 1982. Phytoplankton periodicity: its motivation, mechanism and manipulation. Representative Freshwater Biological Association 50: 60–75.
- Reynolds CS 1984. The ecology of freshwater phytoplankton. Cambridge, Cambridge University Press.384 p.
- Reynolds CS 1988a. Functional morphology and the adaptive strategies of freshwater phytoplankton. In: Sandgren CD ed. Growth and reproductive strategies of freshwater phytoplankton. Cambridge, Cambridge University Press. Pp. 388–433.
- Reynolds CS 1988b. The concept of ecological succession applied to seasonal periodicity of freshwater phytoplankton. Verhandlungen Internationale Vereinigung für Theoretische und Angewandte Limnologie 23: 683–691.
- Reynolds CS 1990. Temporal scales of variability in pelagic environments and the response of phytoplankton. Freshwater Biology 23: 25–53.10.1111/j.1365-2427.1990.tb00252.x
- Reynolds CS, Padisák J, Sommer U 1993. Intermediate disturbance in the ecology of phytoplankton and the maintenance of species diversity: a synthesis. Hydrobiologia 249: 183–188.10.1007/BF00008853
- Reynolds CS 1996. The plant life of the pelagic. Verhandlungen Internationale Vereinigung für Theoretische und Angewandte Limnologie 26: 97–113.
- Reynolds CS 1997. Vegetations processes in the pelagic: a model for ecosystem theory. In: Kinne O ed. Excellence in ecology. Oldendorf/Luhe, Germany, Ecology Institute. 371 p.
- Reynolds CS, Huszar V, Kruk C, Naselli-Flores L, Melo S 2002. Towards a functional classification of the freshwater phytoplankton. Journal of Plankton Research 24: 417–428.10.1093/plankt/24.5.417
- Reynolds CS 2006. The ecology of phytoplankton. New York, Cambridge University Press. 535 p.
- Ryan EF, Duggan IC, Hamilton DP, Burger DF 2006. Phytoplankton assemblages in North Island lakes of New Zealand: is trophic state, mixing, or light climate more important? New Zealand Journal of Marine and Freshwater Research 40: 389–398.10.1080/00288330.2006.9517430
- Salmaso N 2003. Life strategies, dominance patterns and mechanisms promoting species coexistence in phytoplankton communities along complex environmental gradients. Hydrobiologia 502: 13–26.10.1023/B:HYDR.0000004267.64870.85
- Salmaso N, Padisák J 2007. Morpho-functional groups and phytoplankton development in two deep lakes (Lake Garda, Italy and Lake Stechlin, Germany). Hydrobiologia 578: 97–112.10.1007/s10750-006-0437-0
- Scheffer M 1998. Ecology of shallow lakes. London, Chapman and Hall. 357 p.
- Solari LC, Mac Donagh ME 2014. Lotic and lentic environments of the Pampean Plain. In: Tell G, Izaguirre I, O'Farrell I eds. Freshwater phytoplankton from Argentina. Advances in Limnology. 65: 143–165.
- Solari LC, Gabellone NA, Mac Donagh ME, Ruiz GC 2003. Estructura y dinámica del fitoplancton en la cuenca de una laguna pampásica (San Miguel del Monte, Buenos Aires, Argentina). Boletín de la Sociedad Argentina de Botánica 38: 65–73.
- Stanca E, Cellamare M, Basset A 2013. Geometric shape as a trait to study phytoplankton distributions in aquatic ecosystems. Hydrobiologia 701: 99–116.10.1007/s10750-012-1262-2
- ter Braak CJE, Smilauer P 2002. CANOCO Reference Manual and Cano Draw for Windows user's guide. Software for canonical community ordination (version 4.5). Ithaca, NY, Microcomputer Power. 499 p.
- Unrein F, O'Farrell I, Izaguirre I, Sinistro R, dos Santos Afonso M, Tell G 2010. Phytoplankton response to pH rise in a N-limited floodplain lake: relevance of N2-fixing heterocystous cyanobacteria. Aquatic Sciences. 72: 179–190.
- Utermöhl H 1958. Zür Vervolkommung der quantitativen Phytoplankton-Methodik. Mitteilungen Internationale Vereinigung für Theoretische und Angewandte Limnologie 9: 1–38.
- Ward JV, Tockner K 2001. Biodiversity: towards a unifying theme for river ecology. Freshwater Biology 46: 807–819.10.1046/j.1365-2427.2001.00713.x
- Wetzel RG, Likens GE 1991. Limnological analyses. 2nd edition. New York, Springer-Verlag. 391 p.