
Abstract
It is generally believed that size grading in a fish farm improves the total biomass output, because it will minimise the stress imposed by larger individuals over small individuals, resulting in higher feed intake and growth rate. The objective of this study was to evaluate the effect of size grading on individual growth performance of yellow New Zealand shortfin eel (Anguilla australis). A 109 day trial was conducted in a recirculation aquaculture system (RAS) with 103 eels of similar initial weight (101 ± 12 g). All eels were individually marked by PIT (passive integrated transponder) tags. On day 42, eels were graded to establish the following groups: only small eels (S-graded ≤ 135 g), only large eels (L-graded > 135 g), and small and large eels together (S-ungraded and L-ungraded). The large eels showed better specific growth rate (SGR), feed intake (FI) and feed conversion ratio (FCR) than the small eels. Nevertheless, no significant differences were found either between L-graded and L-ungraded or between S-graded and S-ungraded. The age of eels was not significantly different between groups. These findings suggest that the individual growth rate performance of the eels is not primarily a consequence of social interaction among tank-mates.
Introduction
Variation in individual growth rate within a fish stock is a common and significant obstacle to profitable management in commercial fish culture (Jobling Citation1985; Knights Citation1987; Barki et al. Citation2000; Benhaïm et al. Citation2011). This differential growth rate produces a heterogeneous fish size population which makes feeding and harvesting operation difficult in the fish farm setting. In order to minimise the size heterogeneity, it is common practice to grade the cultured species into more homogeneous groups several times during their production cycle (Conte Citation2004). Size grading enables each graded group of fish to be fed with the optimum ration and pellet size, and to avoid aggressive behaviour such as bullying, tail and fin nipping and, sometimes, cannibalism (Wallace & Kolbeinshavn Citation1988; Shepherd & Bromage Citation1992). Furthermore, it is generally believed that size grading improves the total biomass output of the cultured species (Baardvik & Jobling Citation1990; Lambert & Dutil Citation2001; Martins et al. Citation2006).
Fish growth heterogeneity is induced by inherent (genetic) or imposed (environmental) factors (Kestemont et al. Citation2003; Sloman Citation2007). Among the imposed factors, social interaction has been identified as the main factor responsible for the growth variation observed in cultured fish (Metcalfe Citation1986; Metcalfe et al. Citation1989; Johnsson Citation1997; Martins et al. Citation2005). Several studies have identified the establishment of social hierarchies among tank-mates, where the larger fish are usually considered the dominant fish, having a suppressive effect on the feed intake and growth of the smaller fish (Gunnes Citation1976; McIntyre et al. Citation1979; Koebele Citation1985; Cutts et al. Citation1998; Seppä et al. Citation1999).
It is expected that size grading will have a beneficial effect on the growth of small individuals. Grading by size should minimise the stress imposed by the larger individuals over small individuals, resulting in a higher feed intake by the smaller specimens and, consequently, a higher growth rate and total biomass output. Nevertheless, studies testing this assumption have not reached consensus. A number of studies have shown a positive effect of size grading on the growth of small fish (Gunnes Citation1976; Jobling & Reisner Citation1987; Seppä et al. Citation1999; Dou et al. Citation2004). However, several other studies do not support the notion of a positive effect on growth (Wallace & Kolbeinshavn Citation1988; Baardvik & Jobling Citation1990; Carmichael Citation1994; Sunde et al. Citation1998; Stefánsson et al. Citation2000; Martins et al. Citation2005; Salas-Leiton et al. Citation2010; Benhaïm et al. Citation2011).
Among the cultured fish species, eels are known to have one of the highest variations in individual growth rates (Koops & Kuhlman Citation1979; Seymour Citation1984). Likewise, the development of hierarchies and aggressive behaviour among tank-mates has been well established for eels (Peters et al. Citation1980; Wickins Citation1985, Citation1987; Knights Citation1987). A few laboratory studies have concluded that size grading increases the biomass of European eels (Anguilla anguilla) during their glass-eel and elver stages (Yahyaoui Citation1988; Appelbaum & Birkan Citation1992). However, studies on the effect of grading on larger eels are limited to the Kamstra (Citation1993) publication. This author worked with marked European eels over 26 g and found that size grading did not have a significant effect on total biomass output or size frequency distribution.
The aim of the present study was to evaluate the effect of size grading on individual growth performance during the yellow stage of New Zealand shortfin eel (A. australis). The hypothesis that small-size eels can improve their growth rate in the absence of large-size eels was tested.
Materials and methods
Fish and maintenance
Eels were collected with a fyke net from Lake Waikare (37°26′29″S, 175°11′56″E), North Island, New Zealand in October 2008, and transported by road (1.5 h) to AUT's laboratory in Auckland. On arrival, the eels were transferred to holding tanks connected to freshwater recirculation modules.
The fish were acclimated to the recirculation system environment for a period of 7 days. During this period, all eel specimens were individually marked with Zoodiac PIT (passive integrated transponder) tags (Hallprint, Hindmarsh Valley, Australia). The fish tagging was performed as indicated in Hirt-Chabbert & Young (Citation2012). All eel experimental procedures were conducted in compliance with the Code of Ethical Conduct for the use of animals for teaching and research of the University of Auckland.
The eels were maintained under a 12 h light:12 h dark regime, and each tank was covered with a black shade cloth to reduce light intensity. Water flow was 3 to 5 L min−1 for all tanks, with constant aeration. Water temperature was increased gradually from 16 °C to 25.5 °C, and then maintained at 25.5 ± 1.6 °C. The pH and dissolved oxygen were monitored with a Portable Multimeter 340i (Wissenschaftlich Technische Werkstätten, Wheilheim, Germany), and maintained at 7.2 ± 0.3 and 6 to 8 mg L−1 (70% to 100% saturation) respectively. The concentrations of total ammonia (NH3 and NH4 + ≤ 0.5 mg L−1), nitrite (NO2 − ≤ 0.5 mg L−1) and nitrate (NO3 − ≤ 40 mg L−1) were tested with an Aquarium Pharmaceuticals API Water Test Kit (Chalfont, Pennsylvania, USA). Temperature, oxygen and ammonia concentrations were recorded daily and nitrate, nitrite and pH were monitored weekly.
Experimental procedures
Once the eels were acclimated to the new environment, a total of 103 eels of relatively uniform weight (101 ± 12 g, mean ± SD) were selected from the holding tanks, and distributed uniformly among eight 160 L rearing tanks (day 0). They were initially fed hoki (Macruronus novaezelandiae) roe, which was progressively replaced by a grow-out extruded feed (47% protein, 26% fat) such that after three weeks only pellets were provided. Eels were fed to apparent satiation twice daily from Monday to Friday, and once a day on weekends. Tanks were checked daily for dead or moribund fish. If any were found, they were removed and recorded as a death.
After 1 month, the eel stock presented two groups clearly defined by simple visual observation: large eels (specimens that had increased their body weight visibly) and small eels (specimens that had kept approximately their original body weight). On day 42 all eels were anaesthetised with benzocaine (100 mg L−1), and manually graded into three experimental groups by weight: (1) S-graded, a relatively homogeneous group of small eels (n = 21 eels, ≤ 135 g); (2) L-graded, a relatively homogeneous group of large eels (n = 32 eels, > 135 g); and (3) Ungraded, a relatively heterogeneous group of small and large eels (n = 19 eels ≤ 135 g and n = 31 large eels > 135 g). This last group was then analysed as two separate subgroups: (a) S-ungraded, comprised of the small individuals; and (b) L-ungraded, comprised of the large individuals.
Each of these new experimental groups was distributed uniformly within three tanks and reared for 67 more days. The stocking density for these tanks ranged from 12 to 15 kg m−3. Because of the smaller biomass in the S-graded tanks, the water volume was reduced to 60 L in each of these tanks, to have a similar stocking density to the L-graded and Ungraded groups. At the end of the trial, eel were killed by an overdose of benzocaine and kept frozen for posterior analysis of age.
Monitoring schedule and growth parameters
At days 0, 21, 42, 67, 88 and 109 the eels were anaesthetised and individual weight (BW, g) and total length (TL, mm) were recorded. Fish were not fed the day before and after handling.
The following parameters were calculated:
BG, FI and, consequently, FCR were calculated from day 42 (size grading event) to day 109. It was not possible to separately record the FI by S-ungraded and L-ungraded fish because they were reared together in the same tanks. However, for graded eels, the FI and FCR were analysed separately.
Age analysis
Both otoliths were removed, washed and cleaned in water, dried and stored in culture plates. A single otolith was weighed to the nearest 0.0001 mg and subsequently used for ageing analysis. The other otolith from the original pair was stored separately as spare, if needed. Otoliths were prepared for age analysis by being positioned on the edge of a glass slide using thermoplastic glue (Crystal BondTM) and ground down close to the nucleus using 1200 grade abrasive diamond encrusted plate. The glue was melted again using a hotplate before the half-cut otolith was mounted grounded face down on the middle of the slide and ground down again leaving only a thin section. Sectioned saggitae were then positioned back on the hotplate and smeared in crystal bond to improve the visibility of opaque bands. Subsequently, each otolith was viewed under a high-powered microscope with transmitted light which was electronically linked via a mounted camera onto a computer screen.
The internal opaque incremental bands clearly visible in the sectioned sagittae were presumed to be annual markings based on previous descriptions of internal otolith structure of A. australis (Graynoth Citation1999; Graynoth & Jellyman Citation2002). In all occasions, sectioned otoliths were read twice for annuli if both estimates were the same, or read a further time if the first and second estimates did not match. If two out of three estimates matched then that number was used as final age.
Statistical analyses
Because eels were PIT tagged, it was possible to monitor the growth of each individual. The BW, TL, CF and SGR were based on the values of the individual eels, and expressed as mean ± standard deviation (SD). On the other hand, the values of BG, FI and FCR were expressed as mean ± standard error of the mean (SEM). These parameters were calculated using the values for tanks of eels (n = 3 for each treatment).
Before analysis, normality and homogeneity of variance were checked by Anderson-Darling and Bartlett test respectively. Data of age among the different eel groups were analysed by one-factor analysis of variance. Growth parameters and condition factor were analysed by nonparametric Kruskal-Wallis Multiple Comparisons test and FI and FCR by Mann-Whitney-Wilcoxon test (Snedecor & Cochran Citation1989). All analyses were made using Minitab statistical software 16.1.0 (Minitab® Statistical Software, State College, PA, USA). Null hypotheses were rejected at P < 0.05 level of significance.
Results
There were marked differences in BW, TL and SGR between large and small eels (established as such on day 42) until the end of the trial (day 109). However, no significant differences were found either between L-graded and L-ungraded or between S-graded and S-ungraded. For clarity, only values at days 0, 42 and 109 are shown in .
Table 1 Body weight, total length, survival, specific growth rate, biomass gain, feed intake, feed conversion ratio and age of four groups of shortfin eel (Anguilla australis) established by size.
The survival rate of all eel groups was high (). One small eel died from the S-graded and three eels from the S-ungraded groups. All large eels survived. Analysis of biomass gain from day 42 to day 109 indicates no significant differences between L-graded and L-ungraded or between S-graded and S-ungraded (). It was found that eels from the S-graded group had a significantly lower feed intake (54.9 ± 14.1%) than those eels from the L-graded group (78.9 ± 2.9%). Furthermore, the feed conversion ratio (FCR) of small graded eels was significantly higher than large graded eels, 1.5 ± 0.1 and 1.0 ± 0.1 respectively ().
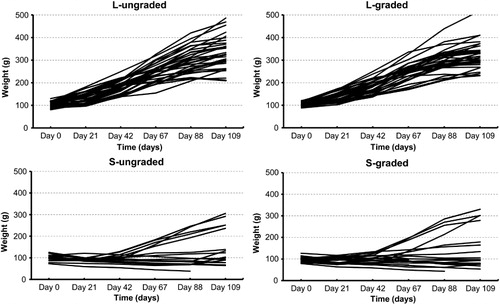
shows the BW performance of each specimen through the entire 109 day experiment. This indicates a similar growing development between graded and ungraded eels for each size. Both large-eel groups grew well during the experiment, with all specimens reaching a final weight > 200 g. In contrast, both small-eel groups have a negative or very poor growing, with only four individuals of S-graded and five of S-ungraded reaching > 200 g.
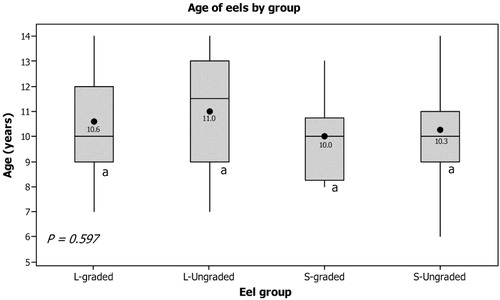
There were no significant differences in mean age between L-graded, L-ungraded, S-graded and S-ungraded, with the modal age structure of 9–11 years old eels present in each group (). The youngest eel was estimated to be 6 years old and the oldest 14. Individuals within this age structure were present in nearly all four groups.
Discussion and conclusions
The stocking densities used in this laboratory study (12 to 15 kg m−3, semi-intensive culture) are considerably lower than those used in a commercial recirculation aquaculture system (RAS) setting (around 100 kg m−3, high-density culture). Prior studies on eels suggest that, in high-density culture, the fish size variability decreases, due to aggression being more evenly distributed throughout the population because smaller individuals are less easily distinguished and thus victimised by larger dominants (Knights Citation1987; Wickins Citation1987). Therefore, it is expected that if size grading were to have a beneficial effect on the growth performance of eels it would be more clearly observed in a semi-intensive culture, where the hierarchical effect is more obvious, than in a high-density culture.
The results of this study did not show any significant effect on the growth performance or survival of the yellow stage of shortfin eel by size grading. It was not possible to improve the individual growth rate of small eels by the absence of large eels in the same tank. This is in agreement with the Kamstra (Citation1993) study, which showed that grading did not have a significant effect on total biomass output or size-frequency distribution on cultured European eel (A. anguilla).
These findings suggest that the wide variability in the individual growth performance of the shortfin eels observed in the laboratory is not primarily a consequence of the social interaction (hierarchical position) among tank-mates. This is in line with many studies that suggest that high growth heterogeneity in eels (Knights Citation1987; Wickins Citation1987; Kamstra Citation1993; García-Gallego & Akharbech Citation1998) and other fish species (Doyle & Talbot Citation1986; Jobling & Reinsnes Citation1987; Cutts et al. Citation1998; Sunde et al. Citation1998; Lambert & Dutil Citation2001; Martins et al. Citation2005, Citation2006) is not necessarily linked with the establishment of social hierarchies. Other factors, such as genetic background, differences in metabolism, utilisation of food resources and/or different ability for adapting to the intensive culture, may be responsible for the highly variable growth. By rearing individually confined European eels (A. anguilla), Wickins (Citation1985) confirmed that highly variable growth rates can occur in this species without physical interaction among the individuals and without competition for food.
There was a marked growth performance difference between large and small eels, independently of whether they belonged to the graded or ungraded group. The large eels had a significantly higher SGR and BG than small eels. The present study also indicates that the differences in individual growth rate are a reflection of feeding capacity. Small eels had a smaller feed consumption and a poorer FCR than large eels. These differences in feeding capacity seems to be associated to different grades of individual adaptation to the consumption of artificial feed and to the rearing conditions, rather than a competition for feed among the specimens. Regardless of the size of the tank-mates it seems that most of the small eels did not want to feed at all, with the grading process, by itself, unable to reverse their individual poor growth. The mean age of eels was not significantly different between groups and age did not appear to be related to size, with individuals of the same age measured with different TLs. The age structure of each group was similar, with individuals from the youngest to the oldest age estimates represented.
The sex of the eels in this study was unknown and this raises the possibility of a confounding effect. Anguilla species show clear sexual dimorphism, with females attaining greater body size than males (Holmgren et al. Citation1997). Sex determination in eels is not unequivocally determined by genes, but is presumably influenced by environmental and social factors. Under intensive aquaculture condition (high stock density), males tend to predominate (Krueger & Oliveira Citation1999). High temperatures and salinity have been proposed to favour development as male, but experimental studies have failed to demonstrate a clear effect of either on sex determination (Davey & Jellyman Citation2005).
This study was performed with captured wild eels of approximately 38 cm initial TL, a size where many may not have completed their sexual differentiation. Todd (Citation1980) has shown that sexual differentiation is often completed by 49 cm TL in A. australis, while Kearney et al. (Citation2011) established that 60% of eels between 27.5 and 30 cm TL had early developed testes. The sexual life-history of A. australis in aquaculture settings is relatively unknown and requires more investigation.
In conclusion, this study indicates that size grading did not improve growth performance during the yellow phase of shortfin eel. Small eels did not exhibit increased growth rates when isolated from larger eels. Other options should be explored in order to elucidate how slower-growing eels could be helped to grow faster. Further research focusing on feeding stimulants to increase the appetite of eels is suggested.
References
- Appelbaum S, Birkan V 1992. The effect of grading on the growth and distribution pattern in young eels Anguilla anguilla (L.) reared in recirculating systems. Irish Fisheries Investigations Series A (Freshwater) 36: 116–119.
- Baardvik BM, Jobling M 1990. Effect of size-sorting on biomass gain and individual growth rates in Arctic charr, Salvelinus alpinus L. Aquaculture 90: 11–16. 10.1016/0044-8486(90)90278-U
- Barki A, Harpaz S, Huluta G, Karplus I 2000. Effects of larger fish and size grading on growth and size variation in fingerling silver perch. Aquaculture International 8: 391–401. 10.1023/A:1009274726380
- Benhaïm D, Péan S, Brisset B, Leguay D, Bégout ML, Chatain B. 2011. Effect of size grading on sea bass (Dicentrarchus labrax) juvenile self-feeding behaviour, social structure and culture performance. Aquatic Living Resources 24: 391–402. 10.1051/alr/2011140
- Carmichael GJ 1994. Effects of size-grading on variation and growth in channel catfish reared at similar densities. Journal of the World Aquaculture Society 25: 101–108. 10.1111/j.1749-7345.1994.tb00809.x
- Conte FS 2004. Stress and the welfare of cultured fish. Applied Animal Behaviour Science 86: 205–233. 10.1016/j.applanim.2004.02.003
- Cutts CJ, Metcalfe NB, Taylor AC 1998. Aggression and growth depression in juvenile Atlantic salmon: the consequences of individual variation in standard metabolic rate. Journal of Fish Biology 52: 1026–1037. 10.1111/j.1095-8649.1998.tb00601.x
- Davey AJ, Jellyman DJ 2005. Sex determination in freshwater eels and management options for manipulation of sex. Fish Biology and Fisheries 15: 37–52. 10.1007/s11160-005-7431-x
- Dou S-Z, Masuda R, Tanaka M, Tsukamoto K. 2004. Size hierarchies affecting the social interactions and growth of juvenile Japanese flounder, Paralichthys olivaceus. Aquaculture 233: 237–249. 10.1016/j.aquaculture.2003.09.054
- Doyle RW, Talbot AJ 1986. Artificial selection on growth and correlated selection on competitive behavior in fish. Canadian Journal of Fisheries and Aquatic Sciences 43: 1059–1064. 10.1139/f86-132
- García-Gallego M, Akharbach H. 1998. Evolution of body composition of European eels during their growth phase in a fish farm, with special emphasis on the lipid component. Aquaculture International 6: 345–356. 10.1023/A:1009207904037
- Graynoth E 1999. Improved otolith preparation, ageing and back-calculation techniques for New Zealand freshwater eels. Fisheries Research 42: 137–146. 10.1016/S0165-7836(99)00029-6
- Graynoth E, Jellyman DJ 2002. Growth, survival, and recruitment of juvenile shortfined eels (Anguilla australis) in a large New Zealand coastal lake. New Zealand Journal of Marine and Freshwater Research 36: 25–37. 10.1080/00288330.2002.9517068
- Gunnes K 1976. Effect of size grading young Atlantic salmon (Salmo salar) on subsequent growth. Aquaculture 9: 381–386. 10.1016/0044-8486(76)90079-X
- Hirt-Chabbert J, Young O 2012. Effects of surgically implanted PIT tags on growth, survival and tag retention of yellow shortfin eels (Anguilla australis) under laboratory conditions. Journal of Fish Biology 81: 314–319. 10.1111/j.1095-8649.2012.03289.x
- Holmgren K, Wickström H, Clevestam P 1997. Sex related growth of European eel, Anguilla anguilla, with focus on median silver eel age. Canadian Journal of Fisheries and Aquatic Sciences 54: 2775–2781. 10.1139/f97-193
- Jobling M 1985. Physiological and social constrains on growth of fish with special reference to Arctic charr, Salvelinus alpinus L. Aquaculture 44: 83–90. 10.1016/0044-8486(85)90011-0
- Jobling M, Reinsnes TG 1987. Effect of sorting on size-frequency distributions and growth of Arctic charr, Salvelinus alpinus L. Aquaculture 60: 27–31. 10.1016/0044-8486(87)90355-3
- Johnsson JI 1997. Individual recognition affects aggression and dominance relations in rainbow trout Oncorhynchus mykiss. Ethology 103: 267–282. 10.1111/j.1439-0310.1997.tb00017.x
- Kamstra A 1993. The effect of size grading on individual growth in eel, Anguilla anguilla, measured by individual marking. Aquaculture 112: 67–77. 10.1016/0044-8486(93)90159-V
- Kearney M, Jeffs A, Lee P 2011. Development and early differentiation of male gonads in farmed New Zealand shortfin eel, Anguilla australis. New Zealand Natural Science 36: 33–44.
- Kestemont P, Jourdan S, Houbart M, Mélard C, Paspatis M, Fontaine P et al. 2003. Size heterogeneity, cannibalism and competition in cultured predatory fish larvae: biotic and abiotic influences. Aquaculture 227: 333–356. 10.1016/S0044-8486(03)00513-1
- Knights B 1987. Agonistic behaviour and growth in the European eel, Anguilla anguilla L., in relation to warm-water aquaculture. Journal of Fish Biology 31: 265–276. 10.1111/j.1095-8649.1987.tb05230.x
- Koebele BP 1985. Growth and the size hierarchy effect: an experimental assessment of three proposed mechanisms; activity differences, disproportional food acquisition, physiological stress. Environmental Biology of Fishes 12: 181–188. 10.1007/BF00005149
- Koops H, Kuhlman H 1979. Grading of farmed eels by means of mesh wire boxes. ICES CM F: 5.
- Krueger WH, Oliveira K 1999. Evidence for environmental sex determination in the American eel, Anguilla rostrata. Environmental Biology of Fishes 55: 381–389. 10.1023/A:1007575600789
- Lambert Y, Dutil JD 2001. Food intake and growth of adult Atlantic cod (Gadus morhua L.) reared under different conditions of stocking density, feeding frequency and size-grading. Aquaculture 192: 233–247. 10.1016/S0044-8486(00)00448-8
- Martins CI, Aanyu M, Schrama J, Verreth J 2005. Size distribution in African catfish (Clarias gariepinus) affects feeding behaviour but not growth. Aquaculture 250: 300–307. 10.1016/j.aquaculture.2005.05.034
- Martins CI, Schrama J, Verreth J 2006. The effect of group composition on the welfare of African catfish (Clarias gariepinus). Applied Animal Behaviour Science 97: 323–334. 10.1016/j.applanim.2005.07.003
- McIntyre D, Healy L, Saari M 1979. Intraspecies aggression and monoamine levels in rainbow trout (Salmo gairdneri) fingerlings. Behavioural and Neural Biology 25: 90–98. 10.1016/S0163-1047(79)90807-0
- Metcalfe NB 1986. Intraspecific variation in competitive ability and food intake in salmonids: consequences for energy budgets and growth rates. Journal of Fish Biology 28: 525–531. 10.1111/j.1095-8649.1986.tb05190.x
- Metcalfe NB, Huntingford FA, Graham WD, Thorpe JE 1989. Early social status and the development of life-history strategies in Atlantic salmon. Proceedings of the Royal Society of London Series B, Biological Sciences 236: 7–19. 10.1098/rspb.1989.0009
- Peters G, Delventhal H, Klinger H 1980. Physiological and morphological effects of social stress in eel (Anguilla anguilla L.). Archiv fur Fischereiwissenschaft 30: 157–180.
- Salas-Leiton E, Anguís V, Rodríguez-Rúa A, Cañavate JP. 2010. Stocking homogeneous size groups does not improve growth performance of Senegalese sole (Solea senegalensis, Kaup 1858) juveniles: individual growth related to fish size. Aquacultural Engineering 43: 108–113. 10.1016/j.aquaeng.2010.08.001
- Seppä T, Peuhkuri N, Hirvonen H, Laurila A, Piironen J, Ranta E 1999. Narrow size regime among individuals favors rapid growth in Arctic char (Salvelinus alpinus) juveniles. Canadian Journal of Fisheries and Aquatic Sciences 56: 1891–1897. 10.1139/f99-121
- Seymour EA 1984. Feeding biology, behaviour and growth of the European eel, Anguilla anguilla L., in relation to warmwater aquaculture. PhD thesis. London, UK, Polytechnic of Central London.
- Shepherd J, Bromage N 1992. Intensive fish farming. Oxford, UK, Wiley-Blackwell. 420 p.
- Sloman K 2007. The consequences and causes of individual variation in fish. Comparative Biochemistry and Physiology Part A: Molecular & Integrative Physiology 148: 68–69.
- Snedecor GW, Cochran WG 1989. Statistical methods. 8th edition. Ames, IA, Iowa State University Press. 503 p.
- Stefánsson M, Imsland A, Jenssen M, Jonassen T, Stefansson S, Fitzgerald R 2000. The effect of different initial size distribution on the growth of Atlantic halibut. Journal of Fish Biology 56: 826–836. 10.1111/j.1095-8649.2000.tb00875.x
- Sunde LM, Imsland AK, Folkvord A, Stefansson SO 1998. Effects of size grading on growth and survival of juvenile turbot at two temperatures. Aquaculture International 6: 19–32. 10.1023/A:1009265602388
- Todd PR 1980. Size and age of migrating New Zealand freshwater eels (Anguilla spp.). New Zealand Journal of Marine and Freshwater Research 14: 283–293. 10.1080/00288330.1980.9515871
- Wallace JC, Kolbeinshavn AG 1988. The effect of size grading on subsequent growth in fingerling Arctic charr, Salvelinus alpinus (L). Aquaculture 73: 97–100. 10.1016/0044-8486(88)90044-0
- Wickins JF 1985. Growth variability in individually confined elvers, Anguilla anguilla L. Journal of Fish Biology 27: 469–478. 10.1111/j.1095-8649.1985.tb03194.x
- Wickins JF 1987. Effects of size, culling and social history on growth of cultured elvers, Anguilla anguilla (L). Journal of Fish Biology 31: 71–82. 10.1111/j.1095-8649.1987.tb05215.x
- Yahyaoui P 1988. Etude expérimentale de la croissance de la civelle d’ Anguille (Anguilla anguilla L., 1758). Journal of Applied Ichthyology 4: 1–13. 10.1111/j.1439-0426.1988.tb00542.x