
Abstract
To investigate regional drivers of spatial patterns in macro- and meio-faunal community structure (abundance, biomass and taxonomic diversity) and ecosystem function (sediment community oxygen consumption [SCOC]), we sampled two regions in close proximity on New Zealand's continental margin—the Chatham Rise and the Challenger Plateau. Sites (n = 15) were selected in water depths ranging from 266–1212 m to generate a gradient in sedimentary properties and, in particular, surface pelagic productivity. Both macro- and meio-fauna abundance and biomass was 2–3.5 times higher on the Chatham Rise than on the Challenger Plateau, reflecting regional differences in pelagic primary production. We also found significant inter- and intra-regional differences in macro-fauna taxonomic diversity with two distinctive site groupings in each region. Univariate and multivariate measures of macro-fauna community attributes were most strongly correlated with sediment photosynthetic pigment (explaining 24%–59% of the variation). Sediment pigment content was as equally important in explaining meio-fauna community structure (36%–7%). Unlike community structure, SCOC was most strongly correlated with depth (44%), most likely reflecting temperature effects on benthic metabolism. Our results highlight the importance of a benthic labile food supply in structuring infaunal communities on continental margins and emphasise a tight coupling between pelagic and benthic habitats.
Introduction
Continental margins, the area between the coast and the base of the continental slope, represent about 11% of the Earth’s surface (Ramirez-Llodra et al. Citation2010). The benthic infauna of these regions represents a large portion of the Earth’s undiscovered biodiversity (Brandt et al. Citation2007; Williams et al. Citation2010). The infaunal communities also play a critical role in global biogeochemical cycles, influencing rates of carbon turnover (e.g. Levin & Dayton Citation2009; Liu et al. Citation2010), as well as in local ecological processes including food resources for higher trophic levels such as commercially important fish species (e.g. Ware & Thomsen Citation2005).
The spatial structure of continental margin benthic communities is shaped by a myriad of interacting environmental variables (Ricklefs Citation1987; Levin et al. Citation2010; Levin & Sibuet Citation2012). At regional scales, water depth is commonly identified as the most important environmental correlate of infaunal community structure (Carney Citation2005) as it acts as a surrogate for other important variables such as temperature, pressure and the downward flux of organic matter that fuels benthic organisms (Gage & Tyler Citation1991). The flux of organic matter to the seafloor generally decreases with depth due to decomposition during sedimentation (Suess Citation1980; Martin et al. Citation1987) and is correlated with a decline in the abundance and biomass of benthic organisms (e.g. Rowe et al. Citation1982; Soltwedel Citation2000; Johnson et al. Citation2007; Deming & Carpenter Citation2008). There is also a shift towards smaller size classes such that the relative contribution of meio-fauna (and bacteria) to the total biomass increases with water depth (e.g. Rowe et al. Citation1991, Citation2008; Danovaro et al. Citation1999; Rex et al. Citation2006; Berkenbusch et al. Citation2011). Spatial and temporal variations in pelagic production can also alter the input of organic matter independent of water depth (Lutz et al. Citation2007), influencing regional and local community structure (e.g. Graf Citation1989; Smith et al. Citation2009). Infaunal communities may also be influenced by small-scale processes such as sediment grain size distribution and biogeochemical gradients, by favouring different habitat and feeding preferences among benthic species (e.g. Galéron et al. Citation2001; Leduc et al. Citation2011).
Sediment community oxygen consumption (SCOC) is a standard measure for estimating carbon and energy requirements of benthic organisms (Glud Citation2008) and is considered a meaningful measure of ecosystem function (Rowe et al. Citation2008). In deep-sea sediments SCOC has been used to derive the organic carbon flux to the seafloor (e.g. Jahnke Citation1996; Nodder et al. Citation2003) and balance open ocean trophic models (e.g. Murphy et al. Citation2012). Like faunal abundance/biomass, SCOC generally decreases with depth (Suess Citation1980), but can be modified by spatial–temporal variations in pelagic productivity (e.g. Smith et al. Citation2001; Moodley et al. Citation2005; Nodder et al. Citation2007).
Most continental margin studies focus on community structure (e.g. Probert & McKnight Citation1993; Galéron et al. Citation2001; Berkenbusch et al. Citation2011) or ecosystem function (e.g. Sayles et al. Citation1994; Wenzhofer & Glud Citation2002), but not both, and those that do are often restricted to a single site (e.g. Smith et al. Citation2006) or transect (e.g. Smith Citation1978; Nodder et al. Citation2003, Citation2007). Such sampling restrictions make it difficult to quantify how regional scale environmental variability influences community structure and function, yet elucidating these interactions is critical for management as fishing and mineral extraction activities intensify (Levin & Dayton Citation2009). It is recognised that studying continental margins with different environmental conditions may be useful in determining regional drivers of benthic community structure and function (Levin & Sibuet Citation2012). Such studies are rare (but see Compton et al. Citation2012; Knox et al. Citation2012) because large inter-regional distances make it difficult to control for variables that occur at latitudinal/longitudinal scales and which structure benthic communities (e.g. temperature, seasonality; Ricklefs Citation1987). On the New Zealand continental margin, however, two contrasting regions exist in relatively close proximity—the Chatham Rise and Challenger Plateau (). Both regions occupy similar latitudinal and depth ranges and share common fauna (reviewed by Carney Citation2005), but exhibit large differences in topographic heterogeneity and pelagic productivity (Compton et al. Citation2012).
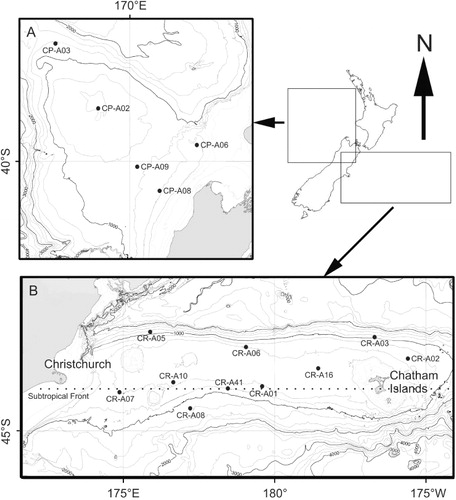
The Chatham Rise is a broad submarine ridge extending eastwards from the east coast of the South Island to beyond the Chatham Islands (). The rise has a complex local geomorphology (Nodder et al. Citation2011) but is generally flat-topped at 300–400 m depth descending into deeper waters (> 2500 m) to the north and south. On the southern flank of the rise, the globally important Subtropical Front (STF) is constrained zonally at ca. 44°S, separating subtropical from subantarctic surface waters (Uddstrom & Oien Citation1999; Sutton Citation2001). This region represents a broad zone of enhanced phytoplankton biomass (0.2–0.8 mg chlorophyll-a m−3; Murphy et al. Citation2001) and production (annual net primary production = 300–600 g C m−2 y−1; Field et al. Citation1998) which peaks during spring (up to 990 mg C m−2 d−1; Bradford-Grieve et al. Citation1997; Longhurst Citation1998) with the southern flank receiving a higher flux of more labile organic matter than the northern flank (Nodder & Northcote Citation2001).
In contrast, west of New Zealand, the Challenger Plateau is a largely homogeneous, flat-lying continental block bathed by relatively warm, oligotrophic subtropical water (). Primary production in this region is low, with chlorophyll-a concentrations typically < 0.2 mg m−3 (Murphy et al. Citation2001). Phytoplankton blooms do not occur with the frequency or magnitude of those on the Chatham Rise. However, sporadic increases in primary production associated with upwelling and terrigenous inputs occur off the west coast of the South Island, and probably influence the benthic communities on the landward margin of the Challenger Plateau (Moore & Murdoch Citation1993; Bradford-Grieve & Livingston Citation2011).
Previous benthic studies of the Chatham Rise infauna have focused on north–south, down-slope depth transects between 179°W–177°E, approximately midway between the South Island and the Chatham Islands (e.g. Probert & McKnight Citation1993; Probert et al. Citation1996, Citation2009; Nodder et al. Citation2003, Citation2007; Berkenbusch et al. Citation2011) with little sampling occurring elsewhere on the rise. The Challenger Plateau is even more poorly sampled and, to our knowledge, there are no published studies describing spatial variations in the benthic infauna.
As part of the 2007 Ocean Survey 20/20 Chatham-Challenger Hydrographic Biodiversity and Seabed Habitats Project we broadly sampled these two contrasting continental margins at water depths between 200–1200 m. Our objective was to describe spatial patterns of infaunal community structure (abundance, biomass, taxonomic diversity) and ecosystem function (SCOC) across these two understudied regions. Because the sampling strategy (described below) maximised variation in sediment properties and pelagic primary production among sites, we were able to assess how much of the spatial variation in structure and function could be explained by key environmental variables. We focused on macro- and meio-fauna because, collectively, they account for a substantial proportion of the total biomass (e.g. Galéron et al. Citation2000) and contribute significantly to ecosystem function and biogeochemical cycling (Nodder et al. Citation2003; Baguley et al. Citation2008; Rowe et al. Citation2008). This study contributes to a relatively small number of studies describing regional drivers of continental margin infaunal community structure and function.
Methods
Site selection and sampling
The Chatham Rise was sampled in austral mid-autumn (National Institute of Water and Atmospheric Research [NIWA] voyage TAN0705; 29 March–30 April 2007) and the Challenger Plateau in late autumn–early winter of the same year (TAN0707; 26 May–7 June 2007). Site positions were located randomly within environmentally homogeneous strata identified using a multivariate statistical classification scheme (Legendre et al. Citation2002) based on seabed parameters (bathymetry, backscatter) derived from a multibeam survey conducted in 2006 (TAN0610) and New Zealand-wide regional physical oceanographic variables (e.g. water depth, seabed slope, mean annual solar radiation, sea-surface temperature gradient and amplitude, modelled wave and tidal current speeds) described in Snelder et al. (Citation2007). Full details of the scheme can be found in Nodder et al. (Citation2011). In total, 15 sites (10 on the Chatham Rise, five on the Challenger Plateau) spanning a similar depth range (200–1200 m) in both regions were sampled for infauna (; ). The greater number of sites on the Chatham Rise reflects the greater number of predicted environmental strata, relative to the Challenger Plateau (Nodder et al. Citation2011).
Table 1 Site location, sediment properties and sediment community oxygen consumption (SCOC) on the Chatham Rise and Challenger Plateau.
All samples were collected using a deep-ocean multicorer (Ocean Instruments MC800-A) which allowed the retrieval of undisturbed surface sediments and the overlying water. Eight cylindrical sample tubes of 9.52 cm internal diameter (71.2 cm2) and 70 cm in length can be deployed simultaneously. At each site, three to five casts were taken and, wherever possible, replicate samples were collected from sample tubes deployed on different casts. Occasionally, replicate samples came from different sample tubes collected on the same cast; however, at least for surface sediment properties on the Chatham Rise, the within-cast variation (m scale) is expected to be similar to the among-cast variation (100 m scale) (Nodder et al. Citation2003).
Sediment properties
Sediment properties (i.e. grain size, CaCO3 content, total organic matter [TOM], chlorophyll-a [chl-a] and phaeopigment [phaeo] content) were determined in duplicate using standard techniques (see Nodder et al. Citation2003, Citation2011). Subsamples from 0.5 cm thick sediment slices over the upper 0–5 cm were analysed for grain size and the results averaged over this depth interval, while for all other parameters only the surface sediment layer (0.0–0.5 cm) data were used in this study.
Infaunal community structure
At each site, the top 30–40 cm from two to seven multicore tubes was sieved separately through a 500 μm mesh and the retained macro-fauna preserved in 10% formalin. Blotted wet weight of living material was determined and converted to carbon, assuming carbon represents 4.3% of total wet weight (Rowe Citation1983). Macro-fauna were then sorted into broad taxonomic groups and counted (see ).
Meio-fauna were sampled from two multicore tubes per site using a single subcore (5.3 cm2) inserted to a depth of 5 cm, a depth shown in previous studies to capture > 95% of individuals (e.g. Soltwedel Citation2000; Galéron et al. Citation2001). Samples were sectioned at 0–1 and 1–5 cm intervals (though only integrated [0–5 cm] values are presented here), preserved in 10% buffered formalin, stained with Rose Bengal, then rinsed through 1 mm (to remove macro-fauna) and 32 μ m meshes. Retained meio-fauna were separated from the sediment by Ludox floatation, transferred to pure glycerol, and mounted on slides for counting and identification of the main taxa (see ) using a compound microscope (100 × magnification) (Somerfield & Warwick Citation1996; Leduc et al. Citation2010). Body dimensions obtained from image analysis (Grove et al. Citation2006) and conversion factors for meio-faunal groups were used to determine body volumes, which were then converted to biomass assuming a specific gravity of 1.13 and a wet weight:carbon ratio of 0.1 (Feller & Warwick Citation1988).
Sediment community oxygen consumption
Shipboard incubations of bottom sediment and associated biota were used to estimate SCOC (μmol O2 m−2 h−1). The upper 13–15 cm of sediment and the overlying water from undisturbed multicore tubes (n = 2–5 per site) were carefully extruded into incubation chambers (total volume = 2.0 L) with the same internal diameter. Incubation chambers were then sealed and placed in water baths at ambient bottom water temperature (± 0.1 °C) where they were held in the dark for 26–42 h. An additional chamber containing only near-bottom water was incubated to account for water column respiration. A magnetically driven impeller (60–80 rpm) fitted to the chamber lids gently circulated water during the incubations. Approximately 6 h after chambers were placed in the water bath, O2 concentrations were measured with a pre-calibrated PreSens MICROX I micro-optode inserted through a sampling port in the chamber lid. Six to eight more O2 measurements were made during the incubation period, which was terminated when the initial concentrations had decreased by 10%–15%. SCOC was estimated from the decline in O2 concentration with time (linear regression r2 > 0.9) after correcting for water column respiration, which accounted for < 5% of the change measured in the incubated sediment cores. It is recognised that shipboard incubations may bias solute flux estimates due to pressure changes and chamber mixing regimes (e.g. Glud Citation2008). However, in a previous study on the Chatham Rise, the methods used here replicated spatial patterns of in situ SCOC, measured using a benthic lander, and values were only elevated by c. 10%–15% in the shipboard incubations (Nodder et al. Citation2007).
Statistical analyses
We combined data from the Chatham Rise and Challenger Plateau and examined relationships between environmental variables (depth, temperature, depth-corrected temperature [Td–c] and surface sediment properties) and meio- and macro-faunal diversity (number of taxa, Shannon diversity [H’loge]), abundance and biomass with distance-based linear models (DistLMs) in PERMANOVA+ (Anderson et al. Citation2008). For SCOC, predictors included both environmental and faunal variables in DistLMs. Shapiro-Wilks tests were used to check the normality of the data and several variables were corrected by loge (% sand, TOM, faunal abundance and biomass) or square root (chl-a) transformation. Although DistLM is a semi-parametric, permutation-based method that does not rely on normally distributed data, we used the transformed predictor variables to reduce the influence of outliers (as recommended by Anderson et al. Citation2008). Pooling data from the Chatham Rise and Challenger Plateau was justified because intra-regional variations created an overlapping range in environmental and faunal values (–).
Table 2 Faunal abundance, diversity and biomass from the Chatham Rise and Challenger Plateau.
Marginal tests were run in DistLM to identify significant environmental predictors, and the proportion of variance explained irrespective of other variables. Partial tests were then run to assess the explanatory power of each predictor variable after all other significant predictors had been fitted. In partial tests, collinearity between variables (Pearson’s r > 0.8) was avoided by removing the predictor that explained the smaller proportion of variation in the model. Similarity matrices were constructed using Euclidean distance and the model was run using the stepwise selection procedure and r2 selection criterion. P values were obtained for predictor variables by 9999 permutations. The (linear) combination of uncorrelated (r < 0.8) predictor variables that explained the greatest proportion of variation were identified using the stepwise selection procedure.
Multivariate analyses in PRIMER 6 (Clarke & Gorley Citation2006) based on mean taxon abundance was used to assess inter-site variations in faunal community composition. Mean site abundance rather than replicate core data was used in these analyses because of the low and variable sampling effort among sites for which the low macro-faunal densities made the assessment of intra-site variability problematic. Community abundance data were transformed (macro-fauna = square root, meio-fauna = log(x + 1)) to lessen the influence of numerically dominant taxa before calculating Bray–Curtis similarity. Resulting linkages were visualised in a cluster diagram and multidimensional scaling (MDS) plot on which site clusters were identified. The statistical validity of the site clusters (p < 0.05) was tested using the similarity profile test (SIMPROF). The taxa contributing to dissimilarity between site groupings were determined using the similarity percentages (SIMPER) procedure. Correlations between multivariate community composition (based on Bray–Curtis similarity matrices) and environmental variables (Euclidian distance matrices) were examined using DistLMs (Anderson et al. Citation2008).
Results
Infaunal abundance, biomass and sediment community oxygen consumption
Among-site variations in faunal abundance and biomass were high, but strong regional differences were observed (). We omitted the macro-faunal biomass at site CR-A08 from further analyses because it was an order of magnitude greater than the next highest value (e.g. Karakassis & Eleftheriou Citation1997), as a result of a few large individuals contributing disproportionately to the biomass. Mean macro-faunal abundance on the Chatham Rise (48.9 ± 26.6 [± 1SD] ind. 0.01 m−2) was nearly 3.5 times higher than that measured on the Challenger Plateau (14.1 ± 6.3 ind. 0.01 m−2). Between-region differences in macro-faunal abundance were reflected in taxon richness (e.g. 7.2 ± 2.1 cf. 4.1 ± 1.1 taxa core−1 for the Chatham Rise and Challenger Plateau respectively) and biomass (6.9 ± 3.4 cf. 3.7 ± 2.1 mg C 0.01 m−2). Mean meio-fauna abundance and biomass were also higher on the Chatham Rise (2 times and 3.5 times respectively), an increase comparable to the macro-fauna data. Meio-faunal taxon richness, however, did not differ between the regions (e.g. 8.5 ± 2.0 cf. 7.6 ± 1.2 taxa core−1). Macro-fauna accounted for 93%–99% of the total biomass per site with the meio-fauna contribution 1.7 times higher on the Chatham Rise (3.6 ± 2.6%) than the Challenger Plateau (2.1 ± 1.1%).
Several of the environmental variables were highly correlated (|r| > 0.8, p < 0.001). Depth and temperature were negatively correlated as were silt with sand and CaCO3 content, and Td–c with phaeo content. Consequently, we used a reduced set of weakly correlated (|r| < 0.8) environmental variables (depth, sand, clay, CaCO3, TOM, and chl-a and phaeo content) in subsequent statistical analyses. Variables excluded because of co-correlation explained less of the variation in faunal measures than did the variable that was retained.
In marginal tests, macro-faunal biomass and abundance were positively correlated with chl-a and/or phaeo content (). Meio-faunal abundance and biomass were also strongly correlated with these variables, suggesting a tight relationship with labile benthic food availability. Sites with high CaCO3 sediment contents were associated with lower TOM and pigment contents (). Accordingly, CaCO3 content was negatively correlated with faunal abundance and biomass. In partial tests (after correcting for the effects of other significant predictors), only phaeo (and, for meio-fauna, chl-a) content remained correlated with faunal abundance (). Univariate macro-faunal diversity measures (i.e. taxa core−1, H’loge) were also correlated with phaeo (positively) and CaCO3 (negatively) content (marginal test p’s < 0.05, partial test p’s > 0.4). Correlations between meio-fauna diversity measures and environmental variables were not significant, except for a weakly significant positive relationship between taxa core−1 and chl-a (marginal test p < 0.1). The ratio of meio-fauna:macro-fauna biomass was positively correlated with chl-a content (i.e. the relative contribution of meio-faunal C to total C increased with increasing chl-a content; ).
Table 3 Proportion of variation in infaunal abundance, biomass and multivariate community composition explained by significant correlations with environmental variables (the direction is given in parentheses) derived from DistLMs.
SCOC was most strongly correlated with water depth and, to a lesser extent, CaCO3, chl-a, phaeo and meio-faunal biomass (). Macro-fauna abundance, diversity and biomass were not significantly correlated with SCOC (p > 0.3). Because meio-faunal biomass was strongly correlated with chl-a content it was removed from the model in subsequent partial tests. After correcting for the effects of the remaining three variables, only depth remained correlated with SCOC because of the moderately strong correlations among the three remaining sedimentary variables. The best linear predictor of SCOC was a combination of depth and chl-a content (cumulative r2 = 0.69) which explained only 1% less of the variation than the model that included all four variables.
Table 4 Proportion of variation in sediment community oxygen consumption (SCOC) explained by significant correlations with faunal/environmental variables (the direction is given in parentheses) derived from DistLMs.
Macro-fauna taxonomic composition
Polychaetes were the most abundant taxon at 14 of the 15 sites (the exception being CR-A03 where ‘other worms’ were more abundant), accounting for 23%–62% of macro-faunal abundance (). The next most abundant taxa were ‘other worms’ and amphipods which, together with polychaetes, represented 53%–92% of the fauna (see for individual station compositions).
Multivariate analyses revealed distinctive site clusters at 65% similarity (). Four groupings were identified (confirmed by SIMPROF at p < 0.05): two on the Chatham Rise and two on the Challenger Plateau, indicating inter- and intra-regional differences in macro-faunal community composition. The largest grouping (Group 1) contained the seven sites on the Chatham Rise closest to the South Island. These sites were characterised by high macro-faunal abundance (30–90 ind. 0.01 m−2) and high numbers of taxa core−1 (5.4–12.5; ). The two easternmost sites on the Chatham Rise (CR-A02, CR-A03; Group 2) also clustered together, with lower abundances than Group 1, but with similar univariate measures of diversity (taxa core−1, H’loge). The only site not to group with others on the Chatham Rise was CR-A16. ‘Other worms’, a taxon that was abundant at all other sites, were absent from this site. On the Challenger Plateau, the three shallower (266–537 m) sites (CP-A06, CP-A08, CP-A02; Group 3) were separated from the two deeper (803–1212 m) sites (CP-A09, CP-A03; Group 4), reflecting differences in abundance and diversity. At lower levels of similarity (50%), the two deeper Challenger sites (CP-A03, CP-A09) clustered in a group with the two easternmost Chatham Rise sites, which were separate from a single group that contained all other sites from both regions.
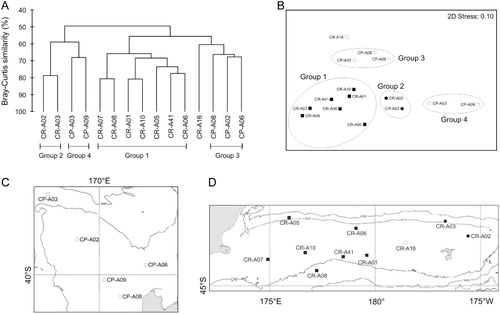
SIMPER analyses revealed that the dissimilarity among the four groups was driven primarily by the abundance of polychaetes, other worms and amphipods. One of these three taxa was always the greatest contributor to between group dissimilarity (12%–20%) and collectively they accounted for 20% (between Groups 3 and 4) to 40% (between Groups 1 and 4) of the dissimilarity. By comparison, the contribution of most of the other taxa to dissimilarity among groups was generally small (< 8%), reflecting their low abundance and irregular occurrence. Group 1 stations were characterised by high abundances of polychaetes, other worms and amphipods, which distinguished them from all other groups. Ophiuroids were absent from Groups 2 and 4 and were the second biggest contributor to dissimilarity (12%) in Group 3 after other worms (Group 2; 16%) and polychaetes (Group 4; 12%). Higher abundances of the three dominant taxa in Group 2 sites separated them from Group 4.
In marginal tests, multivariate taxonomic community structure was most strongly correlated with phaeo content, followed by CaCO3, clay and chl-a content (); all other variables (depth, sand, TOM) were not significantly correlated with community structure (p > 0.2). After correcting for the effects of the remaining three environmental variables, none of the variables were significant. The best linear predictor of taxonomic community structure was a combination of phaeo and clay, but they explained only a modest portion of the total variation (cumulative r2 = 0.30).
Meio-fauna taxonomic composition
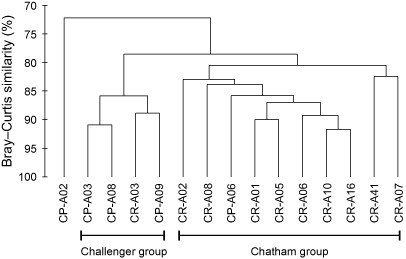
Nematodes were the most abundant taxon at all sites, accounting for 73%–90% of meio-faunal abundance (). The next most abundant taxa were copepods and nauplii which, together with nematodes, represented 96%–99% of the meio-fauna (see for individual station compositions). The coarse level of taxonomic resolution, combined with the dominance of a few taxa, resulted in a high level of similarity among sites, with two predominantly inter-regional site clusters (confirmed by SIMPROF) forming at similarities greater than 80% (). Two sites did not group with their region: the deep eastern site on the Chatham Rise (CR-A03) and the shallow near-shore station on the Challenger Plateau (CP-A06). The central Challenger Plateau site (CP-A02) was the only one that did not cluster with any other site. These patterns are broadly consistent with the spatial variation in meio-faunal abundance (). The two clusters were characterised by a similar taxon composition with the same four taxa (nematodes, nauplii, copepods and annelids) accounting for more than 80% of the within-group similarity. Dissimilarity was driven in equal measures (8%–13%) by higher abundances of ostracods, kinorynchs, annelids, nematodes and copepods in the predominantly Chatham Rise cluster, with these taxa collectively accounting for 48% of the between-group difference. On the Challenger Plateau, CP-A02 was characterised by low annelid abundances and absence of ostracods, kinorynchs and tardigrades, which collectively accounted for 40%–45% of the dissimilarity with the other two groups.
Despite the high level of similarity among sites, taxonomic community structure was significantly correlated in marginal tests with the same suite of environmental variables as was the macro-fauna (). Furthermore, also like the macro-fauna, in partial tests (after correcting for the effects of the other variables) no single environmental variable was a significant predictor of community structure. The best linear predictor of taxonomic community structure was a combination of phaeo and chl-a content, which explained 48% of the total variation.
Discussion
We sampled infaunal communities and surficial sediment variables on the Challenger Plateau and Chatham Rise, two contrasting continental margin habitats that differ in the degree of pelagic productivity and geomorphological complexity to determine environmental drivers of spatial patterns in community structure and function. Macro- and meio-faunal community structure was not correlated with depth; probably because of the relatively narrow depth range of our study sites (266–1241 m) and coarse taxonomic resolution, but was correlated with sediment photosynthetic pigment content, indicating the importance of a benthic labile food supply as a structuring variable on continental margins (e.g. Tyler Citation1995; Levin & Sibuet Citation2012). The inter- and intra-regional differences we observed in community structure are similar to other components of the benthos (epi- and hyper-benthic organisms, nematodes) described for this system (Lörz Citation2011; Compton et al. Citation2012; Knox et al. Citation2012; Leduc et al. Citation2012) indicating a consistency across different components of the benthos.
Infaunal abundance, biomass and ecosystem function
Previous studies on the Chatham Rise (Nodder et al. Citation2003; Probert et al. Citation2009; Berkenbusch et al. Citation2011; Leduc et al. Citation2012) and elsewhere (e.g. Gage & Tyler Citation1991; Wei et al. Citation2010) have identified water depth as an important variable regulating faunal abundance and biomass on continental margins. Depth is a proxy for many variables, including temperature and pressure, but a reduction in food supply is often cited for the observed decline in faunal abundances with depth (Tyler Citation1995). In the present study, the sites encompassed a relatively narrow depth range and site selection was based on maximising differences in other environmental factors, of which surface pelagic productivity was a key variable (Nodder et al. Citation2011). For the same sites sampled in this study, Knox et al. (Citation2012) found a very strong correlation between chl-a concentration in surface waters in the months prior to the voyage and the total pigment (chl-a + phaeo) content in the sediment. Thus, gradients in pelagic productivity across the continental margins are reflected in the organic composition of the surface sediments, with lower productivity on the Challenger Plateau on inter-regional scales and a west to east regional gradient across the relatively more productive Chatham Rise (e.g. Murphy et al. Citation2001).
It was this gradient in sediment pigment content that was most strongly correlated with meio- and macro-faunal abundance and biomass. Even after correcting for other predictors (thereby removing the effect of co-variation), sediment pigment content still explained a significant proportion of the variation in faunal abundance (). It is not surprising that pigment content was a good predictor of faunal density since it has repeatedly been used as proxy for the labile pool of organic matter that is immediately available to organisms in the sediment (e.g. Danovaro et al. Citation1995; Soltwedel Citation2000). TOM as another measure of the organic pool was not a good predictor, perhaps because it also includes refractory compounds unavailable to the benthos (e.g. Nodder et al. Citation2003). By comparison with other continental margins these relatively shallow sites (266–1241 m) in the present study indicate a reasonably tight link between pelagic production and the benthos, and further highlight the role of food supply in structuring deepsea benthic communities. Other studies that have been able to correct for depth effects have also drawn similar conclusions regarding the role of food supply (Soltwedel Citation2000; Leduc et al. Citation2012).
At the Chatham Rise sites faunal abundance was highest west of 180° then declined eastwards towards the Chatham Islands. This region of high infaunal biomass on the western Chatham Rise is consistent with the broad area of enhanced productivity associated with the STF (see of Knox et al. Citation2012). East of 180°, the STF is more diffuse and is deflected south of the Chatham Islands where surface chl-a concentrations are less than on the rise itself (Chiswell et al. Citation2013).
On the Challenger Plateau the landward stations (CP-A06, CP-A08) are probably influenced by terrestrial runoff from the western New Zealand continental margin, and consequently experience high surface chl-a concentrations that decrease rapidly offshore (Chiswell et al. Citation2013), a pattern consistent with our observed changes in faunal biomass and density. High spring primary production is a recognised oceanographic phenomenon close to the west coast of the South Island due to wind-driven upwelling and deep winter mixing over the continental slope (Bradford et al. Citation1986). In the vicinity of the inshore stations CP-A06 and CP-A08 a zone of prominent upwelling (the Kahurangi plume) occurs on the continental shelf inducing high primary and secondary production (Bradford et al. Citation1986; Shirtcliffe et al. Citation1990; Chang et al. Citation1992).
While there are few faunal data from the Challenger Plateau, several studies have reported macro- and meio-faunal biomass along a north–south depth transect at 178°E across the Chatham Rise (Nodder et al. Citation2003, Citation2007; Berkenbusch et al. Citation2011). For sites at similar depths to those in the present study (< 1200 m), the biomass values reported for macro- (1.8–2.2 mg C 0.01 m−2) and meio-fauna (28–125 µg C 10 cm−2) in these studies are comparable to those for sites west of 180° here. These earlier studies, along with others focused on the central Chatham Rise (Probert & McKnight Citation1993; Probert et al. Citation2009), have consistently observed elevated faunal abundance and biomass on the southern flank, compared to the northern flank of the rise that has been linked to greater fluxes of primary production from within the STF in this region, possibly due to currents in the frontal zone enhancing deposition of labile phytodetritus (Nodder & Northcote Citation2001; Nodder et al. Citation2007). This pattern has also been consistent in broad-scale environmental classifications of the region based on all available benthic data (Compton et al. Citation2012; Leathwick et al. Citation2012). For the high abundance/biomass stations landward of 180°, we observed no substantial differences between stations on the northern and southern flanks of the Chatham Rise (). This may be a result of our low number of sampling stations and relatively narrow depth range, but could also reflect seasonal variations in primary production. The greatest differences between northern and southern flanks have been observed in spring, coinciding with phytoplankton blooms and deposition of phytodetritus on the southern flanks (Nodder et al. Citation2003, Citation2007; Berkenbusch et al. Citation2011), whereas in autumn sampling (as sampled by this study) differences in benthic biomass between the rise flanks were much less pronounced (Nodder et al. Citation2003). In addition, the more landward sites are under a broader latitudinal zone of elevated primary production in the surface waters potentially influencing the northern flanks (Chiswell et al. Citation2013).
In comparison to global datasets, meio-faunal abundances/biomass are typical for the depth ranges sampled (Soltwedel Citation2000), but, as noted by Nodder et al. (Citation2003), macro-faunal biomass is generally lower than observed elsewhere (e.g. Rowe Citation1983). This is surprising considering the elevated productivity in the STF and is possibly a consequence of enhanced advection and remineralisation of sinking organic matter in the water column before it is deposited on the seafloor (Nodder & Northcote Citation2001). High intensities of benthic fishing pressure that have occurred on the Chatham Rise (Clark et al. Citation2000) may also be a contributing factor, a hypothesis that requires further investigation.
It is well recognised that the abundance and biomass of deepsea benthic organisms decreases with increasing water depth (e.g. Rowe et al. Citation1982; Soltwedel Citation2000; Johnson et al. Citation2007; Deming & Carpenter Citation2008); however, the rate of decline is greater in the larger size fractions (mega- and macro-fauna), such that the relative contribution of meio-fauna (and bacteria) to the total biomass increases with water depth (e.g. Rowe et al. Citation1991, Citation2008; Danovaro et al. Citation1999; Rex et al. Citation2006; Berkenbusch et al. Citation2011). A key driver of the shift towards smaller size classes at greater depths is a decrease in food supply (Rowe et al. Citation1991; Flach et al. Citation1999; Galéron et al. Citation2000; Rex et al. Citation2006). Across our study sites, therefore, we would anticipate an increase in the ratio of meio-fauna:macro-fauna biomass with decreasing labile food availability. However, the opposite was observed, with the proportion of meio-faunal biomass increasing from < 2% to 6%–10% with increasing chl-a content. Although ratios of meio-fauna:macro-fauna biomass are equivalent to those reported elsewhere, including the Chatham Rise for similar water depths (c. 0.01–0.10; e.g. Rowe et al. Citation1991; Flach et al. Citation1999; Berkenbusch et al. Citation2011), the depth range used to establish the relationship of increasing meio-faunal biomass with decreasing food supply (hundreds to several thousand metres) is greater than in our study (although see Rowe et al. Citation1991). This difference in depth range may go some way to accounting for our unexpected result. Another possible explanation is that the meio-fauna are able more quickly to increase biomass in response to fresh food inputs (represented by chl-a concentrations in sediments) because of their higher rates of population turnover (Valiela Citation1995; Giere Citation2009). We observed no significant relationships between the ratio of meio-fauna:macro-fauna biomass with other (more refractory) indicators of food supply (TOM, phaeo).
Water depth was not a significant predictor of faunal abundance/biomass, but it was the variable most strongly correlated with benthic ecosystem function, as measured by SCOC. Temperature and water depth were highly correlated (r = −0.9); thus, it is likely that the decline in organism metabolism with decreasing temperature is driving SCOC rather than a direct effect of depth. In stepwise regression models, chl-a was also a significant predictor of SCOC, explaining an additional 25% of the variability after depth (temperature) effects, which accounted for 44%. Thus, the spatial variability in labile benthic food supply, which was an important driver of infaunal abundance/biomass, was also reflected in measures of benthic ecosystem function, with higher values at the landward stations on both the Challenger Plateau and Chatham Rise. Similar conclusions regarding the role of food supply in regulating SCOC were drawn by Nodder et al. (Citation2003), who observed a pattern of seasonally elevated rates on the Chatham Rise, especially on the southern flank, which was linked to spring phytoplankton blooms in the STF and is consistent with other deepsea studies (e.g. Sayles et al. Citation1994; Smith et al. Citation2001; Moodley et al. Citation2005).
Previous measurements of SCOC on the Chatham Rise at water depths of 350–1000 m range between 60–200 µmol O2 m−2 h−1 (Nodder et al. Citation2003, Citation2007), comparable to the present study except for site CP-A06, which had SCOC values almost double those recorded anywhere else. This station was the shallowest of our study sites, was substantially warmer than any of the others, and had sediments dominated by the silt/clay fraction, all of which are properties associated with elevated SCOC (e.g. Glud Citation2008). Although the rates at CP-A06 are high relative to others in this study they are not abnormally elevated if compared to sites sampled on other continental shelves/slopes at similar water depths (see Fig. 6 of Giles et al. Citation2007).
Taxonomic diversity
The community composition of both meio-fauna and macro-fauna is consistent with that reported from this region and elsewhere. Meio-fauna samples are usually dominated by nematodes, followed by harpacticoid copepods and nauplii (e.g. Vanaverbeke et al. Citation1997; Soltwedel Citation2000; Vanhove et al. Citation2004; Gambi & Danovaro Citation2006; Grove et al. Citation2006; Baguley et al. Citation2008), whereas polychaetes are frequently the most prevalent macro-faunal taxon (e.g. Brown Citation1991; Paterson & Lambshead Citation1995; Probert et al. Citation1996; Smith & Demopoulos Citation2003). Our coarse level of taxonomic resolution and low levels of replication (due to logistical constraints) place limits on our ability to detect spatial variations in community structure. However, while species level data would have potentially revealed additional spatial patterns, coarser taxonomic resolution can often provide similar results (Olsgard et al. Citation2003; Hirst Citation2008; Tataranni et al. Citation2009).
Multivariate macro-fauna community structure was correlated with a similar suite of environmental variables as abundance, with sediment phaeo content the single best predictor, explaining 24% of the variation. Sites clustered into four groups, consistent with the spatial gradient in pelagic productivity across the two regions, as described above. Group 1 contained the largest number of sites (seven) and included all those in the broad region of enhanced pelagic production landward of 180° on the Chatham Rise. At lower levels of similarity this group clustered with Group 3 which contained the landward (CP-A06, CP-A08) and the shallow central site (CP-A03) from the Challenger Plateau. The more oligotrophic eastern sites from the Chatham Rise (CR-A02, CR-A03) clustered together (Group 2), as did those deeper oligotrophic sites from the flanks of the Challenger Plateau (Group 4; CP-A09, CP-A03).
The dominance of nematodes and a small number of other broadly distributed other taxa in meio-fauna communities resulted in a high level of similarity among sites (> 70%). Nevertheless, two broad clusters did emerge, at the 80% similarity level (), reflecting the inter-regional differences in meio-faunal abundance. The only sites not to cluster with their region were the shallow, most landward, site in the Challenger Plateau region (CP-A06) and the deep eastern site on the Chatham Rise (CR-A03), each of which clustered with sites from the other region. Overall, the meio-faunal community structure was broadly consistent with the macro-faunal data; that is, site groupings reflected variations in pelagic productivity, as represented by sediment pigment content, which explained 48% of the variation in community structure.
Four recent studies, which have reported on aspects of benthic community structure at the same sites used in this study (but concentrating on different groups of organisms), reveal a degree of consistency among different components of the benthos (Lörz Citation2011; Compton et al. Citation2012; Knox et al. Citation2012; Leduc et al. Citation2012). Leduc et al. (Citation2012) examined genus and species-level diversity of free-living nematodes at the same sites sampled in this study. Although the greater level of taxonomic resolution resulted in low levels of similarity between sites (typically < 30%), the resulting site clusters were very similar to those observed here for the macro-fauna. Distinct nematode species communities were observed for the landward Chatham Rise sites, which contained all our Group 1 sites, an eastern Chatham Rise cluster containing Group 2 sites and a similar landward and seaward clustering of sites on the Challenger Plateau (Groups 3 and 4 respectively).
Inter-regional differences in the abundance of hyperbenthic macro-fauna were also similar to those observed for meio-fauna and macro-fauna, with densities approximately 2 times higher on the Chatham Rise than on the Challenger Plateau (Lörz Citation2011; Knox et al. Citation2012). Lörz (Citation2011) found no differences in the community structure of hyperbenthic invertebrates between the regions, perhaps reflecting the coarse taxonomic resolution employed. Knox et al. (Citation2012), on the other hand, found that amphipod family community structure was significantly correlated with sediment pigment content. However, site groupings did not mirror those observed here. In Knox et al. (Citation2012), all the Chatham Rise sites and landward Challenger Plateau sites clustered together, with a high degree of similarity (> 75%) and the clusters appeared to be structured mostly by depth, with sites on the crest separate from those on the flanks of the rise. The remaining offshore Challenger Plateau sites (CP-A09, CP-A02 and CP-A03) did not cluster with any others. Hyperbenthic trawl samples used by Lörz (Citation2011) and Knox et al. (Citation2012), and towed camera transects and epibenthic sledge samples used by Compton et al. (Citation2012) all represent community composition integrated over distances of approximately 1–2 km. This contrasts with the much smaller spatial scales (metres to tens of metres) sampled at each site for the multicorer data used here.
Compton et al. (Citation2012) used data on larger epibenthic fauna (mega-fauna, sensu Hessler & Sanders Citation1967) from 100 sites on the Chatham Rise and 49 on the Challenger Plateau in combination with broad-scale gridded oceanographic data to model relationships between benthic invertebrate community structure and environmental gradients. With higher sampling density and the use of a range of predictive modelling approaches, they developed continuous maps of predicted benthic community composition that show finer gradations in spatial structure than is achievable with the point data used in the present study. Of particular relevance to the present study are distinctions between the north and south flanks of Chatham Rise, the eastern and western ends of Chatham Rise, and between Chatham Rise and Challenger Plateau, which are broadly reflected in the clustering of sites in our analyses (cf. Fig. 5 in Compton et al. Citation2012). This provides further evidence that these distributional patterns are common to a range of benthic faunal size classes (meio-fauna, macro-fauna, mega-fauna) and functional groups (infauna, epifauna). Compton et al. (Citation2012) found that environmental variables associated with water mass properties (i.e. depth-corrected temperature, mixed layer depth) provided the greatest explanatory power over large spatial (inter-regional) scales, but that variables linked to food supply (pelagic productivity, estimated particulate organic matter flux) were also important drivers of community structure.
In summary, our study demonstrates a clear link between infaunal community structure, ecosystem function and the availability of food for continental margin biota. Sites with higher amounts of labile organic matter supported greater abundances, biomass and diversity, and higher rates of SCOC. Unexpectedly we did not see a shift in dominance towards smaller size classes at sites with lower amounts of labile food, a consequence perhaps of the ability of meio-fauna to respond rapidly to ephemeral resources. The spatial patterns in infaunal community structure we observed were consistent with those documented for other components of the benthos and lend weight to the critical role of pelagic productivity in regulating benthic community structure and function on continental margins.
Associate Editor: Dr Richard Taylor.
Acknowledgements
We thank Lisa Northcote for the sediment analyses, and Jane Halliday and Mark Fenwick for macro-fauna identification. Samples were collected during the OceanSurvey20/20 Chatham/Challenger Bio-diversity and Seabed Habitat Project jointly funded by the New Zealand Ministry of Fisheries, Land Information New Zealand, National Institute of Water & Atmospheric Research (NIWA) Ltd and the New Zealand Department of Conservation. We thank the master and crew of RV Tangaroa and shipboard scientific personnel during cruises TAN0705 and TAN0707 to the Chatham Rise and Challenger Plateau, respectively. The New Zealand Foundation for Research, Science and Technology (now Ministry of Business, Innovation and Employment) programme C01X0501 (Coasts & Oceans Outcome-Based Investment), NIWA National Coasts and Oceans Centre Core Funding (Programme 2) and previous programmes are also thanked for funding. Two anonymous reviewers are thanked for their constructive comments which improved the manuscript.
References
- Anderson MJ, Gorley RN, Clarke KR 2008. PERMANOVA+ for PRIMER: guide to software and statistical methods. Plymouth, UK, Primer-e.
- Baguley JG, Montagna PA, Hyde LJ, Rowe GT 2008. Metazoan meiofauna biomass, grazing, and weight-dependent respiration in the northern Gulf of Mexico deep sea. Deep Sea Research Part II: Topical Studies in Oceanography 55: 2607–2616.
- Berkenbusch K, Probert PK, Nodder SD 2011. Comparative biomass of sediment benthos across a depth transect, Chatham Rise, Southwest Pacific Ocean. Marine Ecology Progress Series 425: 79–90.
- Bradford JM, Lapennas PP, Murtagh, RA, Chang FH, Wilkinson V 1986. Factors controlling summer phytoplankton production in greater Cook Strait, New Zealand. New Zealand Journal of Marine and Freshwater Research 20: 253–279. 10.1080/00288330.1986.9516148
- Bradford-Grieve JM, Chang FH, Gall M, Pickmere S, Richards F 1997. Size-fractionated phytoplankton standing stocks and primary production during austral winter and spring 1993 in the Subtropical Convergence region near New Zealand. New Zealand Journal of Marine and Freshwater Research 31: 201–224. 10.1080/00288330.1997.9516759
- Bradford-Grieve JM, Livingston ME 2011. Spawning fisheries and the productivity of the marine environment off the west coast of the South Island, New Zealand. New Zealand Aquatic Environment and Biodiversity Report 2011/84. Published by the Ministry of Fisheries (now Ministry of Primary Industries), Wellington. 136 p.
- Brandt A, Brix S, Brokeland W, Choudhury M, Kaiser S, Malyutina M 2007. Deep-sea isopod biodiversity, abundance, and endemism in the Atlantic sector of the Southern Ocean-results from the ANDEEP I-III expeditions. Deep Sea Research Part II: Topical Studies in Oceanography 54: 1760–1775. 10.1016/j.dsr2.2007.07.015
- Brown B 1991. Biomass of deep-sea benthic communities: polychaetes and other invertebrates. Bulletin of Marine Science 48: 401–411.
- Carney RS 2005. Zonation of deep biota on continental margins. Oceanography and Marine Biology: An Annual Review 43: 211–278.
- Chang FH, Vincent WF, Woods PH 1992. Nitrogen utilisation by size-fractionated phytoplankton assemblages associated with an upwelling event off Westland. New Zealand Journal of Marine and Freshwater Research 26: 287–301. 10.1080/00288330.1992.9516524
- Chiswell SM, Bradford-Grieve J, Hadfield MG, Kennan SC 2013.Climatology of surface chlorophyll a, autumn-winter and spring blooms in the southwest Pacific Ocean. Journal of Geophysical Research Oceans 118: 1003–1018. 10.1002/jgrc.20088
- Clark MR, Anderson OF, Francis RICC, Tracey DM 2000. The effects of commercial exploitation on orange roughy (Hoplostethus atlanticus) from the continental slope of the Chatham Rise, New Zealand, from 1979 to 1997. Fisheries Research 45: 217–238. 10.1016/S0165-7836(99)00121-6
- Clarke, KR, Gorley RN 2006. PRIMER v6: user manual/tutorial. Plymouth, UK, Primer-e.
- Compton TJ, Bowden DA, Pitcher CR, Hewitt JE, Ellis N 2012. Biophysical patterns in benthic assemblage composition across contrasting continental margins off New Zealand. Journal of Biogeography 40: 75–89. 10.1111/j.1365-2699.2012.02761.x
- Danovaro R, Della Croce N, Eleftheriou A, Fabiano M, Papadopoulou N, Smith C et al. 1995. Meiofauna of the deep Mediterranean Sea: distribution and abundance in relation to bacterial biomass, organic matter composition and other environmental variables. Progress in Oceanography 36: 329–341. 10.1016/0079-6611(96)00002-X
- Danovaro R, Dinet A, Duineveld G, Tselepides A 1999. Benthic response to particulate fluxes in different trophic environments: a comparison between the Gulf of Lions–Catalan Sea (western-Mediterranean) and the Cretan Sea (eastern-Mediterranean). Progress in Oceanography 44: 287–312.
- Deming J, Carpenter S 2008. Factors influencing benthic bacterial abundance, biomass, and activity on the northern Continental Margin and Deep Basin of the Gulf of Mexico. Deep Sea Research Part II: Topical Studies in Oceanography 55: 2597–2606.
- Feller RJ, Warwick RM 1988. Energetics. In: Higgins RP, Thiel H eds. Introduction to the study of meiofauna. Washington, DC, Smithsonian Institution Press. Pp. 181–196.
- Field CB, Behrenfeld MJ, Randerson JT, Falkowski P 1998. Primary production of the biosphere: integrating terrestrial and oceanic components. Science 281: 237–240. 10.1126/science.281.5374.237
- Flach E, Vanaverbeke J, Heip C 1999. The meiofauna:macrofauna ratio across the continental slope of the Goban Spur (north-east Atlantic). Journal of the Marine Biological Association of the UK 79: 233–241. 10.1017/S0025315498000265
- Gage JD, Hughes DJ, Gonzalez Vecino JL 2002. Sieve size influence in estimating biomass, abundance and diversity in samples of deep-sea macrobenthos. Marine Ecology Progress Series 225: 97–107. 10.3354/meps225097
- Gage JD, Tyler PA 1991. Deep sea biology: a natural history of organisms at the deep-sea floor. Cambridge, Cambridge University Press. 504 p.
- Galéron J, Sibuet M, Mahaut M-L, Dinet A 2000. Variation in structure and biomass of the benthic communities at three contrasting sites in the tropical NE Atlantic. Marine Ecology Progress Series 197: 121–137.
- Galéron J, Sibuet M, Vanreusel A, Mackenzie K, Gooday AJ, Dinet A et al. 2001. Temporal patterns among meiofauna and macrofauna taxa related to changes in sediment geochemistry at an abyssal NE Atlantic site. Progress in Oceanography 50: 303–324.
- Gambi C, Danovaro R 2006. A multiple-scale analysis of metazoan meiofaunal distribution in the deep Mediterranean Sea. Deep Sea Research Part I: Oceanographic Research Papers 53: 1117–1134. 10.1016/j.dsr.2006.05.003
- Giere O 2009. Meiobenthology: the microscopic motile fauna of aquatic sediments. Berlin, Springer-Verlag. 527 p.
- Giles H, Pilditch CA, Nodder SD, Zeldis JR, Currie K 2007. Benthic oxygen fluxes and sediment properties on the northeastern New Zealand continental shelf. Continental Shelf Research 27: 2373–2388. 10.1016/j.csr.2007.06.007
- Glud RN 2008. Oxygen dynamics of marine sediments. Marine Biology Research 4: 243–289. 10.1080/17451000801888726
- Gooday AJ, Turley CM 1990. Responses by benthic organisms to inputs of organic material to the ocean floor: a review. Philosophical Transactions of the Royal Society A: Mathematical, Physical and Engineering Sciences 331: 119–138. 10.1098/rsta.1990.0060
- Graf G 1989. Benthic-pelagic coupling in a deep-sea benthic community. Nature 341: 437–439. 10.1038/341437a0
- Grove SL, Probert PK, Berkenbusch K, Nodder SD 2006. Distribution of bathyal meiofauna in the region of the Subtropical Front, Chatham Rise, south-west Pacific. Journal of Experimental and Marine Biology and Ecology 330: 342–355. 10.1016/j.jembe.2005.12.038
- Henschke N, Bowden DA, Everett JD, Holmes SP, Kloser RJ, Lee RW et al. 2013. Salp-falls in the Tasman Sea: a major food input to deep-sea benthos. Marine Ecology Progress Series 491: 165–175. 10.3354/meps10450
- Hessler RR, Sanders HL 1967. Faunal diversity in the deep-sea. Deep Sea Research and Oceanographic Abstracts 14: 65–78.
- Hirst AJ 2008. Surrogate measures for assessing cryptic faunal biodiversity on macroalgal-dominated subtidal reefs. Biological Conservation 141: 211–220. 10.1016/j.biocon.2007.09.025
- Jahnke R 1996.The global ocean flux of particulate organic carbon: areal distribution and magnitude. Global Biogeochemical Cycles 10: 71–88. 10.1029/95GB03525
- Johnson NA, Campbell JW, Moore TS, Rex MA, Etter RJ, McClain CR et al. 2007. The relationship between the standing stock of deep-sea macrobenthos and surface production in the western North Atlantic. Deep Sea Research Part I: Oceanographic Research Papers 54: 1350–1360.
- Karakassis J, Eleftheriou A 1997. The continental shelf of Crete: structure of macrobenthic communities. Marine Ecology Progress Series 160: 185–196. 10.3354/meps160185
- Knox MA, Hogg ID, Pilditch CA, Lörz A, Nodder SD 2012. Abundance and diversity of epibenthic amphipods (Crustacea) from contrasting bathyal habitats. Deep Sea Research Part I: Oceanographic Research Papers 62: 1–9. 10.1016/j.dsr.2011.12.011
- Leathwick J, Rowden A, Nodder SD, Gorman AR, Bardsley S, Pinkerton M et al. 2012. A Benthic-Optimised Marine Environment Classification (BOMEC) for New Zealand waters. New Zealand Aquatic Environment and Biodiversity Report No. 88. Ministry for Primary Industries, Wellington. 54 p.
- Leduc D, Probert PK, Nodder SD 2010. Influence of mesh size and core penetration on estimates of deep-sea nematode abundance, biomass, and diversity. Deep Sea Research Part I: Oceanographic Research Papers 57: 1354–1362. 10.1016/j.dsr.2010.06.005
- Leduc D, Rowden AA, Bowden DA, Nodder SD, Probert PK, Pilditch CA et al. 2012. Nematode beta diversity on the continental slope of New Zealand: spatial patterns and environmental drivers. Marine Ecology Progress Series 454: 37–52. 10.3354/meps09690
- Leduc D, Rowden AA, Probert PK, Pilditch CA, Nodder SD, Vanreusel A et al. 2011. Further evidence for the effect of particle-size diversity on deep-sea benthic biodiversity. Deep Sea Research Part I: Oceanographic Research Papers 63: 164–169. 10.1016/j.dsr.2011.10.009
- Legendre P, Ellingsen K, Bjornbom E, Casgrain P 2002. Acoustic seabed classification: improved statistical method. Canadian Journal of Fisheries and Aquatic Sciences 59: 1085–1089. 10.1139/f02-096
- Levin LA, Dayton PK 2009. Ecological theory and continental margins: where shallow meets deep. Trends in Ecology and Evolution 24: 606–617. 10.1016/j.tree.2009.04.012
- Levin LA, Sibuet M 2012. Understanding continental margin biodiversity: a new imperative. Annual Review of Marine Science 4: 79–112. 10.1146/annurev-marine-120709-142714
- Levin LA, Sibuet M, Gooday AJ, Smith CR, Vanreusel A 2010. The roles of habitat heterogeneity in generating and maintaining biodiversity on continental margins: an introduction. Marine Ecology 31: 1–5. 10.1111/j.1439-0485.2009.00358.x
- Liu K-K, Atkinson L, Quiñones RA, Talaue-McManus L 2010. Biogeochemistry of Continental Margins in a Global Context. In: Liu K-K, Atkinson L, Quiñones, RA, Talaue-McManus L eds. Carbon and nutrient fluxes in continental margins: a global synthesis. Global Change–The IGBP Series. Berlin Heidelberg, Springer-Verlag. Pp. 3–24.
- Longhurst A 1998. Ecological geography of the sea. San Diego, Academic Press. 398 p.
- Lörz AN 2011. Biodiversity of an unknown habitat: bathyal invertebrate assemblages in the benthic biodiversity layer. Marine Biodiversity 41: 299–312.
- Lutz MJ, Caldeira K, Dunbar RB, Behrenfeld MJ 2007. Seasonal rhythms of net primary production and particulate organic carbon flux describe biological pump efficiency in the global ocean. Journal of Geophysical Research 112: C10011. 10.1029/2006JC003706
- Martin JH, Knauer GA, Karl DM, Broenkow WW 1987. VERTEX: carbon cycling in the northeast Pacific. Deep Sea Research Part A. Oceanographic Research Papers 34: 267–285. 10.1016/0198-0149(87)90086-0
- Moodley L, Middelburg JJ, Soetaert K, Boschker HTS, Herman PMJ, Heip CHR 2005. Similar rapid response to phytodetritus deposition in shallow and deep-sea sediments. Journal of Marine Research 63: 457–469. 10.1357/0022240053693662
- Moore M, Murdoch RC 1993. Physical and biological observations of coastal squirts under nonupwelling conditions. Journal of Geophysical Research: Oceans 98: 20043–20061. 10.1029/93JC01857
- Murphy EJ, Cavanagh RD, Hofmann EE, Hill SL, Constable AJ, Costa DP et al. 2012. Developing integrated models of Southern Ocean food webs: including ecological complexity, accounting for uncertainty and the importance of scale. Progress in Oceanography 102: 74–92. 10.1016/j.pocean.2012.03.006
- Murphy RJ, Pinkerton MH, Richardson KM, Bradford-Grieve JM, Boyd PW 2001. Phytoplankton distributions around New Zealand derived from SeaWiFS remotely-sensed ocean colour data. New Zealand Journal of Marine and Freshwater Research 35: 343–362. 10.1080/00288330.2001.9517005
- Nodder SD, Duineveld GCA, Pilditch CA, Sutton PJ, Probert PK, Lavaleye MSS et al. 2007. Focusing of phytodetritus deposition beneath a deep-ocean front, Chatham Rise, New Zealand. Limnology and Oceanography 52: 299–314. 10.4319/lo.2007.52.1.0299
- Nodder S, Maas E, Bowden D, Pilditch CA 2011. Physical, biogeochemical, and microbial characteristics of sediment samples from the Chatham Rise and Challenger Plateau. New Zealand Aquatic Environment and Biodiversity, Report No 70. Ministry of Fisheries, Wellington. 34 p.
- Nodder SD, Northcote LC 2001. Episodic particulate fluxes at southern temperate mid-latitudes (42–45°S) in the Subtropical Front region, east of New Zealand. Deep Sea Research Part I: Oceanographic Research Papers 48: 833–864. 10.1016/S0967-0637(00)00062-5
- Nodder SD, Pilditch CA, Hall JA, Probert PK 2003. Temporal variability in benthic biomass and activity beneath the Subtropical Front, Chatham Rise, east of New Zealand. Deep Sea Research Part I: Oceanographic Research Papers 50: 959–985. 10.1016/S0967-0637(03)00094-3
- Olsgard F, Brattegard T, Holthe T 2003. Polychaetes as surrogates for marine biodiversity: lower taxonomic resolution and indicator groups. Biodiversity and Conservation 12: 1033–1049. 10.1023/A:1022800405253
- Paterson GLJ, Lambshead PJD 1995. Bathymetric patterns of polychaete diversity in the Rockall Trough, northeast Atlantic. Deep Sea Research Part I: Oceanographic Research Papers 42: 1199–1214.
- Probert PK, Glasby CJ, Grove SL, Paavo BL 2009. Bathyal polychaete assemblages in the region of the Subtropical Front, Chatham Rise, New Zealand. New Zealand Journal of Marine and Freshwater Research 43: 1121–1135. 10.1080/00288330.2009.9626535
- Probert, PK, Grove SL, McKnight DG, Read GB 1996. Polychaete distribution on the Chatham Rise, Southwest Pacific. Internationale Revue der gesamten Hydrobiologie und Hydrographie 81: 577–588. 10.1002/iroh.19960810411
- Probert PK, McKnight DG 1993. Biomass of bathyal macrobenthos in the region of the subtropical convergence, Chatham Rise, New Zealand. Deep Sea Research Part I: Oceanographic Research Papers 40: 1003–1007. 10.1016/0967-0637(93)90086-I
- Ramirez-Llodra E, Brandt A, Danovaro R, De Mol B, Escobar E, German CR et al. 2010. Deep, diverse and definitely different: unique attributes of the world’s largest ecosystem. Biogeosciences 7: 2851–2899. 10.5194/bg-7-2851-2010
- Rex MA, Etter RJ, Morris JS, Crouse J, McClain CR, Johnson NA et al. 2006. Global bathymetric patterns of standing stock and body size in the deep-sea benthos. Marine Ecology Progress Series 317: 1–8.
- Ricklefs RE 1987. Community diversity: relative roles of local and regional processes. Science 235: 167–171. 10.1126/science.235.4785.167
- Rowe GT 1983. Biomass and production of the deep-sea macrobenthos. In: Rowe GT ed. Deep-Sea Biology, the Sea, Vol. 8. New York, Wiley Interscience. Pp. 97–121.
- Rowe GT, Polloni PT, Haedrich RL 1982. The deep-sea macrobenthos on the continental margin of the northwest Atlantic Ocean. Deep Sea Research Part A. Oceanographic Research Papers 29: 257–278. 10.1016/0198-0149(82)90113-3
- Rowe G, Sibuet M, Deming J, Khripounoff A, Tietjen J, Macko S et al. 1991. ‘Total’ sediment biomass and preliminary estimates of organic carbon residence time in deep-sea benthos. Marine Ecology Progress Series 79: 99–114. 10.3354/meps079099
- Rowe GT, Wei C, Nunnally C, Haedrich R, Montagna P, Baguley JG et al. 2008. Comparative biomass structure and estimated carbon flow in food webs in the deep Gulf of Mexico. Deep Sea Research Part II: Topical Studies in Oceanography 55: 2699–2711. 10.1016/j.dsr2.2008.07.020
- Sayles FL, Martin WR, Deuser WG 1994. Response of benthic oxygen demand to particulate organic carbon supply in the deep sea near Bermuda. Nature 371: 686–689. 10.1038/371686a0
- Shirtcliffe TGL, Moore MI, Cole AG, Viner AB, Baldwin R, Chapman B 1990. Dynamics of the Cape Farewell upwelling plume, New Zealand. New Zealand Journal of Marine and Freshwater Research 24: 555–568. 10.1080/00288330.1990.9516446
- Smith CR, Demopoulos AWJ 2003. Ecology of the deep Pacific Ocean floor. In: Tyler PA ed. Ecosystems of the world, Vol 28. Amsterdam, Elsevier Science BV. Pp. 179–218.
- Smith KL Jr 1978. Benthic community respiration in the NW Atlantic Ocean: in situ measurements from 40 to 5200 m. Marine Biology 47: 337–347. 10.1007/BF00388925
- Smith KL Jr, Baldwin R, Ruhl H, Kahru M, Mitchell BG, Kaufmann R 2006. Climate effect on food supply to depths greater than 4,000 meters in the northeast Pacific. Limnology and Oceanography 51: 166–176. 10.4319/lo.2006.51.1.0166
- Smith KL Jr, Kaufmann RS, Baldwin RJ, Carlucci AF 2001. Pelagic-benthic coupling in the abyssal eastern North Pacific: an 8-year time-series study of food supply and demand. Limnology and Oceanography 46: 543–556. 10.4319/lo.2001.46.3.0543
- Smith KL Jr, Ruhl HA, Bett BJ, Billett DSM, Lampitt RS, Kaufmann RS 2009. Climate, carbon cycling, and deep-ocean ecosystems. Proceedings of the National Academy of Sciences of the United States of America 106: 19211–19218. 10.1073/pnas.0908322106
- Snelder TH, Leathwick JR, Dey KL, Rowden AA, Weatherhead MA, Fenwick GD et al. 2007. Development of an ecologic marine classification in the New Zealand region. Environmental Management 39: 12–29. 10.1007/s00267-005-0206-2
- Soltwedel T 2000. Metazoan meiobenthos along continental margins: a review. Progress in Oceanography 46: 59–84. 10.1016/S0079-6611(00)00030-6
- Somerfield PJ, Warwick RM 1996. Meiofauna in marine pollution monitoring programmes: a laboratory manual. Lowestoft, Ministry of Agriculture, Fisheries and Food.
- Suess E 1980. Particulate organic carbon flux in the oceans—surface productivity and oxygen utilization. Nature 288: 260–263. 10.1038/288260a0
- Sutton P 2001. Detailed structure of the Subtropical Front over Chatham Rise, east of New Zealand. Journal of Geophysical Research 106: 31045–31056. 10.1029/2000JC000562
- Tataranni M, Maltagliati F, Floris A, Castelli A, Lardicci C 2009. Variance estimate and taxonomic resolution: an analysis of macrobenthic spatial patterns at different scales in a Western Mediterranean coastal lagoon. Marine Environmental Research 67: 219–229. 10.1016/j.marenvres.2009.02.003
- Tyler PA 1995. Conditions for the existence of life at the deep-sea floor: an update. Oceanography and Marine Biology Annual Review 33: 221–244.
- Uddstrom MJ, Oien NA 1999. On the use of high-resolution satellite data to describe the spatial and temporal variability of sea surface temperatures in the New Zealand region. Journal of Geophysical Research: Oceans 104: 20729–20751. 10.1029/1999JC900167
- Valiela I 1995. Marine ecological processes. New York, Springer. 686 p.
- Vanaverbeke J, Soetaert K, Heip C, Vanreusel A 1997. The metazoan meiobenthos along the continental slope of the Goban Spur (NE Atlantic). Journal of Sea Research 38: 93–107. 10.1016/S1385-1101(97)00038-5
- Vanhove S, Vermeeren H, Vanreusel A 2004. Meiofauna towards the South Sandwich Trench (750–6300 m), focus on nematodes. Deep Sea Research Part II: Topical Studies in Oceanography 51: 1665–1687.
- Ware DM, Thomsen RE 2005. Bottom-up ecosystem trophic dynamics determine fish production in the Northeast Pacific. Science 308: 1280–1284. 10.1126/science.1109049
- Wei C-L, Rowe GT, Escobar-Briones E, Boetius A, Soltwedel T, Caley MJ et al. 2010. Global patterns and predictions of seafloor biomass using Random Forests. PLoS ONE 5: e15323. 10.1371/journal.pone.0015323.s012
- Wenzhofer F, Glud R 2002. Benthic carbon mineralization in the Atlantic: a synthesis based on in situ data from the last decade. Deep Sea Research Part I: Oceanographic Research Papers 49: 1255–1279. 10.1016/S0967-0637(02)00025-0
- Williams A, Althaus F, Dunstan PK, Poore GCB, Bax NJ, Kloser RJ et al. 2010. Scales of habitat heterogeneity and megabenthos biodiversity on an extensive Australian continental margin (100–1100 m depths). Marine Ecology 31: 222–236. 10.1111/j.1439-0485.2009.00355.x