
Abstract
Sediment resuspension during and after mechanical excavation of macrophytes may have a significant impact on resident fish populations. Unfortunately, little is known about the influence of this sediment on the respiratory performance and feeding abilities of fishes in New Zealand waterways. We examined the effects of suspended sediment (SS) concentrations previously observed after a large-scale macrophyte removal operation on oxygen consumption (MO2) and feeding rates of brown trout (Salmo trutta). MO2 at 0 mg L−1, 150 mg L−1, 300 mg L−1, 450 mg L−1 and 600 mg L−1 of SS was measured using semi-closed respirometry. Feeding rates at the same SS concentrations were also measured using laboratory tank experiments. Results suggest that SS concentrations up to 600 mg L−1 have no effect on MO2. Conversely, feeding rates were significantly reduced at 450 mg L−1 (22% reduction) and 600 mg L−1 (31% reduction), indicating that sediment concentrations above 450 mg L−1 may negatively affect brown trout populations.
Introduction
Increased suspended sediment (SS) associated with intensification of agriculture, forestry and mining, combined with increasing urbanisation, is thought to be a major contributor to the current global decline in freshwater fish biodiversity (Maitland Citation1995; Hazelton & Grossman Citation2009a). Mechanical excavation of macrophytes to maintain drainage outfall in low gradient waterways is common in New Zealand (Hudson & Harding Citation2004; Young et al. Citation2004). The long-term effects of a large macrophyte removal operation on SS concentrations were quantified for the first time in Greer (Citation2014). In that study, macrophyte removal in a New Zealand catchment significantly increased sediment resuspension, both immediately after excavation (maximum SS during excavation = 15,700 mg L−1) and during elevated flows in the following 77 days, with concentrations regularly exceeding 600 mg L−1 (maximum SS during high flow = 860 mg L−1) (Greer Citation2014). Thus, increased SS concentrations may partially drive the reductions in fish abundance that have been observed after macrophyte removal in New Zealand (Greer et al. Citation2012).
In Greer (Citation2014) the SS concentrations recorded after mechanical macrophyte excavation did not exceed lethal concentrations identified for brown trout (Salmo trutta) (Garric et al. Citation1990) or native fishes (Rowe et al. Citation2009). Therefore, it is unlikely that sediment suspended during macrophyte removal directly kills resident fish in New Zealand streams. Nevertheless, the structure of fish communities in New Zealand streams may still be affected by elevated SS concentrations after macrophyte removal. Suspended sediment is thought to impede respiratory function in fish by clogging and abrading gill structures, thereby reducing surface area for gaseous exchange (Bruton Citation1985; Ryan Citation1991; Lake & Hinch Citation1999; Sutherland & Meyer Citation2007). Suspended sediments also reduce visibility in the water column by scattering and absorbing light, which can impact on the feeding abilities of fish species that rely on vision to forage (Bruton Citation1985; Ryan Citation1991; Hazelton & Grossman Citation2009a,Citationb). It is necessary to determine the effects of sediment suspended during and after macrophyte removal on oxygen consumption and feeding if the drivers of reduced fish abundance after excavation are to be identified and managed (Greer et al. Citation2012).
One fish species found in New Zealand waterways that may be particularly susceptible to the effects of SS during and after macrophyte removal is brown trout. Salmonids are known to be sensitive to sediment, and high levels of SS have been shown to: increase avoidance behaviour (Bisson & Bilby Citation1982; Sigler et al. Citation1984; Scheurer et al. Citation2009); reduce feeding success (Sigler et al. Citation1984); cause gill damage (Sigler et al. Citation1984; Lake & Hinch Citation1999); and increase physiological stress in these fishes (Lake & Hinch Citation1999). Although not native to New Zealand waterways, brown trout are highly valued sport fish and the high sensitivity of salmonids to sediment (Garric et al. Citation1990) means that setting maximum SS concentrations for the protection of brown trout is likely to provide some level of protection to the less sensitive native species, such as banded kōkopu (Galaxias fasciatus) and redfin bully (Gobiomorphus huttoni) (Rowe et al. Citation2009).
The aim of this study was to examine the effects of sediment resuspension on the respiratory performance and feeding abilities of brown trout. Specifically, oxygen consumption and feeding rates were measured across the range of SS concentrations regularly recorded after macrophyte removal (0–600 mg L–1; Greer Citation2014). This study represents the first attempt to quantify the effects of sediment on fish respiratory performance using respirometry. Field-based studies have previously used gut content analysis to determine the influence of SS on the type and amount of prey consumed by brown trout in the wild (Stuart-Smith et al. Citation2004; Yard et al. Citation2011). However, the current study is the first to measure the effects of SS on the feeding rates of brown trout through laboratory-based experiments. Based on the SS concentrations required to cause gill damage in other salmonids (> 40,000 mg L–1 in coho salmon; Lake & Hinch Citation1999), it is hypothesised that sediment concentrations lower than 600 mg L–1 will have no effect on the oxygen consumption of brown trout. SS concentrations as low as 85 mg L–1 have been found to impair feeding in other salmonid species (steelhead trout, Salmo gairdneri, and coho salmon; Sigler et al. Citation1984), and it is predicted that SS concentrations between 150 mg L–1 and 600 mg L–1 will reduce the feeding rates of brown trout.
Methods
Test fish and husbandry
One-year-old brown trout (mean weight = 3.63 g ± 0.09; mean length = 73.44 mm ± 0.26) were sourced from the Montrose Fish & Game Hatchery in North Canterbury. Fish were transported from the hatchery to the laboratory in buckets, and upon arrival were transferred to 60 L flow-through holding tanks (20 fish per tank). Fish were acclimated to laboratory conditions for 10 to 15 days during which water temperature (14 °C) and photoperiod (0800–2000 h light:2000–0800 h dark) were kept constant. Light was provided by five 60 Hz, 400 W metal halide lamps (EF40400MSM, GE Hungary, Budapest, Hungary). Fish were fed with live Daphnia spp. every day at 1200 h.
Sediment source and concentrations
Suspended sediment concentrations recorded after excavation of macrophytes in Waituna Creek, located in the catchment of Waituna Lagoon in Southland, New Zealand (Greer Citation2014), were recreated in the laboratory using sediment sourced from the Halswell River in Canterbury New Zealand (43°39′42.74″S 172°32′37.47″E). This sediment closely matched sediment found in the lower Waituna Creek in terms of both particle size distribution and organic content (Golder Associates Limited Citation2012; Greer Citation2014). Despite these similarities, turbidity in this study was on average 75% less than in the Waituna Creek at the same SS concentrations (Greer Citation2014). Sediment was oven-dried and sieved through a 250 µm mesh to remove coarse particulates and ensure material remained in suspension during experiments (Boubée et al. Citation1997). In the feeding and respiratory components of the study fish were exposed to the same five sediment treatments: 0 mg L–1 control; 150 mg L–1 (mean = 40.2 NTU [Nephelometric Turbidity Units] ± 1.560); 300 mg L–1 (mean = 74.7 NTU ± 2.28); 450 mg L–1 (mean = 92.1 NTU ± 2.23); and 600 mg L–1 (mean = 102.1 NTU ± 2.49). Treatment levels were selected to span the range of SS concentrations recorded in the lower reaches of Waituna Creek after excavation of macrophytes (Greer Citation2014).
Respirometry trials
Test apparatus
Oxygen consumption rates (MO2) of brown trout were measured using a semi-closed respirometry system (Leggatt et al. Citation2003; Urbina et al. Citation2012). The system consisted of 10 sealable, cylindrical, glass respirometry chambers (volume = 196 mL) and five header tanks. Water was circulated between the chambers and header tanks (two respirometry chambers per tank) by pumps (max output = 1200 L h–1). Constant water temperature (14 °C ± 0.1) was maintained by submerging the entire system in a temperature-controlled bath regulated by a refrigeration unit (HC-1000A chiller, Hailea, China). Bubblers and air stones kept oxygen saturation at or near 100% in the header tanks. Oxygen concentrations (in mg L–1) within the chambers were measured using planar oxygen sensor spots (5mm PSt3 sensor spots, PreSens, Regensburg, Germany) glued to the interior surface and a fibreoptic oxygen transmitter (Fibox 3 LCD, PreSens, Regensburg, Germany). Planar optodes are a relatively recent innovation, but have been used successfully in past respirometry experiments (Warkentin et al. Citation2007; Cooper et al. Citation2010; Köster et al. Citation2010). Data collected by the transmitter were automatically logged on a PC using PreSens OxyView Software (v2.04, PreSens, Regensburg, Germany). Two-point calibration of the PreSens system was performed daily in oxygen-free water (2% sodium sulphite solution) and air-saturated water.
Experimental procedure
Ten fresh fish were used in each of six respirometry trials (ntotal = 60). In each trial two fish were randomly assigned to each sediment treatment (nper treatment = 12), and exposed to that concentration of SS for 90 min in separate respirometry chambers. Oxygen consumption was measured three times over this period. Prior to sediment exposure, fish were left undisturbed for 2 h to acclimate to the respirometry chambers (acclimation time determined by preliminary trials). During this time, clean aerated water was pumped through the chambers from the header tanks at a rate of 100 mL min–1. After acclimation, a stock solution of aerated sediment was added to each of the header tanks to bring SS concentrations in the chambers to the treatment level. The chambers were then sealed and oxygen concentrations within were measured. Oxygen concentrations were measured again 20 min later and the difference used to calculate MO2. The chambers were then opened and refreshed with aerated water at a rate of 100 mL min–1 for 10 min. This process was repeated between 30 and 50 min and between 60 and 80 min. To measure and account for sediment oxygen demand and bacterial oxygen consumption in the source water, all trials were repeated without fish in the chambers (controls). At the end of each trial fish were weighed and measured. Respirometry trials were conducted with the permission of the Otago University Animal Ethics Committee, and conducted in accordance with the University of Otago Code of Ethical Conduct.
MO2
For each of the three oxygen measurements taken from individual fish the rate of oxygen consumption (MO2 [mg O2 g–1 min–1]) was calculated using:
Data exploration and analysis
The Shapiro-Wilk test was used to test MO2, weight and length data for the assumption of normality before statistical analyses were conducted. A Levene's test of equality of error variances was also run to test MO2, weight and length data for the assumption of homogeneity of variance. All assumptions were met. One-way ANOVAs were used to compare the mean weights and lengths of fish between the five different sediment treatments. A two-way repeated measures ANOVA (rep-ANOVA) was used to compare the mean MO2 of fish exposed to the different sediment treatments. The three MO2 measurements taken per fish were treated as a within-subject factor (repeated measure), and sampling date (block factor) and sediment treatment were treated as between-subjects factors.
Feeding trials
Test apparatus
Feeding trials were conducted in five glass tanks in a temperature-controlled room (14 °C ± 0.1). The tanks were 22.5 cm wide by 45.5 cm long, and water depth was 9.75 cm (volume = 10 L). Light was provided by five 60 Hz, 400 W metal halide lamps (EF40400MSM, GE Hungary, Budapest, Hungary). Sediment in the tanks was kept in suspension by overhead stirring units (Eurostar digital, IKA WORKS, Inc. Wilmington, NC, USA) equipped with four-blade propeller stirrers (5 cm diameter) positioned at the centre of the tank, 2 cm above the floor. The propellers spun at 125 revolutions per minute (rpm), the maximum speed at which fish were able to maintain their position in the water column without noticeable increases in exertion. Decreases in SS over the trial periods were negligible (mean decrease in turbidity at 150 mg L−1 = 5.35% ± 0.41, 300 mg L−1 = 5.55% ± 0.54, 450 mg L−1 = 6.23 ± 0.62, 600 mg L−1 = 7.29 ± 0.59; measured with a U-50 series water quality meter, Horiba, Kyoto, Japan). Water in the tanks was kept aerated by bubblers and air stones, which also aided sediment resuspension.
Experimental procedure
Ten feeding trials were conducted on consecutive days using five fresh fish in each trial (ntotal = 50). In each trial one fish was randomly assigned to each of the five sediment treatments (nper treatment = 10). Preliminary results indicated that 24 h of starvation was sufficient to eliminate all traces of prey from the gut, and fish were not fed for 48 h before being used in the experiments. After being placed in the tanks, fish were left undisturbed in clear water for 22 h to acclimate to the feeding tanks (Rowe & Dean Citation1998). A stock solution of aerated sediment was then added to each tank to bring SS concentrations to the treatment level. Fish were left for a further 2 h to acclimate to the sediment (Rowe & Dean Citation1998). Preliminary trials determined that in clear water trout could eat up to 90 Daphnia spp. in 30 min. At the start of each experiment 100 Daphnia spp. (1–2 mm in length) were placed in each tank. Trout were then left to feed undisturbed for 30 min, after which they were quickly netted and euthanised (Rowe & Dean Citation1998). Fish were then weighed and measured for total length. The alimentary canal was dissected out and Daphnia spp. in the buccal cavity, oesophagus, stomach and intestine were counted under a dissecting microscope (Rowe & Dean Citation1998). Feeding trials were conducted with the permission of the Otago University Animal Ethics Committee, and in accordance with the University of Otago code of ethical conduct.
Data exploration and analysis
The Shapiro-Wilk test was used to ensure feeding, weight and length data met assumption of normality before statistical analyses were conducted. A one-way blocked ANOVA was used to compare the feeding rates (number of prey min−1) of fish exposed to the five different sediment treatments. Sediment treatment was treated as a fixed factor and sampling date (block factor) was treated as a random factor. One-way ANOVAs were used to compare the mean weights and lengths of fish in the different treatment groups. Fisher’s least significant difference (LSD) post hoc pairwise comparisons were used to compare differences in feeding rates between individual treatment groups.
Results
Respirometry trials
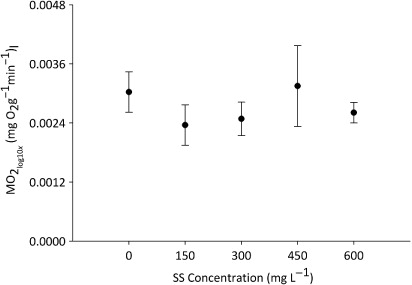
Weights (2.3–6.7 g) and lengths (63–89 mm) of fish used in the respirometry experiments did not differ significantly between sediment treatments (one-way ANOVA weight, F4 = 1.709, P = 0.148, F4 = 1.728, P = 0.157). No statistically significant differences in MO2 were observed between sediment treatments (rep-ANOVA [between-subjects factor], F4 = 6.53, P = 0.627, partial eta squared = 0.050) (). MO2 differed significantly between the 10 days on which sampling was conducted (rep-ANOVA [between-subjects factor] F4 = 3.997, P = 0.004). Further exploration of the raw data found no correlation between MO2 and SS concentration (R = 0.003). Therefore, it is unlikely that variation in individual MO2 masked the effects of sediment on the respiratory performance of brown trout.
Feeding trials
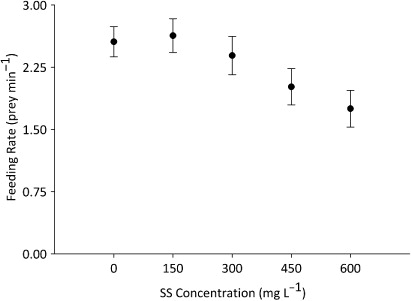
Weights (1.85–5.68 g) and lengths (32–90 mm) of fish did not differ significantly between sediment treatments (one-way ANOVA weight, F4 = 2.084, P = 0.099, one-way ANOVA length F4 = 0.998, P = 0.418). Mean feeding rates differed significantly between the different sediment treatments (one-way ANOVA, F4 = 6.812, P < 0.001) (). Feeding rate did not differ significantly between the 10 days on which sampling was conducted (one-way blocked ANOVA [random factor] F9 = 1.024, P = 0.44). The mean feeding rate at 450 mg L−1 of SS (2.01 prey min−1 ± 0.22) was significantly lower than at 0 mg L−1 (2.55 prey min−1 ± 0.18) and 150 mg L−1 (2.63 prey min−1 ± 0.20) (Fisher’s LSD pairwise comparisons, 450 mg L−1 vs. 0 mg L−1 P = 0.011; 450 mg L−1 vs. 150 mg L−1 P = 0.004). The mean feeding rate of fish exposed to 600 mg L−1 of SS (1.75 prey min−1 ± 0.22) was significantly lower than those exposed to 0 mg L−1, 150 mg L−1 and 300 mg L−1 (2.39 prey min−1 ± 0.23) () (Fisher’s LSD pairwise comparisons, 600 mg L−1 vs. 0 mg L−1 P < 0.001; 600 mg L−1 vs. 150 mg L−1 P < 0.001; 600 mg L−1 vs. 300 mg L−1 P = 0.003).
Discussion
Effects of SS on respiratory performance
It was hypothesised that SS concentrations up to 600 mg L−1 would have no effect on the respiratory performance of brown trout. This prediction was supported by the results and MO2 did not differ significantly between fish exposed to the five sediment treatments. The lack of difference in MO2 across the range of sediment concentrations tested is not surprising in the light of past research on this topic (Lake & Hinch Citation1999). Gill damage has been observed in salmonids (coho salmon) after short-term exposure to sediment, but only at concentrations exceeding 40,000 mg L−1 (Lake & Hinch Citation1999). Therefore, it is unlikely that gill damage would have occurred at the sediment concentrations tested in this study given that trout were exposed to relatively short duration of low SS concentrations.
The results of this study may reflect the limitations in its design rather than the effects of SS on brown trout respiration. After real-world drainage operations fish are exposed to elevated SS concentrations for far longer than they were in this study (1.5 h). Initially, it was intended that brown trout would be exposed to test SS concentrations for 72 h. However, to keep the sediment in suspension for this length of time, a combination of manual agitation, bubblers, pumps and magnetic stirrers was required. This generated a significant source of potential stress, and a number of fish jumped out of the exposure tanks when this was attempted. Hence, the decision was made to forgo an extended exposure period, which may have influenced the results.
Effects of SS on feeding rate
It was hypothesised that SS concentrations between 150 mg L−1 and 600 mg L−1 would reduce the feeding rates of brown trout. This prediction was supported by statistically significant decreases in feeding rates at 450 mg L−1 and 600 mg L−1 of SS. Concentrations above 450 mg L−1 were regularly recorded following large-scale macrophyte removal in the catchment of Waituna Lagoon (Greer Citation2014) and our results indicate that this activity may affect feeding in resident brown trout populations.
Suspended sediment most likely reduced the feeding rates of brown trout in one of two ways (Bilotta & Brazier Citation2008). The first is reduced foraging behaviour in response to physiological stress. In high SS concentrations both steelhead trout and coho salmon cease or reduce surface-feeding behaviours and become less aggressive during feeding attempts (Redding et al. Citation1987). Similarly, relatively low sediment concentrations (180 mg L−1) have been found to reduce foraging activity of juvenile Atlantic salmon (Salmo salar) (Robertson et al. Citation2007). As SS did not affect brown trout MO2, reduced feeding is probably not a physiological response to sediment, and is likely the result of reduced water clarity.
For visual foragers such as salmonids, SS-driven increases in turbidity severely impede feeding ability by reducing the distance at which they can detect prey (Hazelton & Grossman Citation2009a; Kemp et al. Citation2011). Barrett et al. (Citation1992) determined that the reactive distance of rainbow trout (Oncorhynchus mykiss) is reduced by 65% when SS increases turbidity from 5 NTU to 30 NTU. Reduced feeding performance in high-sediment environments is driven by associated increases in turbidity rather than the mass concentration of suspended material (Bruton Citation1985; Hazelton & Grossman Citation2009a). The relationship between SS and turbidity varies between sediment sources and is determined by the shape, light-absorbing properties and refractive index of suspended particulates (Davies-Colley & Smith Citation2001). Turbidities in the sediment solutions used in this study were, on average, 75% lower than those recorded at the same concentrations in Greer (Citation2014). Therefore, it is likely that the SS concentrations recorded after mechanical excavation of macrophytes (Greer Citation2014) had a greater influence on feeding rates of brown trout than was observed in this study.
Whatever the cause, reduced feeding in high-sediment environments after mechanical excavation of macrophytes may have significant impacts on brown trout health. Sigler et al. (Citation1984) determined that SS concentrations of 426 mg L−1 are sufficient to decrease feeding to the point that steelhead trout and coho salmon growth rates are reduced. Similarly, Shaw & Richardson (Citation2001) found that regular sediment pulses of 704 mg L−1 impair rainbow trout vision, thereby reducing prey capture success, which in turn reduces growth rates. In addition, Rowe et al. (Citation2003) found that, even when feeding rates are unaffected, high turbidity can reduce the ability of juvenile rainbow trout to select large prey and/or reject small prey. The reduced selection of large prey in high turbidities may affect salmonid growth rates, as the return on energy expended during feeding is expected to decrease with prey size (Rowe et al. Citation2003). The effects of reduced feeding performance on brown trout health is likely to be amplified by the reduced abundance of invertebrate prey at the SS concentrations recorded after excavation in Greer (Citation2014; Quinn et al. Citation1992).
It is unclear whether reduced feeding rates in high-SS concentrations affect brown trout abundance after mechanical excavation of macrophytes. However, a number of salmonid species have been found to leave high-sediment environments (Bisson & Bilby Citation1982; Sigler et al. Citation1984; Robertson et al. Citation2007), allowing them to attain faster growth rates than individuals that remain (Sigler et al. Citation1984). Therefore, persistent increases in SS concentrations after excavation (Greer Citation2014) may reduce brown trout abundance in treated waterways by forcing individuals to leave in search of better feeding habitat and slowing recolonisation.
The results of this research highlight the need for future research to develop techniques for reducing sediment resuspension during macrophyte removal. Dense macrophyte stands act as sediment traps, encouraging the deposition and retention of suspended material (Jones et al. Citation2012). Consequently, leaving sections of waterway unexcavated may reduce downstream transport of suspended sediment during and after macrophyte removal. Future research could focus on determining whether the effects of large macrophyte removal operations on SS can be reduced without impeding drainage outfall, by maintaining sections of macrophyte beds or employing artificial sediment traps.
Associate Editor: Dr Joanne Clapcott.
Acknowledgements
Funding for this project was provided by the NIWA funded Sustainable Water Allocation Programme. We would like to thank North Canterbury Fish & Game for providing fish for this study, and NIWA for the use of facilities and equipment.
References
- Barrett JC, Grossman GD, Rosenfeld J 1992. Turbidity-induced changes in reactive distance of rainbow trout. Transactions of the American Fisheries Society 121: 437–443.10.1577/1548-8659(1992)121<0437:TICIRD>2.3.CO;2
- Bilotta GS, Brazier RE 2008. Understanding the influence of suspended solids on water quality and aquatic biota. Water Research 42: 2849–2861.10.1016/j.watres.2008.03.018
- Bisson PA, Bilby RE 1982. Avoidance of suspended sediment by juvenile coho salmon. North American Journal of Fisheries Management 2: 371–374.10.1577/1548-8659(1982)2<371:AOSSBJ>2.0.CO;2
- Boubée JAT, Dean TL, West DW, Barrier RFG 1997. Avoidance of suspended sediment by the juvenile migratory stage of six New Zealand native fish species. New Zealand Journal of Marine and Freshwater Research 31: 61–69.
- Bruton MN 1985. The effects of suspensoids on fish. Hydrobiologia 125: 221–241.10.1007/BF00045937
- Cooper TF, Dandan SS, Heyward A, Kühl M, McKinney DW, Moore C et al. 2010. Characterising the genetic connectivity and photobiology of deep water reef-building corals at South Scott Reef, Western Australia. Perth, Australian Institute of Marine Science.
- Davies-Colley RJ, Smith DG 2001. Turbidity suspended sediment, and water clarity: a review 1. Journal of the American Water Resources Association 37: 1085–1101.10.1111/j.1752-1688.2001.tb03624.x
- Garric J, Migeon B, Vindimian E 1990. Lethal effects of draining on brown trout. A predictive model based on field and laboratory studies. Water Research 24: 59–65.10.1016/0043-1354(90)90065-E
- Golder Associates Limited. 2012. Canterbury regional urban stream sediment and biofilm quality survey. Report No. 1078105525. Christchurch, Golder Associates Limited.
- Greer MJC 2014. The effects of macrophyte control on freshwater fish communities and water quality in New Zealand streams. Unpublished thesis. Dunedin, University of Otago. 147 p.
- Greer MJC, Closs GP, Crow SK, Hicks AS 2012. Complete versus partial macrophyte removal: the impacts of two drain management strategies on freshwater fish in lowland New Zealand streams. Ecology of Freshwater Fish 21: 510–520.10.1111/j.1600-0633.2012.00569.x
- Hazelton PD, Grossman GD 2009a. The effects of turbidity and an invasive species on foraging success of rosyside dace (Clinostomus funduloides). Freshwater Biology 54: 1977–1989.10.1111/j.1365-2427.2009.02248.x
- Hazelton PD, Grossman GD 2009b. Turbidity, velocity and interspecific interactions affect foraging behaviour of rosyside dace (Clinostomus funduloides) and yellowfin shiners (Notropis lutippinis). Ecology of Freshwater Fish 18: 427–436.10.1111/j.1600-0633.2009.00359.x
- Hudson HR, Harding JS 2004. Drainage management in New Zealand: a review of existing activities and alternative management practices. Science for Conservation 235: 1–39.
- Jones JI, Collins AL, Naden PS, Sear DA 2012. The relationship between fine sediment and macrophytes in rivers. River Research and Applications 28: 1006–1018.10.1002/rra.1486
- Kemp P, Sear D, Collins A, Naden P, Jones I 2011. The impacts of fine sediment on riverine fish. Hydrological Processes 25: 1800–1821.10.1002/hyp.7940
- Köster M, Paffenhöfer GA, Baker CV, Williams JE 2010. Oxygen consumption of doliolids (Tunicata, thaliacea). Journal of Plankton Research 32: 171–180.
- Lake RG, Hinch SG 1999. Acute effects of suspended sediment angularity on juvenile coho salmon (Oncorhynchus kisutch). Canadian Journal of Fisheries and Aquatic Sciences 56: 862–867.10.1139/f99-024
- Leggatt RA, Devlin RH, Farrell AP, Randall DJ 2003. Oxygen uptake of growth hormone transgenic coho salmon during starvation and feeding. Journal of Fish Biology 62: 1053–1066.10.1046/j.1095-8649.2003.00096.x
- Maitland PS 1995. The conservation of freshwater fish: past and present experience. Biological Conservation 72: 259–270.
- Quinn JM, Davies-Colley RJ, Hickey CW, Vickers ML, Ryan PA 1992. Effects of clay discharges on streams. Hydrobiologia 248: 235–247.10.1007/BF00006150
- Redding JM, Schreck CB, Everest FH 1987. Physiological effects on coho salmon and steelhead of exposure to suspended solids. Transactions of the American Fisheries Society 116: 737–744.10.1577/1548-8659(1987)116<737:PEOCSA>2.0.CO;2
- Robertson MJ, Scruton DA, Clarke KD 2007. Seasonal effects of suspended sediment on the behavior of juvenile Atlantic salmon. Transactions of the American Fisheries Society 136: 822–828.10.1577/T06-164.1
- Rowe DK, Dean TL 1998. Effects of turbidity on the feeding ability of the juvenile migrant stage of six New Zealand freshwater fish species. New Zealand Journal of Marine and Freshwater Research 32: 21–29.10.1080/00288330.1998.9516803
- Rowe DK, Dean TL, Williams E, Smith JP 2003. Effects of turbidity on the ability of juvenile rainbow trout, Oncorhynchus mykiss, to feed on limnetic and benthic prey in laboratory tanks. New Zealand Journal of Marine and Freshwater Research 37: 45–52.10.1080/00288330.2003.9517145
- Rowe DK, Hicks M, Smith JP, Williams E 2009. Lethal concentrations of suspended solids for common native fish species that are rare in New Zealand rivers with high suspended solids loads. New Zealand Journal of Marine and Freshwater Research 43: 1029–1038.10.1080/00288330.2009.9626526
- Ryan PA 1991. Environmental effects of sediment on New Zealand streams: a review. New Zealand Journal of Marine and Freshwater Research 25: 207–221.10.1080/00288330.1991.9516472
- Scheurer K, Alewell C, Bänninger D, Burkhardt-Holm P 2009. Climate and land-use changes affecting river sediment and brown trout in alpine countries—a review. Environmental Science and Pollution Research 16: 232–242.10.1007/s11356-008-0075-3
- Shaw EA, Richardson JS 2001. Direct and indirect effects of sediment pulse duration on stream invertebrate assemblages and rainbow trout (Oncorhynchus mykiss) growth and survival. Canadian Journal of Fisheries and Aquatic Sciences 58: 2213–2221.10.1139/f01-160
- Sigler JW, Bjornn TC, Everest FH 1984. Effects of chronic turbidity on density and growth of steelheads and coho salmon. Transactions of the American Fisheries Society 113: 142–150.10.1577/1548-8659(1984)113<142:EOCTOD>2.0.CO;2
- Stuart-Smith RD, Richardson AMM, White RWG 2004. Increasing turbidity significantly alters the diet of brown trout: a multi-year longitudinal study. Journal of Fish Biology 65: 376–388.10.1111/j.0022-1112.2004.00456.x
- Sutherland AB, Meyer JL 2007. Effects of increased suspended sediment on growth rate and gill condition of two southern Appalachian minnows. Environmental Biology of Fishes 80: 389–403.10.1007/s10641-006-9139-8
- Urbina MA, Glover CN, Forster ME 2012. A novel oxyconforming response in the freshwater fish Galaxias maculatus. Comparative Biochemistry and Physiology 161: 301–306.10.1016/j.cbpa.2011.11.011
- Warkentin M, Freese HM, Karsten U, Schumann R 2007. New and fast method to quantify respiration rates of bacterial and plankton communities in freshwater ecosystems by using optical oxygen sensor spots. Applied and Environmental Microbiology 73: 6722–6729.10.1128/AEM.00405-07
- Yard MD, Coggins LG, Baxter CV, Bennett GE, Korman J 2011. Trout piscivory in the Colorado River, Grand Canyon: effects of turbidity, temperature, and fish prey availability. Transactions of the American Fisheries Society 140: 471–486.10.1080/00028487.2011.572011
- Young RG, Keeley NB, Shearer KA, Crowe ALM 2004. Impacts of diquat herbicide and mechanical excavation on spring-fed drains in Marlborough, New Zealand. Science for Conservation 240: 1–36.