
Abstract
Boat-based surveys of Hector's dolphins (Cephalorhynchus hectori) were conducted throughout 2013 to evaluate their distribution and abundance off Kaikoura. We conducted a total of 48 surveys and encountered 164 groups of Hector's dolphins. This study showed that Hector's dolphins off Kaikoura preferred areas of shallow, nearshore waters with poor water clarity and that there were more sightings to the north of the Kaikoura Peninsula than to the south. Using photo-identification techniques we identified 47 distinct individuals within the study area and these known individuals were only sighted either north or south of the Kaikoura Canyon. This study, combined with opportunistic sightings data collected from 2005–2013, improves our understanding of habitat use within the Kaikoura area by Hector's dolphins. These data suggest that the canyon area, characterised by very deep waters, could act as a natural barrier dividing the Hector's dolphins off Kaikoura into two separate groups.
Introduction
Understanding the distribution and relative abundance of an endangered species is critically important to its conservation. By elucidating the particular set of conditions that define preferred habitat, managers are better able to design area-based management plans that are effective in reducing human-related threats in specifically defined areas (Hoyt Citation2005).
Hector's dolphins (Cephalorhynchus hectori) are a small, coastal delphinid, found only in New Zealand waters. They tend to show a preference for shallow and murky waters with less than 4 m Secchi disc visibility and with temperatures greater than 14 °C, and are frequently found near the mouths of rivers (Dawson & Slooten Citation1988; Bräger & Schneider Citation1998; Bräger et al. Citation2002). Individuals have small home ranges of approximately 30–50 km along shore, and show high site fidelity (Bräger et al. Citation2003; Rayment et al. Citation2009). Although previous studies suggested that the majority of the population keeps within a few kilometres of shore (Bräger et al. Citation2003), recent aerial surveys of the east coast of the South Island of New Zealand found that approximately half and three-quarters of the population occur beyond 4 nmi (7.4 km) offshore in the summer and winter months respectively (MacKenzie & Clement Citation2014). This shift further offshore in winter has also been documented in Clifford and Cloudy Bays (DuFresne & Mattlin Citation2009) and off the west coast of the South Island (Rayment et al. Citation2010).
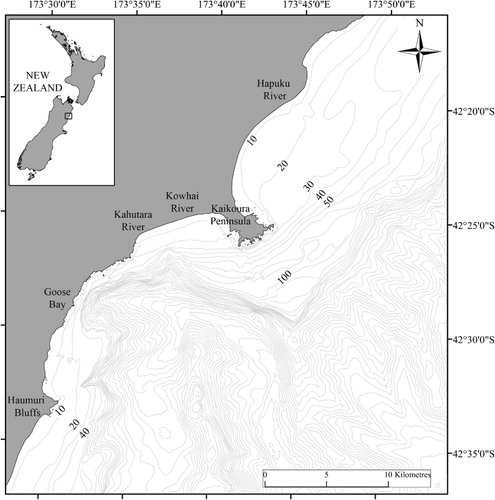
The Hector's dolphin is classified as Endangered nationally by the New Zealand Department of Conservation (Baker et al. Citation2010) and internationally by the International Union for Conservation of Nature (IUCN Citation2010), with accidental entanglement in set and trawling nets being the primary causes of population decline (Currey et al. Citation2012; Slooten & Dawson Citation2010). In 1988, the Banks Peninsula Marine Mammal Sanctuary was established to regulate fishing and consequently reduce dolphin mortality. The sanctuary has been effective in improving the survival rate of Hector's dolphins in this area (Gormley et al. Citation2012). In 2008, further protection measures were implemented to cover a larger portion of the dolphin's range (Slooten Citation2013). Along the east coast of the South Island, a set net exclusion zone extending to 4 nmi from shore was instated with exemptions in some areas to minimise impact on the commercial fishing industry (Ministry of Fisheries Citation2008). For example, south of the Kaikoura Peninsula there is an open ocean embayment and a deep underwater canyon that extends to within 200 m of shore and reaches depths of over 1400 m (Lewis & Barnes Citation1999; ). Over the Upper Kaikoura Canyon, where the water is deeper than 30 m within 1 km of shore, the set net ban extends to 1 nmi from shore. North of the Kaikoura Peninsula, the bathymetry is quite different than that to the south, with shallow waters (< 30 m) extending to c. 7 km of shore.
To date, the most comprehensive study of Hector's dolphins off Kaikoura was conducted by Bräger (Citation1998) from 1994–1996. Using a combination of boat-based surveys and photo-identification techniques, he was able to describe the habitat use patterns of Hector's dolphins in this area (Bräger Citation1999; Bräger et al. Citation2003). Photo-identification is a non-invasive way of identifying individuals and can yield valuable information on population size, distribution, critical habitat and social structure (Ingram & Rogan Citation2002; Whitehead Citation2008; Gomez-Salazar et al. Citation2011) and this method is widely used in Hector's dolphin research (e.g. Slooten et al. Citation1992; Bejder & Dawson Citation2001; Gormley et al. Citation2005; Rayment et al. Citation2009; Turek et al. Citation2013).
In this study we aim to document the current distribution and abundance of Hector's dolphins off Kaikoura in order to provide updated information of where this species occurs relative to oceanographic features and the current set net exclusion zone.
Methods
Boat-based fieldwork
Boat-based surveys north (n = 23) and south (n = 25) of the Kaikoura Peninsula (42°30′S, 173°32′E; ) were conducted every 2 weeks throughout 2013 when sea-state conditions were less than Beaufort 2. The vessel used was a 5.5 m long semi rigid hull boat, powered by a four-stroke 80 hp engine. The survey routes were programmed into a handheld Garmin 76 GPS unit and followed at a speed of 10–20 knots. This speed, also used by Bräger et al. (Citation2003), was selected as it prevented dolphins from following the research boat and prevented repeat sightings of the same individual within a survey. On each survey day, the route was followed until a Hector's dolphin group was sighted and, at each group encounter, a GPS location was recorded using the GPS unit. At each sighting we recorded water clarity to within 50 cm using a Secchi disc and the maximum number of dolphins counted at one time during the encounter was recorded as the group size at the end of each encounter. Photographs were taken of all individuals within the group, using a high-speed digital SLR camera (Nikon D90 with vibration reduction and 70–300 mm lens). To ensure that all individuals in a group had a high (> 95%) chance of being photographed, a minimum of four photographs per dolphin were taken (Ballance Citation1990; Würsig & Jefferson Citation1990; Bejder & Dawson Citation2001; Turek et al. Citation2013).
Distribution
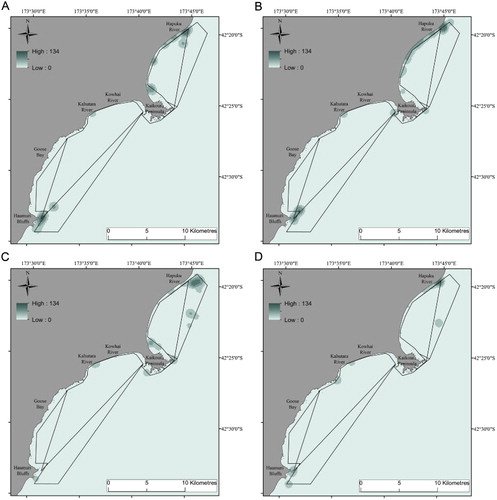
Data sorting, statistical analyses, spatial analyses and figure production were performed in Microsoft Excel 2010, R 3.0.2 (R Core Development Team Citation2013) and ArcGIS 10.2. All map features (coastline map, bathymetric chart and data layers) were imported using the coordinate system WGS 84. To increase positional accuracy, the data frame was subsequently changed to the data frame NZ UTM 59S. The positions of each dolphin group (latitude and longitude at first encounter) were imported and overlaid onto a coastline base map and a bathymetric chart supplied courtesy of the National Institute of Water and Atmospheric Research, New Zealand (NIWA). The bathymetry vector contour dataset was classified with a contour interval of 10 m in depths less than 200 m and a contour interval of 50 m in depths greater than 200 m. To determine the distance between each group sighting and the nearest coastline, a spatial proximity analysis was performed using the ‘near analysis’ tool in ArcGIS and by calculating the distance from each sighting to the closest point on the coastline base map. The near analysis tool was also used to determine the depth category for each sighting. To calculate encounter rates, survey effort (in km) was calculated for each distance and depth category using the ‘measuring’ tool in ArcGIS. Chi-square analyses of potential differences between proportions were performed to statistically compare the proportion of encounters between seasonal, depth and distance-from-shore categories, while accounting for effort in each category. Local ‘hotspots’ for Hector's dolphins were illustrated by mapping the density of sightings over the 12 months and by season using the Kernel density tool in ArcGIS. Sightings information collected south of the Kaikoura Peninsula in 2005–2006 and 2012 by J Weir, and in 2007–2013 by a local ecotourism operator, were compiled and presented on a map that included the current set net exclusion zone boundaries.
Photographic identification catalogue
All photographs were labelled and categorised by the quality of the photograph. High-quality photographs that included marked dorsal fins were assigned to one of three categories of mark quality (Slooten et al. Citation1992; Gormley et al. Citation2005; Turek et al. Citation2013). Only individuals with obvious and distinctive markings, who would have been unlikely to have been missed in the field, and were sighted at least once in 2013, were included in the final catalogue (KRHD 2013 Catalogue). To examine long-term site fidelity, photographs taken off Kaikoura in 1995–1998 (Bräger Citation1998) and 2005–2012 (J Weir, unpubl. data) were also sorted and checked for matches to individuals in the KRHD 2013 Catalogue.
To estimate the number of Hector's dolphins using the study area between January and December 2013, we calculated an estimate of mark rate during ‘random photography’ sessions. In instances when it was difficult to ensure that all individuals had been photographed (e.g. due to the extensive spread of the group over a large area or in other conditions where photography of individuals was very difficult), this was noted in the corresponding comments section and subsequently not used in mark rate calculation. To estimate the proportion identifiable (mark rate), we divided the number of photos of distinct individuals by the number of useable photos (frames showing dolphins and of quality to have shown a mark if one was there). We then applied this mark rate to the number of individuals in the KRHD 2013 Catalogue to account for the unmarked proportion of the population in the abundance estimate.
To examine the distribution of particular individuals, we mapped the locations of encounters with all individuals in the KRHD 2013 Catalogue throughout the 2013 surveys. To illustrate seasonal presence of known individuals, we created a table of sightings by season—summer (December–February), autumn (March–May), winter (June–August), spring (September–November)—for individuals in the KRHD Catalogue that were photographed on at least 3 separate days in 2013.
Results
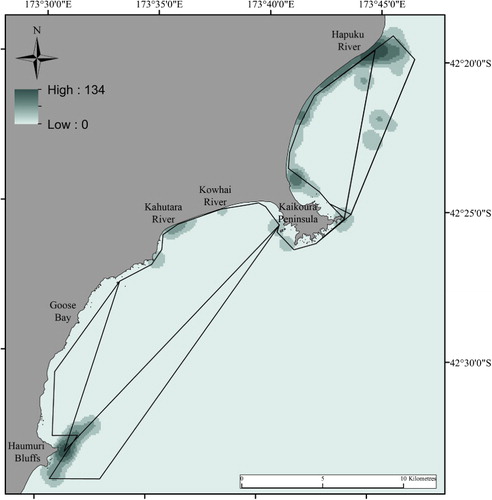
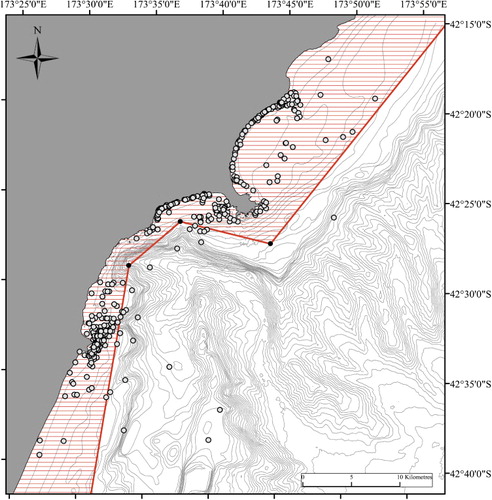
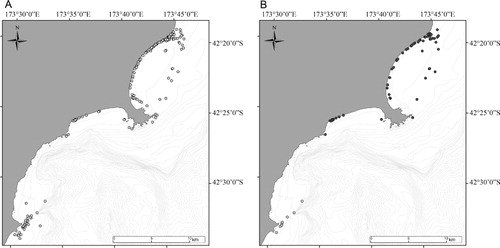
Between January and December 2013, we completed 23 surveys to the north of the Kaikoura Peninsula and 25 surveys to the south for a total of 1908 km of survey effort. A total of 164 groups of Hector's dolphins were encountered during these 48 surveys (mean group size = 5.6, SEM = 0.89, range 1–18). Accounting for effort, significantly more groups (χ2 = 62.74, P < 0.001) were encountered to the north of the Kaikoura Peninsula than to the south. The area with the highest density of sightings in 2013 (number of dolphins encountered) was the Hapuku River mouth, followed by Haumuri Bluffs (). Of the 17 groups that included at least one calf, all but one were encountered north of the Kaikoura Peninsula. shows the distribution of Hector's dolphin groups encountered south of the Kaikoura Peninsula from 2005–2013 (463 groups) by researchers and by a local ecotourism operator (204 groups) and current set net regulation boundaries.
Distribution by depth
The greatest number of groups (63.4%) and the greatest number of dolphins (62.7%) were encountered in the 0–10 m depth category (). Accounting for effort, significantly more groups (χ2 = 4.27, P < 0.04) were encountered in the 0–10 m depth category than the 10–20 m depth category (). When the distribution of sightings north and south of the Kaikoura Peninsula were examined separately, the encounter rate for groups in the 0–10 m depth category was significantly greater in the north than in the south (χ2 = 38.28, P < 0.001), and the encounter rate for groups in the 10–20 m category was slightly, but not significantly, greater in the south than in the north (χ2 = 0.50, P = 0.482).
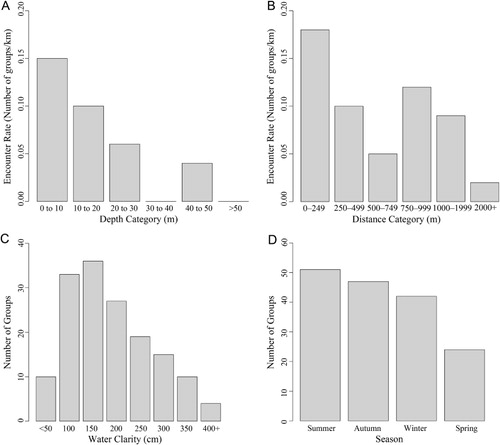
Table 1 Survey (n = 48) effort in km, number of groups and number of dolphins encountered, and encounter rates (ER) for each depth category.
Distribution by distance from shore
The greatest number of groups (45.7%) and the greatest number of dolphins (41.4%) were encountered within 249 m of the shoreline (). Accounting for effort, significantly more groups (χ2 = 8.37, P < 0.01) were encountered within this distance category than within the 250–499 m distance category (). When the distribution of sightings north and south of the Kaikoura Peninsula were examined separately, the encounter rate for groups within 249 m of the shoreline was significantly greater in the north than in the south (χ2 = 63.81, P < 0.001), and the encounter rate for groups in the 250–499 m distance category was significantly greater in the south than in the north (χ2 = 5.07, P < 0.03).
Table 2 Survey (n = 48) effort in km, number of groups and number of dolphins encountered, and encounter rates (ER) for each distance from shore category.
Distribution by water clarity
Nearly all of the groups encountered on survey in 2013 were in waters with a clarity of less than 400 cm from the surface (97.6%). The greatest proportion of groups was encountered in water where the clarity was 150 cm ().
Distribution by season
The greatest number of groups was encountered in the autumn (32.2%) and the least number of groups were encountered in the spring (13.8%; ). The number of dolphins encountered was greater in the summer and autumn months combined than in the winter and spring months combined, as was the number of groups, although the difference was not significant (χ2 = 3.01, P < 0.083). The mean group size was largest in autumn (6.32 SEM ± 0.61), followed by summer (5.61 SEM ± 0.59), spring (5.29 SEM ± 0.68) and winter (5.05 SEM ± 0.60). shows the distribution of Hector's dolphin groups encountered by season. While dolphins were encountered in the areas near Hapuku River mouth and Haumuri Bluffs during all seasons, other localised ‘hotspots’ were only used in particular seasons.
Long-term and seasonal site fidelity
In 2013, 47 individual Hector's dolphins, with obvious and distinct markings, were identified between Hapuku River and Haumuri Bluffs. Of these, 56% were sighted at least twice between October 1995 and December 2013. Two of these individuals have been sighted off Kaikoura over an 18 year timespan. KR 019 has been photographed off Kaikoura in 1995–1997, 2006 and 2010–2013, and KR 023 has been photographed off Kaikoura in 1995–1998, 2006–2008 and 2010–2013. displays the seasonal distribution of individual Hector's dolphins photographed on at least 3 separate survey days in 2013.
Table 3 Seasonal sightings of individual Hector's dolphins photographed on a minimum of 3 days in 2013.
Abundance estimate and distribution of individuals
In 2013, more than 1300 photographs were taken of any dolphins that surfaced in close proximity to the research boat. Of these, 658 were of sufficient quality to determine whether the animal was individually identifiable. From the above, 99 contained distinctive individuals with obvious and distinct marks. The overall mark rate, or proportion identifiable, was estimated to be 0.1547 (SEM = 0.0279, CI = 0.0867–0.2227). This mark rate includes both sexes and all age classes and was applied to our estimate of the number of marked dolphins that formed the final KRHD 2013 Catalogue (47 dolphins). The resulting estimate of the number of Hector's dolphins using the Kaikoura area in 2013, between Hapuku River to the north and Haumuri Bluffs to the south, is 304 individuals (95% CI = 211–542). When the positions of encounters with the 47 distinctive individuals were plotted, 37 individuals of these were only ever photographed to the north of the Kaikoura Canyon, and the remaining 10 individuals were only ever photographed to the south of the Kaikoura Canyon ().
Discussion
In this study, systematic boat-based surveys were used to document the current habitat use patterns of Hector's dolphins off Kaikoura by depth, distance from shore, water clarity and by season. Understanding the fine-scale characteristics of the Hector's dolphin's preferred habitat, including how it relates to local oceanographic features and area-specific management plans, is critically important to the effective conservation of this endangered species. Previously unpublished sightings from boat-based surveys and opportunistic sightings collected by a local ecotourism operator over a 9 year timespan were combined to illustrate the distribution of Hector's dolphin sightings relative to the Kaikoura Canyon and to current set net exclusion zone boundaries. Photo-identification techniques were used to estimate the abundance of Hector's dolphins between Hapuku River and Haumuri Bluffs within 2013 and to elucidate the occurrence of individual dolphins off Kaikoura temporally by year and by season, and geographically in relation to the Kaikoura Canyon.
The distribution of dolphins relative to water depth, water clarity, sea surface temperature (SST) and bottom topography reflects a preference for specific fine-scale habitats separated by transit areas (Bräger et al. Citation2003). Surveys in 2013 indicated that Hector's dolphins off Kaikoura preferred areas within 1 km of shore where depths were less than 30 m and water clarity was less than 4 m. Encounter rates were highest within 249 m of shore and where depths were less than 10 m and water clarity was 150 cm. This distribution is very similar to that reported by Bräger et al. (Citation2003) for surveys undertaken off Kaikoura between October 1995 and April 1997. MacKenzie & Clement (Citation2014) reported that more than half of the east coast South Island population of Hector's dolphins was beyond 7.4 km (4 nmi) of shore. However, the marine environment off Kaikoura differs considerably from all other areas on the east coast of the island. Specifically, water depths drop to over 100 m within a few kilometres of shore over the Kaikoura Canyon whereas throughout other areas of the coast, water depths of less than 100 m extend well beyond 7.4 km offshore. During aerial surveys off Kaikoura specifically, the mean distances offshore for Hector's dolphin sightings were 1.8 km and 4.7 km for summer and winter, respectively, with a maximum of 6.7 km, and the mean depths were 16.3 m and 32.9 m in summer and winter, respectively, with a maximum depth of 50 m (MacKenzie & Clement Citation2014). Similarly, we encountered 87% of groups in waters less than 20 m deep and only two groups were encountered within the 40–50 m depth category. Most groups (72%) were encountered within 5 km of shore.
In our study, there were more sightings to the north of the Kaikoura Peninsula than to the south, and the localised areas with the highest density of sightings were the mouth of the Hapuku River, followed by Haumuri Bluffs. These same patterns were also documented by Bräger (Citation1998) between 16 and 18 years ago, suggesting that the preferred habitat of Hector's dolphins off Kaikoura has remained constant over this time period. The selection of habitat north of the Kaikoura Peninsula reflects the Hector's dolphin's preference for shallow and murky waters, whereas the infrequent sightings over the Kaikoura Canyon reflect their general avoidance of deep waters and those that are less turbid.
Environmental variables such as water depth and water clarity as well as spatial differences in relation to physical features such as river mouths, peninsulas or submarine canyons combine to explain variability in fine-scale site usage and distribution of cetacean species, including Hector's dolphins, off Kaikoura (Cawthorn Citation1988; Bräger & Schneider Citation1998). The observed combinations of factors could be selected for their relative suitability for acquiring sufficient prey, avoiding potential predators and for successful reproduction. The main prey items consumed by Hector's dolphins are red cod (Pseudophycis bachus), ahuru (Auchenocros punctatus), arrow squid (Notodarus sp.), sprat (Sprattus sp.), sole (Peltorhamphus sp.) and stargazer (Crapatalus sp.) (Miller et al. Citation2013). The occurrence and distribution of these species relative to oceanographic features and between different seasons is suggested as one explanation for the observed occurrence and distribution of Hector's dolphins around New Zealand (Slooten & Dawson Citation1994; Dawson & Slooten Citation1988; Bräger et al. Citation2003; Rayment et al. Citation2010). Off Kaikoura, Hector's dolphins were encountered year round; however, there were more encounters during summer and autumn than during winter and spring and this is consistent with patterns documented on the South Island west coast and Banks Peninsula study sites (Rayment et al. Citation2010,Citation 2011). In addition to following the seasonal shift in their prey, Hector's dolphins may prefer shallower nearshore areas in the summer months due to the presence of young calves (Rayment et al. Citation2010). Off Kaikoura, dusky dolphin (Lagenorhynchus obscurus) nursery groups including young calves are encountered most frequently in waters less than 20 m deep (Weir et al. Citation2008). This distribution of dusky dolphin nursery groups suggests a preference for the shallower waters surrounding the Kaikoura Canyon, which allow females opportunities to rest and raise their young with a lower probability of predation or harassment from male conspecifics (Weir et al. Citation2008). Both Hector's dolphins and dusky dolphin nursery groups exhibit a similar distribution relative to depth and the Kaikoura Canyon, indicating the importance of these areas to both delphinid species. In particular, the area north of the peninsula appears to be preferred by Hector's dolphin groups with calves. In addition to the general distribution of Hector's dolphins off Kaikoura, this study revealed the distribution of particular individuals by year, by season and in spatial relation to the Kaikoura Canyon. A total of 47 individuals with obvious and distinctive markings were identified off Kaikoura during surveys conducted in 2013. Similarly, Bräger (Citation1999) identified 48 individuals off Kaikoura in 1994–1997. Two individuals were found to have been photographed off Kaikoura over an 18 year timespan, indicating the long-term site fidelity typical of this species (Bräger et al. Citation2002; Rayment et al. Citation2009). Of the 12 individuals that were photographed on at least 3 separate survey days, all but one were photographed in more than one season, and most were photographed in three (n = 7) or all four seasons (n = 2). Again, this is an illustration of the generally small home range of individual Hector's dolphins (Bräger et al. Citation2002; Rayment et al. Citation2009). No matches were made between photographs taken north and south of the Kaikoura Canyon, which could be an indication that there are two discrete groups of dolphins within this study area. As the area over the Kaikoura Canyon is characterised by very deep waters,and hence does not qualify as preferred or typical Hector's dolphin habitat, it could be that this particular area acts, at least in part, as an oceanographic barrier. Over time, population fragmentation can lead to decreased genetic exchange and population viability; this has been suggested as a significant threat to Hector's dolphins around the South Island and to Maui's dolphins around the North Island (Dawson & Slooten Citation1988; Hamner et al. Citation2012, Citation2013; Turek et al. Citation2013). Although there were no photographic matches made north and south of the Kaikoura Canyon, Hector's dolphins are occasionally sighted within this particular area () and this suggests that, while the canyon area is not preferred habitat, it likely serves as an important transit area for maintaining genetic connectivity between the two areas. Hector's dolphin sightings information from 2005–2013 indicates that the current boundaries of the set net exclusion zone off Kaikoura offer protection throughout most of the dolphin's local preferred habitat, and, as such, are an effective management tool for reducing human-caused mortality. However, there are certain areas where fishing activities still overlap with Hector's dolphin habitat (). Slight modifications to the boundary area would further reduce the potential for direct encounters between Hector's dolphins and fishing operations.
Finally, our abundance estimate of 304 individuals (95% CI = 211–542) assumes both population closure over the 12 month period and that all identifiable individuals were encountered. Given that there were no photographic matches made north and south of the canyon, it is likely that these assumptions have not been met and that 304 is not an estimate for a particular subpopulation of dolphins but rather an approximation of the number of dolphins using the study area between Haumuri Bluffs and the Hapuku River in 2013. It is possible that our estimate actually includes subsets of both a southern and a northern population and further investigations to cover a longer stretch of coastline in the greater area are needed to more accurately estimate the sizes of subpopulations. Nonetheless, it is interesting to note that the abundance estimates calculated from aerial survey work off Kaikoura in 2013 were quite similar to our estimate, with 358 and 216 individuals estimated in summer and winter, respectively (MacKenzie & Clement Citation2014).
We recommend pursuing regular boat-based and photographic monitoring of Hector's dolphins off Kaikoura in order to detect any changes over time, and to further decipher the distribution patterns of individuals over temporal and spatial scales. In addition, genetic monitoring in this area, beginning in 2014 and continuing in 2015, will help to reveal the relevant importance of the Kaikoura Canyon as a corridor for gene flow that potentially links adjacent populations (Hamner et al. Citation2013).
In conclusion, this study improved our existing knowledge on how Hector's dolphins use the available habitat off Kaikoura through a combination of boat-based surveys, photo-identification techniques and a synthesis of opportunistic sightings data. This study highlighted the possible presence of two discrete groups of dolphins within the Kaikoura study area and this new knowledge should be considered in conservation efforts.
Acknowledgements
We are grateful to the Encounter Foundation and to the Department of Conservation for funding this project. Encounter Kaikoura and Dennis Buurman provided both opportunistic sightings data and photographs collected onboard their vessels, which greatly improved the scope of this study. Special thanks to Kaikoura Ocean Research Institute (KORI) research assistants Alastair Judkins, Cat Peters, Courtnay Wilson, Holly Wheatley-Hammond and Barbara Todd for their assistance with this project, and to Bernd Würsig and the Dusky Dolphin Research Project for use of their survey vessel. An ESRI Conservation Grant awarded to KORI provided the ArcGIS 10.2 software used in this research.
Additional information
Funding
References
- Baker CS, Chilvers BL, Constantine R, DuFresne S, Mattlin RH, van Helden A et al. 2010. Conservation status of New Zealand marine mammals (suborders Cetacea and Pinnipedia), 2009. New Zealand Journal of Marine and Freshwater Research 44: 101–115.
- Ballance LT 1990. Residence patterns, group organization, and surfacing associations of bottlenose dolphins in Kino Bay, Gulf of California, Mexico. In: Leatherwood S, Reeves RR eds. The bottlenose dolphin. San Diego, CA, Academic Press. Pp. 267–283.
- Bejder L, Dawson S 2001. Abundance, residency, and habitat utilisation of Hector's dolphins (Cephalorhynchus hectori) in Porpoise Bay, New Zealand. New Zealand Journal of Marine and Freshwater Research 35: 277–287.
- Bräger S 1998. Behavioural ecology and population structure of Hector's dolphin (Cephalorhynchus hectori). Unpublished PhD thesis. Dunedin, University of Otago. 168 p.
- Bräger S 1999. Association patterns in three populations of Hector's dolphin, Cephalorhynchus hectori. Canadian Journal of Zoology 77: 13–18.
- Bräger S, Dawson SM, Slooten E, Smith S, Stone GS, Yoshinaga A 2002. Site fidelity and along-shore range in Hector's dolphin, an endangered marine dolphin from New Zealand. Biological Conservation 108: 281–287.
- Bräger S, Harraway JA, Manly BFJ 2003. Habitat selection in a coastal dolphin species (Cephalorhynchus hectori). Marine Biology 143: 233–244.
- Bräger S, Schneider K 1998. Near-shore distribution and abundance of dolphins along the West Coast of the South Island, New Zealand. New Zealand Journal of Marine and Freshwater Research 32: 105–112.
- Cawthorn MW 1988. Recent observations of Hector's dolphin, Cephalorhynchus hectori, in New Zealand. Report of the International Whaling Commission Special Issue 9: 303–314.
- Currey RJC, Boren LJ, Sharp BR, Peterson D 2012. A risk assessment of threats to Maui's dolphins. Wellington, Ministry for Primary Industries and Department of Conservation. www.doc.govt.nz/getting-involved/consultations/closed/threat-management-plan-review-for-mauis-dolphin/consultation-paper/ ( accessed 20 January 2013).
- Dawson SM, Slooten E 1988. Hector's dolphin Cephalorhynchus hectori: distribution and abundance. Report of the International Whaling Commission Special Issue 9: 315–324.
- DuFresne S, Mattlin R 2009. Distribution and abundance of Hector's dolphin (Cephalorhynchus hectori) in Clifford and Cloudy Bays (Final Report for NIWA project CBF07401). Nelson, Marine Wildlife Research Ltd.
- Gomez-Salazar C, Trujillo F, Whitehead H 2011. Photo-identification: a reliable and non-invasive tool for studying pink river dolphins (Inia geoffrensis). Aquatic Mammals 37: 472–485.
- Gormley AM, Dawson SM, Slooten E, Bräger S 2005. Capture-recapture estimates of Hector's dolphin abundance at Banks Peninsula, New Zealand. Marine Mammal Science 21: 204–216.
- Gormley AM, Slooten E, Dawson SM, Barker RJ, Rayment W, du Fresne S et al. 2012. First evidence that marine protected areas can work for marine mammals. Journal of Applied Ecology 49: 474–480.
- Hamner RM, Constantine R, Oremus M, Stanley M, Brown P, Baker CS 2013. Long-range movement by Hector's dolphins provides potential genetic enhancement for critically endangered Maui's dolphin. Marine Mammal Science 30: 139–153.
- Hamner RM, Pichler F, Heimeier D, Constantine R, Baker CS 2012. Genetic differentiation and limited gene flow among fragmented populations of New Zealand endemic Hector's and Maui's dolphins. Conservation Genetics 13: 987–1002.
- Hoyt E 2005. Marine protected areas for whales, dolphins and porpoises. London, Earthscan.
- Ingram S, Rogan E 2002. Identifying critical areas and habitat preferences of bottlenose dolphins Tursiops truncatus. Marine Ecology Progress Series 244: 247–255.
- IUCN (International Union for Conservation of Nature) 2010. Red list of threatened species. http://www.iucnredlist.org/ ( accessed 10 December 2013).
- Lewis KB, Barnes PM 1999. Kaikoura Canyon, New Zealand: active conduit from near-shore sediment zones to trench-axis channel. Marine Geology 162: 39–69.
- MacKenzie DL, Clement DM 2014. Abundance and distribution of ECSI Hector's dolphin. New Zealand Aquatic Environment and Biodiversity Report No. 123. Wellington, Ministry for Primary Industries. 79 p.
- Miller E, Lalais C, Dawson S, Ratz H, Slooten E 2013. Hector's dolphin diet: the species, sizes and relative importance of prey eaten by Cephalorhynchus hectori, investigated using stomach content analysis. Marine Mammal Science 29: 606–628.
- Ministry of Fisheries 2008. Recreational set net prohibitions for Hector's dolphins: South Island east and south coasts. http://www.fish.govt.nz/en-nz/Environmental/Hectors+Dolphins/SCSI+Set+Net/default.htm ( accessed 20 November 2013).
- R Core Development Team 2013. R: a language and environment for statistical computing. Vienna, Austria, R Foundation for Statistical Computing. http://www.R-project.org/ (accessed 5 January 2014).
- Rayment W, Dawson S, Slooten E 2010. Seasonal changes in distribution of Hector's dolphin at Banks Peninsula, New Zealand: implications for protected area design. Aquatic Conservation—Marine and Freshwater Ecosystems 20: 106–116.
- Rayment W, Clement D, Dawson S, Slooten E, Secchi E 2011. Distribution of Hector's dolphin (Cephalorhynchus hectori) off the west coast, South Island, New Zealand, with implications for the management of bycatch. Marine Mammal Science 27: 398–420.
- Rayment W, Dawson S, Slooten E, Bräger S, Fresne SD, Webster T 2009. Kernal density estimates of alongshore home range of Hector's dolphins at Banks Peninsula, New Zealand. Marine Mammal Science 25: 537–556.
- Slooten E 2013. Effectiveness of area-based management in reducing bycatch of the New Zealand dolphin. Endangered Species Research 20: 121–130.
- Slooten E, Dawson SM 1994. Hector's dolphin Cephalorhynchuc hectori (van Beneden, 1881). In: Ridgeway SH, Harrison R eds. Handbook of marine mammals, vol. 5. San Diego, CA, Academic Press. Pp. 311–333.
- Slooten E, Dawson SM 2010. Assessing the effectiveness of conservation management decisions: likely effects of new protection measures for Hector's dolphin (Cephalorhynchus hectori). Aquatic Conservation—Marine and freshwater Ecosystems 20: 334–347.
- Slooten E, Dawson SM, Lad F 1992. Survival rates of photographically identified Hector's dolphins from 1984 to 1988. Marine Mammal Science 8: 327–343.
- Turek J, Slooten E, Dawson S, Rayment W, Turek D 2013. Distribution and abundance of Hector's dolphins off Otago, New Zealand. New Zealand Journal of Marine and Freshwater Research 47: 181–191.
- Weir JS, Duprey NMT, Würsig B 2008. Dusky dolphin (Lagenorhynchus obscurus) subgroup distribution: are shallow waters a refuge for nursery groups? Canadian Journal of Zoology 86: 1225–1234.
- Whitehead H 2008. Analyzing animal societies: quantitative methods for vertebrate social analysis. Chicago, University of Chicago Press. 320 p.
- Würsig B, Jefferson TA 1990. Methods of photo-identification for small cetaceans. Report of the International Whaling Commission Special Issue 12: 43–52.