
ABSTRACT
It is widely believed that predators maximise their energy intake while foraging and consume prey that are nutritionally similar. We combined GPS data loggers, miniaturised cameras, dietary sampling and nutritional geometry to examine the nutritional variability in the prey and selected diet, and foraging performance, of the masked booby (Sula dactylatra tasmani), a wild carnivore and marine top predator. Data loggers also revealed no significant differences between sexes in the foraging performance of chick-rearing adults. Females provided more food to their chicks than the males and, regardless of the nutritional variability of prey consumed, both sexes showed similar amounts of protein and lipid in their diets. Miniaturised cameras combined with nutritional analysis of prey provided, for the first time, fine-scale detail of the amounts of macronutrients consumed in each plunge dive and the overall foraging trip. Our methodology could be considered for future studies that aim to contribute to the general understanding of the behavioural and physiological mechanisms and ecological and evolutionary significance of animal foraging (e.g. energy expenditure budgets and prey selection for self- and offspring-feeding that could lead to sex-specific foraging strategies).
Introduction
Predators play an important role in the structure and function of food webs and ecological communities (Paine Citation1980). It is widely believed that predators feed on foods that are nutritionally similar, suggesting that quantity drives their selection (Westoby Citation1978; Stephens & Krebs Citation1986). The recent development of a multidimensional geometric framework known as nutritional geometry (NG) has simplified the complexities of modelling foods in relation to foraging behaviour, the type of predator, geographic location and social interactions, providing a novel ecological view of nutrition (Raubenheimer et al. Citation2009; Simpson & Raubenheimer Citation2012). NG has enabled scientists to unravel the importance of food quality in relation to macronutrient (protein, lipid, carbohydrate) ratios in a wide range of taxa in the laboratory and a few herbivores and omnivores in the wild (reviewed in Simpson & Raubenheimer Citation2012). NG includes two different modelling approaches: amounts-based (AB), the proportions-based right-angled mixture triangle (RMT). The former requires the accurate collection of foods consumed and has been applied extensively in laboratory studies, whereas the latter is a proportional model that has been broadly applicable to field studies (Raubenheimer Citation2011). Field-based research has the challenge to overcome complex logistical constraints to collect reliable data for nutritional studies in both aquatic (reviewed in Tait et al. Citation2014) and terrestrial environments (reviewed in Rothman et al. Citation2012; Raubenheimer et al. Citation2015).
One of the main challenges in studying the nutritional ecology of animals in the wild is undertaking the prolonged observations necessary to interpret foraging behaviour and food intake. Only a few species have been able to habituate to human presence sufficiently to allow observation of their foraging behaviour in the field (e.g. Goodall Citation1964; Whiten et al. Citation1999; Rothman et al. Citation2011). AB nutritional models have, to date, been successfully applied in three field projects: Peruvian spider monkeys, Ateles chamek (Felton et al. Citation2009); mountain gorillas, Gorilla beringei beringei (Rothman et al. Citation2011) and chacma baboons, Papio hamadryas ursinus (Johnson et al. Citation2013). All involved primates that were able to habituate to human presence, thereby facilitating accurate behavioural observations (Raubenheimer et al. Citation2015). However, the vast majority of animals are highly evasive and difficult to observe in the wild for extended periods. Adding to this challenge, marine predators generally spend most of their lives at sea. As a consequence, studies involving direct observations on foraging behaviour of marine predators are rare.
Bio-logging technologies have made significant contributions to understanding how predators utilise three-dimensional spaces while foraging (reviewed in Wilson et al. Citation2002; Ropert-Coudert & Wilson Citation2005; Ropert-Coudert et al. Citation2009). Miniaturised data loggers have been deployed on unhabituated free-ranging species, in particular seabirds, providing researchers the ability to collect fine-scale detail of global positioning, acceleration and surrounding abiotic factors that can be modelled to profile 3D environments (Grémillet et al. Citation2004; Machovsky-Capuska et al. Citation2013). The recent expansion of bio-logging using miniaturised cameras enables the collection of visual information from the animals’ perspective (Moll et al. Citation2007).
Deployments of miniaturised cameras have provided the ability to unravel at-sea behaviours of marine predators including diving tactics and prey capture success (Davis et al. Citation1999; Watanabe et al. Citation2006; Takahashi et al. Citation2008; Heaslip et al. Citation2012), social interactions (Sakamoto et al. Citation2009; Yoda et al. Citation2011), and interactions with their environment and fisheries (Grémillet et al. Citation2010; Votier et al. Citation2013; Tremblay et al. Citation2014). None, however, have been able to capture high-resolution footage on foraging decisions over an entire foraging trip.
The hitherto unrealised coupling of bio-logging technology with NG could yield powerful insights into carnivore foraging strategies and nutritional ecology. Here, we combine GPS data loggers, miniaturised cameras, diet analysis and NG to examine the nutritional variability in the prey and selected diet, combined with foraging performance, of a wild carnivore and marine top predator, the masked booby (Sula dactylatra tasmani). Masked boobies are large (weight 2.4–2.9 kg) members of the Sulidae family (gannets and boobies) which are classified as Near Threatened (Garnett et al. Citation2011). These marine predators alternate short and long foraging trips that enable them to balance self- and offspring-feeding (Sommerfeld et al. Citation2013a). Foraging investment plays an important role in the division of labour in biparental care systems (Bijleveld & Mullers Citation2009). Species that show reverse sexual dimorphism (RSD), where females are larger than males, are known for having sex-specific foraging differences (reviewed in Lewis et al. Citation2002). We seek to gain a better understanding of the nutritional ecology of this species, addressing three questions: 1. Does macronutrient composition vary between prey species? 2. Do masked boobies show sex-specific foraging strategies (in terms of foraging behaviour and macronutrient consumption)? 3. Can bio-logging be coupled with NG to provide fine-scale detail of the amounts of macronutrients consumed in each plunge dive and the overall foraging trip? We also discuss future directions in field-based nutritional ecology using bio-logging science.
Materials and methods
Study area
The study was conducted in September 2013 at Muttonbird Point, Lord Howe Island, Australia (31°30′ S, 159°04′ E). The masked booby population on Muttonbird Point is estimated at c. 200 breeding pairs (Priddel et al. Citation2005).
Data logger deployment
Ten chick-rearing adults (chicks 2–5 weeks old) were captured at their nests with a blunt-tip shepherd’s crook and sexed by differences in pitched voice (Nelson Citation1978). We used two types of loggers (continuous GPS—1 s intervals—and a continuous recording camera) which were attached with Temflex 1610 tape to the four central tail feathers. Five males and three females were equipped with GPS data loggers weighing 45 g each (manufactured by e-obs digital telemetry in Germany; see Machovsky-Capuska et al. Citation2013 for further details) and two males were fitted with customised miniature video cameras (U10 AU USB Flash Drive DVR Camera DV, A). The cameras deployed had a 36° lens angle and sensor resolution of 720 × 480 HD at 30 frames per second with a MicroSD 64 GB storage capability. The unit was powered by a 3400 mAh lithium polymer battery that enabled 19 h of continuous video recording. All components were encapsulated in waterproof housing for immersion to depths of 20 m. The total package was 60 × 60 × 15 mm (L × W × H) and weighed 70 g, which is below the 3% threshold (the weight of logger in relation to the adult body mass) beyond which behavioural disruptions are likely to occur in flying seabirds (Vandenabeele et al. Citation2014). To aid rapid identification, each bird was uniquely marked on the chest with permanent non-toxic ink as in Machovsky-Capuska et al. (Citation2014). Marked birds were recaptured upon arrival at the colony after foraging, and the loggers retrieved.
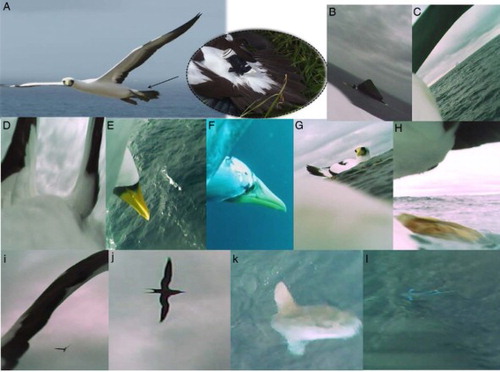
Figure 1 Digital still images obtained from bird-borne cameras attached to two male chick- rearing adult masked boobies. A, Flying bird with a miniaturised camera attached to the four central feathers of the tail; B, bird heading NE away from Muttonbird Point for a splash down during a short trip (within 1.5 km from the colony); C, foraging bird returning to the colony (at least 55 km away) at dusk approaching from the SSW from S of Balls Pyramid; D–H, a foraging phase (FP) that consists of ascent: E—aerial phase of the plunge dive: F— underwater phase of the plunge dive: G—resting near a conspecific: H—take off; I, foraging in the presence of conspecifics; J, frigate bird in association with camera-mounted bird; K, plunge diving in the presence of sunfish (Mola mola); L, aerial prey detection of flyingfish (Exocoetidae).
Foraging performance
The high resolution detail of the miniaturised cameras allowed us to estimate parameters of foraging performance that were used to interpret information from the continuous GPS data loggers. We defined the duration of a foraging phase (FP) as the time interval encompassing the ascent, plunge dive (aerial and underwater phases), subsequent resting on the water and take off (Weimerskirch et al. Citation2005). Based on the video footage collected we established a mean dive duration of 5.8 s that allowed us to infer diving behaviour from the interruptions of continuous GPS signals following Machovsky-Capuska et al. (Citation2013). Video footage was analysed frame by frame using Avidemux 2.6.4.
Following Grémillet et al. (Citation2004), maximum distance away from the colony (MDC), total foraging path (TFP), foraging trip duration (FTD), flying time (FT), resting time (RT) and total dive duration (TDD) were estimated from the recorded GPS data. Following Sommerfeld et al. (Citation2013b), we established short and long foraging trips depending on their duration and the presence of plunge-diving events.
Prey composition of diet
Dietary samples were collected in separate polythene bags from boobies that regurgitated during handling (Priddel et al. Citation2005). Prey obtained from the regurgitations were individually weighed to 0.1 g, total length measured to 0.1 cm and identified to the lowest possible taxonomic level using published guides (Allen Citation2009). To evaluate prey preference differences between females and males, we used binomial generalised linear models (GLMs; Bolker et al. Citation2009).
To estimate the macronutrient variation of prey species and calculate the nutritional composition of the boobies’ diet, undigested samples of prey were selected from the regurgitations for chemical composition analysis (total lipid, nitrogen, moisture and ash). The most representative prey samples selected include flyingfish (Cheilopgon spp., n = 4), yellowtail kingfish (Seriola lalandi, n = 2) and mackerel scad (Decapterus macarellus, n = 2). All prey samples were frozen within 5 h of collection and stored at −20 °C. As the same as previous study, proximate composition analysis of the different prey species was conducted following Tait et al. (Citation2014). In accordance with Raubenheimer (Citation2011), we plotted RMTs to show the proportional macronutrient variation (protein, lipid and rest—the sum of moisture and organic matter) in the prey consumed by masked boobies and also the nutritional composition of their diet that resulted from mixing multiple foods. Following Raubenheimer & Rothman (Citation2013), macronutrient masses were converted to energy (E) using standard conversion factors (protein = 17 Kj/g and lipid = 37 Kj/g). We randomly permuted intake of protein, lipid, rest and energy between sexes 100,000 times to evaluate the probability that the observed distribution would occur randomly and thus corrected for biases due to small sample size. Following Raubenheimer & Simpson (Citation1997) we calculated in two steps the macronutrient intake of a foraging trip using AB models: step 1, we multiplied the macronutrient composition of each prey (g) by the number of prey ingested at each plunge dive; step 2, we summed the macronutrient consumption of all plunge dives (as explained in step 1) to obtain the macronutrient intake for each foraging trip. The balance of nutrients of the prey consumed in each foraging trip was connected using a line (also called ‘nutritional rail’) that passes through the origin of the graph and through each point that represents the quantity of the prey type.
Macronutrient intake and foraging performance
To combine foraging performance analyses with estimates of macronutrient intake we used only dietary samples collected upon data logger retrieval. Masked boobies feed mainly by plunge-diving from the air into the water (Weimerskirch et al. Citation2008) and for an accurate representation of the macronutrient intake in relation to foraging activity we used only trips in which plunge-diving was established. Following Machovsky-Capuska et al. (Citation2011), we used the total dive duration per foraging trip to calculate the overall diving efficiency in regards to total meal size, grams of protein (P), lipid (L) and rest (100% – [P + L]) consumed.
Due to small sample size, data from GPS loggers and cameras were initially tested using Levene’s test for homoscedasticity and Shapiro-Wilk’s test for normality and t-test for subsequent comparisons. Foraging phases, foraging trip duration and diving efficiency data (used as a continuous variable) were log10 transformed and statistically tested using t-tests. All data were analysed using the statistical program PASW Statistics 19 (IBM Corp, Somers). Results are presented as mean ± standard deviation (SD). This study was conducted under Office of Environment and Heritage (NSW) Animal Ethics permit OEH 021028/02.
Results
Miniaturised cameras
Video footage collected from two male chick-rearing masked boobies showed a total of six foraging trips. Using known landmarks (e.g. B) we estimated that short trips (i.e., within 1 h duration) extended at least 1.5 km from the colony and long trips at least 55.0 km from the colony (B–C). A fine-scale detailed analysis of the footage revealed two FPs in six trips (33.0%, D–H). The two trips with a FP (3.6 ± 1.8 h) were longer than those without foraging activity (0.3 ± 0.1 h) (t = −4.91, d.f. = 4, P < 0.05; for more details see ). Of a total of 14 plunge dives recorded (TDD, 5.8 s ± 0.5 s), six were in the presence of sunfish. Plunge dive duration was longer in the presence of sunfish (6.7 s ± 0.7 s) than in their absence (4.7 s ± 1.5 s) (t = −2.28, d.f. = 12, P < 0.05). Boobies foraged in the presence of conspecifics (I), frigatebirds (Fregatidae; J) and sunfish (Mola mola; K), and preyed upon flyingfish (Exocoetidae, L).
Table 1 Foraging performance and macronutrient intake in chick-rearing adult masked boobies at Muttonbird Point (Lord Howe Island, Australia) in 2013.
GPS data loggers
We successfully collected a total of 24 single-day foraging trips from eight individual birds. All the individual foragers showed a combination of two short and one long foraging trip. Masked boobies spent 3.0 ± 3.7 h on their foraging trips, an average MDC of 30.6 ± 37.0 km and TFP of 104.0 ± 130.2 km. Following our analyses with miniaturised cameras, only the longer trips showed plunge-diving behaviour (33.0%, ), and we collected a total of 229 dives. No significant differences between cameras and GPS loggers were observed in the FTD (5.4 ± 0.4 h and 3.7 ± 1.5 h, respectively; t = −1.35, d.f. = 6, P = 0.22) and TDD (35.7 ± 9.2 s and 29.8 ± 9.5 s, respectively; t = 1.69, d.f. = 6, P = 0.14) (). Combining GPS and camera data, masked boobies spent on average 75.7% (± 11.6%) of the time flying, 24.0% (± 11.7%) resting on the water and less than 0.5% of the time plunge-diving. No significant differences were observed between females and males in the MDC (67.4 ± 36.8 km and 38.5 ± 29.4 km, respectively; t = −1.06, d.f. = 4, P = 0.35), TFP (182.3 ± 80.1 km and 153.4 ± 123.8 km, respectively; t = −0.34, d.f. = 4, P = 0.75), FTD (4.0 ± 1.1 h and 4.2 ± 1.9 h, respectively; t = 0.19, d.f. = 6, P = 0.85) and TDD (29.5 ± 14.3 s and 30.0 ± 8.5 s, respectively; t = 0.07, d.f. = 6, P = 0.95).
Prey composition of diets
Eleven regurgitations were collected from different individuals. The mean mass of prey per regurgitation was 297.0 ± 99.4 g, which represented between 10.2% and 12.4% of the range of adults’ body weight. The 25 prey items identified from these samples were all fish. Half of the regurgitations contained one prey species while the other half contained from two to five prey species, showing that masked boobies are able to feed on mixed diets. By mass, flyingfish was the most representative prey (72.0%), followed by yellowtail kingfish (18.1%) and mackerel scad (9.9%). Fish collected from regurgitations had an average mass of 126.3 ± 123.7 g and an average total length of 23.9 ± 10.4 cm.
Females (361.0 ± 86.9 g, n = 5) brought to the colony bigger meals than males (243.6 ± 50.5 g, n = 6, t = 2.18, d.f. = 9, P < 0.05). We found no differences between sexes in prey preferences (binomial GLZM: Wald test, z = 1.76, d.f. = 1, P = 0.18). There were no differences between the sexes in the length (t = −1.61, d.f. = 23, P = 0.12), weight (t = −1.18, d.f. = 23, P = 0.25) or number (t = −0.84, d.f. = 9, P = 0.43) of the individual fish brought to the colony.
Macronutrient composition of prey, diets and dietary intake
The RMT shows that the protein-to-lipid ratio (P:L) from the different foods consumed by masked boobies varied considerably, from 2.8:1 (yellowtail kingfish), 7.4:1 (mackerel scad) to 25.0:1 (flyingfish) (). In addition, we estimated the macronutrient composition of the diet aggregated across all individuals sampled to be 20.9:1.8:77.3 (P:L:R), with a P:L ratio of 11.6:1 ().
Figure 2 Right-angled mixture triangles (RMT) provide a means to visualise and compare proportional relationships of three mixture components (here protein [P], lipid [L] and rest [R = 100% – (P + L)]) in two dimensional graphs. The triangles are the most representative prey species consumed by masked boobies. Flyingfish (▵) which comprises 21.3% P, 0.9% L and 77.9% R. Yellowtail kingfish (▴) which comprises 20.8% P, 7.5% L and 71.7% R. Mackerel scad (▴) which comprises 19.3% P, 2.6% L and 78.1% R. The resulting diet (•) is composed of 20.9% P, 1.8% L and 77.3% R and is constrained to lie within the short dashed and dotted grey triangle connecting these foods.
![Figure 2 Right-angled mixture triangles (RMT) provide a means to visualise and compare proportional relationships of three mixture components (here protein [P], lipid [L] and rest [R = 100% – (P + L)]) in two dimensional graphs. The triangles are the most representative prey species consumed by masked boobies. Flyingfish (▵) which comprises 21.3% P, 0.9% L and 77.9% R. Yellowtail kingfish (▴) which comprises 20.8% P, 7.5% L and 71.7% R. Mackerel scad (▴) which comprises 19.3% P, 2.6% L and 78.1% R. The resulting diet (•) is composed of 20.9% P, 1.8% L and 77.3% R and is constrained to lie within the short dashed and dotted grey triangle connecting these foods.](/cms/asset/eb205b0a-e2cd-41f6-bf93-8e7991350c6e/tnzm_a_1152981_f0002_c.jpg)
No differences between males and females were observed in the absolute intake of protein (males, n = 6, 54.2 ± 14.8 g and females, n = 5, 75.6 ± 18.1 g, t = 2.17, d.f. = 9, P = 0.08), lipid (males, n = 6, 3.1 ± 1.0 g and females, n = 5, 4.3 ± 1.2 g, t = 1.66, d.f. = 9, P = 0.13) or rest (males, n = 6, 186.2 ± 76.9 g and females, n = 5, 281.1 ± 68.5 g, t = 2.14, d.f. = 9, P = 0.08), nor in the overall energetic consumption (males, n = 6, 3631.8 ± 1320.6 kj/g and females, n = 5, 5375.6 ± 1281.5 kj/g, t = 2.14, d.f. = 9, P = 0.08). Our permutation tests revealed no significant differences between males and females in the absolute intake of protein, lipid, rest and energy.
Macronutrient intake and foraging performance
From the eight chick-rearing adult masked boobies carrying loggers (three females and five males), we established foraging performance in relation to macronutrient intake (). The overall cost of macronutrient gains in relation to foraging trip duration was 19.9 ± 14.1 g/h (protein) and 0.9 ± 0.6 g/h (lipid), whereas the cost of macronutrient gains in relation to foraging path was 0.6 ± 0.4 g/km (protein) and 0.2 ± 0.02 g/km (lipid). No differences between sexes were observed in foraging (females 104.2 ± 25.6 g/h and males 88.4 ± 55.5 g/h, t = −0.19, d.f. = 6, P = 0.86) or diving performance in relation to meal size (females 19.6 ± 4.2 g/s and males 14.6 ± 7.4 g/s, t = 1.32, d.f. = 6, P = 0.24), protein (females 65.2 ± 24.2 g/s and males 61.9 ± 18.7 g/s, t = 1.50, d.f. = 6, P = 0.18), lipid (females 3.1 ± 1.2 g/s and males 3.6 ± 1.0 g/s, t = 1.13, d.f. = 6, P = 0.30) and rest (females 243.1 ± 92.5 g/s and males 211.8 ± 93.0 g/s, t = 1.28, d.f. = 6, P = 0.25).
Miniaturised cameras allowed us to establish prey detection and capture success of flyingfish (both birds) during their overall foraging trips. Bird five (B5) consumed five fish over eight plunge dives recorded (62% capture success), whereas bird nine (B9) captured three fish over six plunge dives (50% capture success). The AB model shows that B5 consumed more grams of lipids (L), protein (P) and energy (E) (L = 2.68 g, P = 68.80 g, E = 4802.2 Kj/g) than B9 (L = 2.24 g, P = 54.23 g, E = 3807.6 Kj/g) during their overall foraging trips (). However, both birds consumed similar P:L ratios in their diets (B5 = 25:1 and B9 = 24: 1; ).
Figure 3 Miniaturised cameras deployed on the central tail feathers of two male chick-rearing masked boobies coupled with amount-based models (AB) allowed us to establish the macronutrient intake for a foraging trip. First, we established the macronutrient composition of each individual flyingfish captured. Second, we multiplied the nutritional composition of each prey (g) by the number of prey ingested at each plunge dive (represented by [grey] triangles and [grey] circles). Third, we summed the macronutrient consumption of all plunge dives (as explained in step 2) to obtain the macronutrient intake for each foraging trip (represented by a [black] triangle and a [black] circle). The balance of nutrients of the prey consumed in each foraging trip was connected connected by arrows (that represent each individual’s nutritional rails). Circle = bird five; triangle = bird nine (see for more details).
![Figure 3 Miniaturised cameras deployed on the central tail feathers of two male chick-rearing masked boobies coupled with amount-based models (AB) allowed us to establish the macronutrient intake for a foraging trip. First, we established the macronutrient composition of each individual flyingfish captured. Second, we multiplied the nutritional composition of each prey (g) by the number of prey ingested at each plunge dive (represented by [grey] triangles and [grey] circles). Third, we summed the macronutrient consumption of all plunge dives (as explained in step 2) to obtain the macronutrient intake for each foraging trip (represented by a [black] triangle and a [black] circle). The balance of nutrients of the prey consumed in each foraging trip was connected connected by arrows (that represent each individual’s nutritional rails). Circle = bird five; triangle = bird nine (see Table 1 for more details).](/cms/asset/49741d72-a7b7-4688-9784-91495f8f95da/tnzm_a_1152981_f0003_c.jpg)
Discussion and conclusions
Understanding the relationships between nutrition, behaviour, ecology, morphology and physiology is a central aim in nutritional ecology (Raubenheimer et al. Citation2009). There are multiple challenges that have prevented translating nutritional ecology from the laboratory to the field to answer ecological questions related to nutrition in predators, including difficulties in: understanding foraging behaviour of inaccessible and/or dangerous wildlife; collecting accurate estimations of food consumption; and collecting prey consumed for proximate composition analysis within a similar spatiotemporal scale (Tait et al. Citation2014; Raubenheimer et al. Citation2015). To the best of our knowledge, the present study is the first to overcome these challenges to examine the nutritional ecology of a marine predator, the masked booby, by using bio-logging science to collect data that can be analysed using NG.
Foraging behaviour
Weimerskirch et al. (Citation2007, Citation2008, Citation2009) and Sommerfeld et al. (Citation2015) suggested the combination of short and long trips displayed by some seabirds, including masked boobies, were part of a bimodal foraging strategy. However, our findings show that during short trips (within 1 h) masked boobies only rest on the water and do not forage; foraging occurs only during long trips (over several hours) and may include several FPs. These results are consistent with previous suggestions that foragers adjust their travelling behaviour in response to prey density in an adaptive response called area-restricted search (ARS) behaviour (Sommerfeld et al. Citation2013a, Citation2013b; Weimerskirch et al. Citation2007). We also demonstrate that masked boobies use FPs with up to three consecutive plunge dives when food patches were discovered. FPs often took place in the presence of sunfish, which are well known to compete with flyingfish for copepods (Parin Citation1968). In the presence of predators, copepods are likely to elicit an escape response by descending into the water column thereby forcing schools of flyingfish to dive deeper (Lewis et al. Citation1962). It has been suggested that plunge divers alter their dive duration in relation to the depth of the prey (Machovsky-Capuska et al. Citation2011). The descent of prey might explain our observation that in the presence of sunfish foragers increased the duration of the ascent phase, climbed to higher altitudes, and had longer plunge dives.
While RSD is rare in seabirds, high sexual size dimorphism is characteristic of booby species (Sula spp., Nelson Citation1978). Within this group, larger females can easily buffer periods of food stress, increasing their ability to forage over longer distances and therefore different habitats (Weimerskirch et al. Citation2006). Miniaturised cameras and GPS loggers revealed no significant differences between sexes in the foraging performance of the masked boobies we studied, consistent with previous findings for the same species by Sommerfeld et al. (Citation2013a); on the other hand, such differences might be detected using larger sample sizes.
Food consumption and macronutrient composition
Offspring rearing is considered to be the period of highest energy demand for adult seabird parents (Ricklefs Citation1983). A successful marine predator requires complex foraging strategies that enable them to balance self- and offspring-maintenance (Machovsky-Capuska et al. Citation2014). Our results show that boobies only captured prey during the long trips (up to 6 h) and spent up to 1.5 h of the time resting on the water. Fish digestion in seabirds has been suggested to take approximately 2 to 6 h depending on the prey (Davis Citation1958), and it is likely that boobies were self-feeding during the first part of the trip before then capturing prey for their chicks, as previously found in gannets (Morus spp., Hamer et al. Citation2000). Therefore, the food collected in the regurgitations at the colony could be considered to cover the chicks’ nutritional demands.
Larger female masked boobies are suggested to be the main provisioners of food for their chicks, covering most of their energetic and nutritional demands (Weimerskirch et al. Citation2009). Our results showed that females brought more grams of food than males in diets similarly composed of mixed species (flyingfish, yellowtail kingfish and mackerel scad) and also a larger number of prey. Although our RMT model () shows that masked boobies consumed prey that differed in their macronutrient composition, supporting previous findings by Lenky et al. (Citation2012) and Tait et al. (Citation2014), both sexes had diets with similar macronutrient (protein and lipid) and energy yield content. Our dietary analysis did not find undigested hard parts (e.g. otoliths or cephalopod beaks) that could influence this sex-specific comparison, but it is likely that this was influenced by the small sample size. Therefore, dietary sexual differences related to sex-specific macronutrient foraging strategies for this species remains to be tested.
Bio-logger deployments in predators have previously been used to assess energy intake following the optimal foraging theory (OFT) of Stephens & Krebs (Citation1986). Most vertebrate species, including carnivore predators, ingest a mixed diet suggesting that factors other than energy are fundamental to their needs (Hailey et al. Citation1998; Machovsky-Capuska et al. Citation2016a). The combination of miniaturised cameras with AB models showed that both birds captured similar prey (flyingfish), but differed in their overall nutrient intake (). This difference is likely related to the number of prey consumed and also to the differences in the macronutrient composition of prey that is influenced by their size, sex, age and breeding stage (Montevecchi & Piatt Citation1984; Tait et al. Citation2014). The differences in macronutrient composition of prey provide evidence that marine predators forage in complex nutritional marine environments (Machovsky-Capuska et al. Citation2016a). It remains to be established whether predators in the wild are likely to feed selectively from the prey available according to nutrient composition, in order to maximise fitness as previously observed in laboratory studies (reviewed in Simpson & Raubenheimer Citation2012).
Challenges and future directions
The results presented here are subject to the caveat that we were unable to obtain a larger sample size and this is likely to influence the macronutrient composition of the estimated diets and potential sex comparisons. In addition, our cameras weigh 70 g and are suitable for deployment only on relatively large species. Based on the benefits and limitations of the use of cameras (Moll et al. Citation2007), there are several trade-offs that remain to be considered for the future of this form of bio-logging. First is the challenge of balancing the need for continuous filming for extended periods versus the addition of other on-board sensors (e.g. global positioning systems, time depth recorders, accelerometers, temperature loggers) to enhance the information collected. Second is the optimisation of battery selection to meet the power demands of the bio-logger while adhering to the weight and size constraints imposed by the target animal. Studies in which researchers are not able to collect undigested prey samples simultaneously with videography from the miniaturised cameras can utilise this valuable high-resolution tool to garner an estimate size of prey consumed from morphological features within the field of view of the camera lens (e.g. beak length, maximum width of turtles’ head; see more details in Machovsky-Capuska et al. Citation2011; Heaslip et al. Citation2012). Furthermore, representative prey samples matching the size of prey identified from the video footage should be collected for chemical composition analysis (Tait et al. Citation2014) and the data can be then modelled using NG following the present study.
Overall, our results provide insights into carnivore nutritional ecology and represent the first example that highlights the significance of combining bio-logging science with NG. This approach should be considered in future studies that aim to contribute to the general understanding of the behavioural and physiological mechanisms, and ecological and evolutionary significance of animal foraging (e.g. generalism and dietary niche breadth, energy expenditure budgets and prey selection for self- and offspring-feeding that could lead to sex-specific foraging) (Machovsky-Capuska et al. Citation2016b). In particular, it can provide a valuable contribution to our understanding of how the foraging behaviour of predators in the wild is related to their nutritional state and how this might influence the way they exploit their environment. Such information can be instrumental for enhancing conservation measures for endangered species (e.g. habitat conservation), monitoring the fate of rehabilitated animals post-release and managing human–wildlife conflict (e.g. fisheries interactions).
This study was partially funded by the Faculty of Veterinary Science DV Compact Research fund (The University of Sydney) and the Office of Environment and Heritage (NSW).
Acknowledgements
We thank S Liu and M Shiels for their assistance in the field. We thank C Amiot and AM Senior for assistance on the data analysis and A Podberscek for helpful comments on early versions of the manuscript. DR holds an Adjunct Professorship in the New Zealand Institute for Advanced Study, Massey University, Auckland.
Associate Editor: Associate Professor Bruce Robertson.
Disclosure statement
No potential conflict of interest was reported by the authors.
References
- Allen GR. 2009. Field guide to marine fishes of tropical Australia. Perth: Western Australian Museum.
- Bijleveld AI, Mullers RH. 2009. Reproductive effort in biparental care: an experimental study in long-lived Cape gannets. Behav Ecol. 20:736–744. doi:10.1093/beheco/arp054.
- Bolker BM, Brooks ME, Clark CJ, Geange SW, Poulsen JR, Stevens MHH, White JSS. 2009. Generalized linear mixed models: a practical guide for ecology and evolution. Trends Ecol Evol. 24:127–135. doi: 10.1016/j.tree.2008.10.008
- Davies DH. 1958. The South African pilchard (Sardinops ocellata) and maasbanker (Trachurus trachurus): the predation of sea-birds in the commercial fishery. Division of Fisheries Investigational Report 23. Johannesburg: South African Department of Commerce and Industry.
- Davis RW, Fuiman LA, Williams TM, Collier SO, Hagey WP, Kanatous SB, Kohin S, Horning M. 1999. Hunting behaviour of a marine mammal beneath the Antarctic fast ice. Sci. 283:993–996. doi:10.1126/science.283.5404.993.
- Felton AM, Felton A, Raubenheimer D, Simpson SJ, Foley WJ, Wood JT, Wallis IR, Lindenmayer DB. 2009. Protein content of diets dictates the daily energy intake of a free-ranging primate. Behav Ecol. 20:685–690. doi: 10.1093/beheco/arp021
- Garnett S, Szabo J, Dutson G. 2011. The action plan for Australian birds 2010. Melbourne: CSIRO Publishing.
- Goodall J. 1964. Tool-using and aimed throwing in a community of free-living chimpanzees. Nature. 201:1264–1266. doi: 10.1038/2011264a0
- Grémillet D, Dell’Omo G, Ryan P, Peters G, Ropert-Coudert Y, Weeks S. 2004. Offshore diplomacy, or how seabirds mitigate intra-specific competition: a case study based on GPS tracking of Cape gannets from neighbouring colonies. Mar Ecol Prog Ser. 268:265–279. doi:10.3354/meps268265.
- Grémillet D, Mullers RH, Moseley C, Pichegru L, Coetzee JC, Sabarros PS, Van Der Lingen CD, Ryan PG, Kato A, Ropert-Coudert Y. 2010. Seabirds, fisheries, and cameras. Front Ecol. 8:401–402. doi: 10.1890/10.WB.020
- Hailey A, Chidavaenzi RL, Loveridge JP. 1998. Diet mixing in the omnivorous tortoise Kinixys spekii. Funct Ecol. 12:373–385. doi:10.1046/j.1365-2435.1998.00203.x.
- Hamer KC, Phillips RA, Wanless S, Harris MP, Wood AG. 2000. Foraging ranges, diets and feeding locations of gannets (Morus bassanus) in the North Sea: evidence from satellite telemetry. Mar Ecol-Prog Ser. 200:257–264. doi: 10.3354/meps200257
- Heaslip SG, Iverson SJ, Bowen WD, James MC. 2012. Jellyfish support high energy intake of leatherback sea turtles (Dermochelys coriacea): video evidence from animal-borne cameras. PLoS ONE. 7:e33259. doi:10.1371/journal.pone.0033259.
- Johnson CA, Raubenheimer D, Rothman JM, Clarke D, Swedell L. 2013. 30 days in the life: daily nutrient balancing in a wild chacma baboon. PLoS ONE. 8:e70438. doi: 10.1371/journal.pone.0070438
- Lenky C, Eisert R, Oftedal OT, Metcalf V. 2012. Proximate composition and energy density of nototheniid and myctophid fish in McMurdo Sound and the Ross Sea, Antarctica. Polar Biol. 35:717–724. doi:10.1007/s00300-011-1116-9.
- Lewis JB, Brundritt JK, Fish AG. 1962. The biology of the flyingfish Hirundichthys affinis (Gunther). B Mar Sci. 12:73–79.
- Lewis S, Benvenuti S, Dall’Antonia L, Griffiths R, Money L, Sherratt TN, Wanless S, and Hamer KC. 2002. Sex-specific foraging behaviour in a monomorphic seabird. Proc Roy Soc Lond B Biol Sci. 269:1687–1693. doi:10.1098/rspb.2002.2083.
- Machovsky-Capuska GE, Hauber ME, Dassis M, Libby E, Wikelski MC, Schuckard R, Melville D, Cook W, Houston M, Raubenheimer D. 2013. Foraging behaviour and habitat use of chick-rearing Australasian gannets in New Zealand. J Ornithol. 155:379–387. doi:10.1007/s10336-013-1018-4.
- Machovsky-Capuska GE, Hauber ME, Libby E, Amiot C, Raubenheimer D. 2014. The contribution of private and public information in foraging by Australasian gannets. Ani Cogn. 17:849–858. doi:10.1007/s10071-013-0716-x.
- Machovsky-Capuska GE, Senior AM, Benn EC, Tait AH, Schuckard R, Stockin KA, Cook W, Ogle M, Barna K, Melville D, Wright B. 2016a. Sex-specific macronutrient foraging strategies in a highly successful marine predator: the Australasian gannet. Mar Biol. 163:75. doi:10.1007/s00227-016-2841-y.
- Machovsky-Capuska GE, Senior AM, Simpson SJ, Raubenheimer D. 2016b. The multidimensional nutritional niche. Trends Ecol Evol. 31:355–365.
- Machovsky-Capuska GE, Vaughn RL, Würsig B, Katzir G, Raubenheimer D. 2011. Dive strategies and foraging effort in the Australasian gannet Morus serrator revealed by underwater videography. Mar Ecol Prog Ser. 442:255–261. doi:10.3354/meps09458.
- Moll RJ, Millspaugh JJ, Beringer J, Sartwell J, He Z. 2007. A new ‘view’ of ecology and conservation through animal-borne video systems. Trends Ecol Evol. 22:660–668. doi:10.1016/j.tree.2007.09.007.
- Montevecchi WA, Piatt JF. 1984. Composition and energy contents of mature inshore spawning capelin (Mallotus villosus): implications for seabird predators. Comp Biochem Physiol A Physiol. 78:15–20. doi: 10.1016/0300-9629(84)90084-7
- Nelson JB 1978. The Sulidae: gannets and boobies. Oxford: Oxford University Press.
- Paine RT. 1980. Food webs: linkage, interaction strength and community infrastructure. J Anim Ecol. 49:667–685. doi:10.2307/4220.
- Parin NV. 1968. Ichthyofauna of the epipelagic zone [Russian. Izdat. Nauka, Moscow]. English translation 1970. Washington, DC: US Department of Interior and the National Science Foundation.
- Priddel D, Hutton I, Olson S, Wheeler R. 2005. Breeding biology of masked boobies (Sula dactylatra tasmani) on Lord Howe Island, Australia. Emu. 105:105–113. doi:10.1071/MU04028.
- Raubenheimer D. 2011. Toward a quantitative nutritional ecology: the right-angled mixture triangle. Ecol Monog. 81:407–427. doi:10.1890/10-1707.1.
- Raubenheimer D, Machovsky-Capuska GE, Chapman CA, Rothman JM. 2015. Geometry of nutrition in field studies: an illustration using wild primates. Oecologia. 177:223–234. doi:10.1007/s00442-014-3142-0.
- Raubenheimer D, Rothman JM. 2013. Nutritional ecology of entomophagy in humans and other primates. Annual Reviews of Entomology. 58:141–160. doi:10.1146/annurev-ento-120710-100713.
- Raubenheimer D, Simpson SJ. 1997. Integrative models of nutrient balancing: application to insects and vertebrates. Nutr Res Rev. 10:151–179. doi: 10.1079/NRR19970009
- Raubenheimer D, Simpson SJ, Mayntz D. 2009. Nutrition, ecology and nutritional ecology: toward an integrated framework. Funct Ecol. 23:4–16. doi:10.1111/j.1365-2435.2009.01522.x.
- Ricklefs RE. 1983. Some considerations on the reproductive energetics of pelagic seabirds. Stud Avian Biol. 8:84–94.
- Ropert-Coudert Y, Beaulieu M, Hanuise N, Kato A. 2009. Diving into the world of biologging. Endanger Species Res. 10:21–27. doi:10.3354/esr00188.
- Ropert-Coudert Y, Wilson RP. 2005. Trends and perspectives in animal-attached remote sensing. Front Ecol Environ. 3:437–444. doi: 10.1890/1540-9295(2005)003[0437:TAPIAR]2.0.CO;2
- Rothman JM, Chapman CA, Van Soest PJ. 2012. Methods in primate nutritional ecology: a user’s guide. Int J Primatol. 33:542–566. doi:10.1007/s10764-011-9568-x. doi: 10.1007/s10764-011-9568-x
- Rothman JM, Raubenheimer D, Chapman CA. 2011. Nutritional geometry: gorillas prioritize non-protein energy while consuming surplus protein. Biol Lett. 7:847–849. doi:10.1098/rsbl.2011.0321.
- Sakamoto KQ, Takahashi A, Iwata T, Trathan PN. 2009. From the eye of the albatrosses: a bird-borne camera shows an association between albatrosses and a killer whale in the Southern Ocean. PLoS ONE. 4:e7322. doi:10.1371/journal.pone.0007322.
- Simpson SJ, Raubenheimer D. 2012. The nature of nutrition: a unifying framework from animal adaptation to human obesity. Princeton: Princeton University Press.
- Sommerfeld J, Kato A, Ropert-Coudert Y, Garthe S, Hindell MA. 2013a. The individual counts: within sex differences in foraging strategies are as important as sex-specific differences in masked boobies Sula dactylatra. J Avian Biol. 44:531–540. doi:10.1111/j.1600-048X.2013.00135.x.
- Sommerfeld J, Kato A, Ropert-Coudert Y, Garthe S, Hindell MA. 2013b. Foraging parameters influencing the detection and interpretation of area-restricted search behaviour in marine predators: a case study with the masked booby. PLoS ONE. 8(5):e63742. doi:10.1371/journal.pone.0063742.
- Sommerfeld J, Kato A, Ropert-Coudert Y, Garthe S, Wilcox C, Hindell MA. 2015. Flexible foraging behaviour in a marine predator, the masked booby (Sula dactylatra), according to foraging locations and environmental conditions. J Exp Mar Biol Ecol. 463:79–86. doi: 10.1016/j.jembe.2014.11.005
- Stephens DW, Krebs JR 1986. Foraging theory. Princeton, NJ: Princeton University Press.
- Tait A, Raubenheimer D, Stockin KA, Merriman M, Machovsky-Capuska GE. 2014. Nutritional geometry and the macronutrient variation in the diet of gannets: the challenges in marine field studies. Mar Biol. 12:2791–2801. doi:10.1007/s00227-014-2544-1.
- Takahashi A, Kokubun N, Mori Y, Shin HC. 2008. Krill-feeding behaviour of gentoo penguins as shown by animal-borne camera loggers. Polar Biol. 31:1291–1294. doi:10.1007/s00300-008-0502-4.
- Tremblay Y, Thiebault A, Mullers R, Pistorius P. 2014. Bird-borne video-cameras show that seabird movement patterns relate to previously unrevealed proximate environment, not prey. PLoS ONE. 9:e88424. doi:10.1371/journal.pone.0088424.
- Vandenabeele SP, Grundy E, Friswell MI, Grogan A, Votier SC, Wilson RP. 2014. Excess baggage for birds: inappropriate placement of tags on gannets changes flight patterns. PLoS ONE. 9:e92657. doi:10.1371/journal.pone.0092657.
- Votier SC, Bicknell A, Cox SL, Scales KL, Patrick SC. 2013. A bird’s eye view of discard reforms: bird-borne cameras reveal seabird/fishery interactions. PLoS ONE. 8:e57376. doi:10.1371/journal.pone.0057376.
- Watanabe Y, Bornemann H, Liebsch N, Plotz J, Sato K, Naito Y, Miyazaki N. 2006. Seal-mounted cameras detect invertebrate fauna on the underside of an Antarctic ice shelf. Mar Ecol Progr Series. 309:297–300. doi:10.3354/meps309297.
- Weimerskirch H, Le Corre M, Bost CA. 2008. Foraging strategy of masked boobies from the largest colony in the world: relationship to environmental conditions and fisheries. Mar Ecol Prog Ser. 362:291–302. doi: 10.3354/meps07424
- Weimerskirch H, Le Corre M, Gadenne H, Pinaud D, Kato A, Ropert-Coudert Y, Bost CA. 2009. Relationship between reversed sexual dimorphism, breeding investment and foraging ecology in a pelagic seabird, the masked booby. Oecologia. 161:637–649. doi:10.1007/s00442-009-1397-7.
- Weimerskirch H, Le Corre M, Ropert-Coudert Y, Kato A, Marsac F. 2005. The three-dimensional flight of red-footed boobies: adaptations to foraging in a tropical environment? Proc Roy Soc Lond B Biol Sci. 272:53–61. doi:10.1098/rspb.2004.2918.
- Weimerskirch H, Le Corre M, Ropert-Coudert Y, Kato A, Marsac F. 2006. Sex-specific foraging behaviour in a seabird with reversed sexual dimorphism, the red-footed booby. Oecologia. 146:681–691. doi: 10.1007/s00442-005-0226-x
- Weimerskirch H, Pinaud D, Pawlowski F, Bost C. 2007. Does prey capture induce area-restricted search? A fine-scale study using GPS in a marine predator, the wandering albatross. Am Nat. 170:734–743. doi: 10.1086/522059
- Westoby M. 1978. What are the biological bases of varied diets?. Am Nat. 112:627–631. doi: 10.1086/283303
- Whiten A, Goodall J, McGrew WC, Nishida T, Reynolds V, Sugiyama Y, Tutin CEG, Wrangham RW, Boesch C. 1999. Cultures in chimpanzees. Nature. 399:682–685. doi:10.1038/21415.
- Wilson RP, Grémillet D, Syder J, Kierspel MA, Garthe S, Weimerskirch H, Schäfer-Neth C, Scolaro JA, Bost C, Plötz J, Nel D. 2002. Remote-sensing systems and seabirds: their use, abuse and potential for measuring marine environmental variables. Mar Ecol Prog Ser. 228:241–261. doi: 10.3354/meps228241
- Yoda K, Murakoshi M, Tsutsui K, Kohno H. 2011. Social interactions of juvenile brown boobies at sea as observed with animal-borne video cameras. PLoS ONE. 6:e19602. doi:10.1371/journal.pone.0019602.