
ABSTRACT
Using a space-for-time substitution design, we investigated the response of structural instream habitat and fish populations to different riparian management practices throughout a Dairy Best Practice Catchment. We found a significant negative correlation between the upstream area of stock exclusion fencing and deposited instream fine sediment cover. Furthermore, we determined that this relationship emerges when ≥300 m lengths of upstream riparian area were included in the analysis, indicating the scale at which stock exclusion fencing results in a positive instream habitat response. Specifically, for this historically degraded spring-fed stream, our findings indicate that riparian segments with 5 m wide stock exclusion fences (both banks) are required to achieve instream fine sediment cover below 20% in downstream reaches. Fish were sparse and evenly spread throughout the catchment. Fish distributions were not correlated with reach-scale riparian or instream habitat variables, possibly because the available habitat quality gradient was too narrow.
Introduction
One hundred and fifty years of agricultural development have resulted in degraded water quality and macroinvertebrate communities in the majority of New Zealand’s lowland streams (Quinn et al. Citation1997; Quinn Citation2000; Larned et al. Citation2004). There is perception among the public and fishery managers that freshwater fishery values are also declining as a result of land-use intensification (Jellyman et al. Citation2003). This perception is fuelled, in part, by conspicuous and ongoing changes to the structural habitat of farmland streams through channelisation and the removal of riparian vegetation. Longfin (Anguilla dieffenbachii) and shortfin (A. australis) eels and the introduced brown trout (Salmo trutta) support highly valued customary, commercial and recreational fisheries in New Zealand (McDowall Citation1994, Citation2011). The impact of land-use induced structural habitat changes on these stream fisheries remains unquantified but is considered to be substantial (Jellyman et al. Citation2003; Beentjes et al. Citation2005).
A key structural habitat change in streams with agricultural catchments is an increase in the deposited fine sediment load (Allan Citation2004; Matthaei et al. Citation2006). This is caused by run-off from agricultural land, reduced bank stability as a result of vegetation clearance and livestock activity within a stream network (Trimble & Mendel Citation1995; Wood & Armitage Citation1999; Lyons et al. Citation2000). Fine sediment homogenises stream habitat by reducing residual-pool depth and smothering the stream bed. In turn, this reduces fish refugia during periods of low flow and production of benthic invertebrates, a key food source for fish (Duncan & Ward Citation1985; Wood & Armitage Citation1997; Allouche Citation2002; Sutherland et al. Citation2002). These changes can ultimately reduce the carrying capacity of a stream for fish (Bjornn et al. Citation1977; Waters Citation1995; Richardson & Jowett Citation2002; Mossop & Bradford Citation2006). Furthermore, fine sediment fills interstitial spaces within coarse substrata, which provide cover for juvenile eels and brown trout (Raleigh et al. Citation1986; Glova et al. Citation1998; Glova Citation2002; Jowett & Richardson Citation2008). In addition, deposited fine sediment in salmonid spawning redds slows hyporheic exchange reducing oxygen levels and metabolite flushing and consequently egg survival rates (Sternecker & Geist Citation2010).
Recently, there has been an exponential increase worldwide in resources targeted at rehabilitating stream habitats degraded by agricultural or urban development (Roni et al. Citation2002; Lester & Boulton Citation2008; Stewart et al. Citation2009). Stream fishery rehabilitation initiatives are based on the premise that fish (and their prey) will respond positively to increased structural habitat diversity and improved water quality (see ‘field of dreams hypothesis’, Palmer et al. Citation1997). In New Zealand, excluding livestock from the stream edge and re-establishing riparian vegetation underpins most rehabilitation projects (Parkyn et al. Citation2003; Dodd et al. Citation2009; Greenwood et al. Citation2012; Wahl et al. Citation2013). The potential benefits of instating ungrazed riparian marginal strips are considerable and include: (1) establishment of dense ground cover vegetation and more porous soils that filter fine sediment and particulate-bound contaminants from overland flow; (2) reduced nitrogen and phosphorus loading through degassing and assimilation into plant matter; (3) reduced stream bank erosion through the establishment of protective vegetative ground cover and soil-binding root masses; (4) reductions in stream temperatures and nuisance algal and macrophyte growths through shading; (5) increased allochthonous resources through the supply of terrestrial insects and leaf matter; and (6) increased cover for fish through draping vegetation and the supply of debris to streams (Platts & Wagstaff Citation1984; Quinn et al. Citation1997; Parkyn et al. Citation2003; Niyogi et al. Citation2007; Yuan et al. Citation2009; DeWalle Citation2010; Stewart-Koster et al. Citation2010; Zhang et al. Citation2010; Wahl et al. Citation2013).
Pastoral retirement has been shown to benefit some stream salmonid populations overseas (Keller & Burnham Citation1982; Summers et al. Citation2008). Conversely, in New Zealand, Jowett et al. (Citation2009) found that removal of riparian vegetation from a well-vegetated stream caused a subsequent reduction of eel density and biomass. However, a meta-analysis and review of fishery rehabilitation projects (Roni et al. Citation2002) and several other reviews of the international riparian rehabilitation literature conclude that the responses of biota to rehabilitation efforts are often underwhelming (Kondolf & Micheli Citation1995; Bash & Ryan Citation2002; Parkyn et al. Citation2003; Hillman & Brierley Citation2005; Lester & Boulton Citation2008; Stewart et al. Citation2009). Typical reasons for fish failing to respond positively to stream rehabilitation include: (1) rehabilitation efforts are often limited to the reach-scale and thus fail to address overriding stream-segment or catchment-scale disturbances; (2) lag periods for habitat or fish population responses to rehabilitation actions can exceed practical monitoring periods; and (3) factors other than habitat quality (e.g. dispersal or fishing) may limit the ability of biota to respond to localised habitat improvements. Given the inconsistent performance of rehabilitation projects, there remains a need for further research to inform effective riparian enhancement measures, particularly in relation to valued fisheries. Specifically, identifying the scales at which riparian management actions result in improved fish habitat and fish populations is a key research question.
The Dairy Best Practice Catchment (DBPC) programme undertaken in New Zealand from 2001 to 2011 provided an opportunity to investigate long-term ecosystem responses to catchment-scale stream rehabilitation. It involved applying best on-farm management practices (on a voluntary basis) throughout five degraded lowland wadeable streams across New Zealand (Waikakahi, Inchbonnie, Bog Burn, Toenepi and Waiokura). Physicochemical water quality was intensively monitored over 10 years. The key findings of the programme were that stock exclusion fencing and improved farm effluent management reduced suspended sediment and total phosphorus levels, whereas nitrate levels remained constant or increased (Wilcock et al. Citation1999; Wilcock et al. Citation2007; Monaghan et al. Citation2009). Nevertheless, despite stakeholder workshops identifying brown trout fisheries as a key value in three of the DBPCs (Waikakahi, Inchbonnie and Bog Burn), the responses of fish habitat and fish populations to the rehabilitation measures were not investigated.
The present study was undertaken in the Waikakahi Stream, one of the DBPCs. Our two research aims were to establish whether riparian habitat variables correlate with structural instream fish habitat quality and fish populations, and to determine the longitudinal scale at which relationships between riparian management practices and high-quality instream fish habitat emerge. Because landowners in the Waikakahi catchment have invested varying degrees of effort in managing the riparian area on their properties, this effectively provides a gradient of riparian habitat quality within the catchment. We collected instream and riparian structural habitat data from the stream using a catchment-scale fish habitat survey protocol, and also quantitative eel and trout population data from eight stream reaches spanning the entire gradient of habitat quality available within the catchment. Based on the related previous research cited above, we developed three specific hypotheses:
Instream habitat in reaches within, or immediately downstream of, an established (i.e. in place for 2 or more years) and relatively wide (>5 m on each bank) fenced riparian management area (henceforth called ‘fenced riparian area’) will have greater mesohabitat diversity, more stable banks, decreased widths (through encroachment of stream edge vegetation), reduced deposited fine sediment levels, greater depths and increased amounts of instream fish cover relative to reaches with small or poorly maintained riparian management areas.
The positive relationship between the size of fenced riparian area and instream fish habitat quality indicators will become stronger as the length of fenced riparian area upstream of ‘response’ reaches increases.
Trout and eel density and biomass will be related to the proportion of high-quality instream habitat (i.e. relatively deep, structurally diverse habitat with high proportions of fish cover and low levels of deposited sediment).
Materials and methods
Study stream
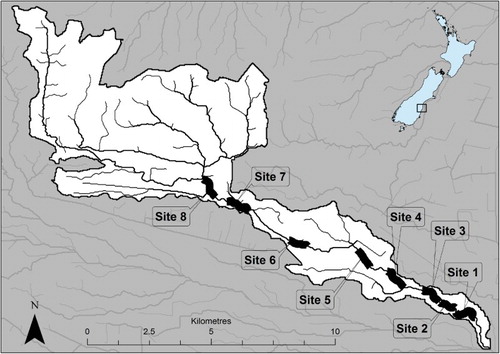
The Waikakahi Stream is a fifth-order, spring-fed tributary of the Waitaki River located on the coastal plains of South Canterbury (). It is approximately 18 km long with a catchment area of 63 km2. Annual rainfall is 600–700 mm (Monaghan et al. Citation2009). An irrigation development in the 1980s has caused the flow regime to be augmented by the nearby Waitaki River. Irrigation ‘wipe-off’ water from extensive border-dyke (flood) irrigation has resulted in mean summer base-flows 10 times higher than those recorded prior to the irrigation development. Near its confluence with the Waitaki River, the stream has a median flow of 0.57 m3 s−1 (range = 0.028–3.180 m3 s−1). The stream catchment is now dominated by dairy farming (>90% of catchment land area) following conversion from sheep and beef cattle during the early to mid-1990s (Monaghan et al. Citation2009).
Figure 1. The Waikakahi Stream catchment (South Canterbury, New Zealand) showing the locations of the eight surveyed 1 km stream segments. The stream flows from west to east before it joins the Waitaki River c. 4 km upstream of the coast. All tributaries and the mainstem 1 km upstream of Site 8 are ephemeral.
Study design
Riparian and structural instream habitat in the Waikakahi Stream were surveyed during base-flow conditions between 27 February and 1 March 2012 using a broad-scale habitat mapping protocol detailed in Holmes & Hayes (Citation2011) and Holmes et al. (Citation2013). The survey included a desktop analysis of existing catchment knowledge (as described in Harding et al. Citation2009) to identify strata that dictate the selection of survey sites. According to this protocol, stratification was not necessary in the Waikakahi because catchment-scale influences were similar throughout the stream’s length (i.e. the whole catchment was relatively low gradient throughout with no major tributaries or land-use changes).
Eight c. 1 km stream survey segments () were randomly chosen from a pool of 17 potential segments within the main stem of Waikakahi Stream. Potential segments were selected using a generalised random tessellation stratified (GRTS) spatially balanced survey design (Stevens & Olsen Citation2004).
Riparian survey
At each site, a two-person field team ground-truthed riparian habitat features on a set of four to six continuous ortho-rectified aerial photographs of the entire survey segment (1:700 scale). Imagery was sourced from Environment Canterbury (http://gis.ecan.govt.nz/arcgis/services). Information was recorded directly on to the aerial photographs and included the lengths and widths of the fenced riparian area, broad categories of riparian vegetation (based on successional stage from grasses to forest), location and areas of trees, land-use type (e.g. dairy) and land-use features (e.g. stock crossings), and potential contaminant sources (e.g. bank slumping and stock pugging).
For an example of the field instructions and a completed section of the riparian survey see Field protocol S1.
Instream survey
Three 100 m reaches, each split into five continuous 20 m sub-reaches, were randomly nested within each of the eight 1 km survey segments (115 sub-reaches in total, five reaches were inaccessible). Within each sub-reach, various habitat attributes were recorded as visual estimates (as m, m2 or a percentage of the sub-reach). Habitat attributes included mesohabitat types (riffle, run and pool), depths (categories 0–0.3, 0.3–0.5, 0.5–1 and >1 m), cover attributes (macrophytes, overhanging vegetation, undercut banks and woody debris), substratum characteristics including particle size categories according to Wentworth (Citation1922), and the occurrence of ‘nuisance’ filamentous and mat forming algae according to criteria in Biggs & Kilroy (Citation2000). Definitions of recorded instream habitat features and an example of a completed section of the instream survey are provided in Field protocol S2.
To gather coarse water velocity information, a representative fast-run, medium-run and slow-run were chosen from the lower Waikakahi Stream, and mean velocity in each was estimated by recording the time taken for a tennis ball to drift a known distance. Each estimate was the mean of three drift trials. A coefficient of 0.85 was used to convert surface velocity to mean channel velocity (US EPA Citation2015).
Fish population survey
Eight 40 m reaches were systematically selected to capture the entire gradient of instream habitat quality available for adult trout and eels within the surveyed areas of the catchment. In relative terms, ‘low habitat quality’ reaches were shallow and wide, with high levels of deposited fine sediment and low amounts of instream cover. ‘High habitat quality’ reaches were relatively deep with low levels of deposited sediment and high amounts of instream cover.
Fish population surveys were undertaken during base flows on 28 November 2012 and again on 15 March 2013. Fish populations were estimated for each stop net bounded 40 m reach using multiple depletion passes with two Smith Root (LR24) back-pack electric fishing machines. Captured fish were anesthetised with AQUI-S (a clove-oil based fish anaesthetic). After ataxia was observed, weights and lengths were recorded. All fish were released near their capture sites. Because of low fish numbers overall and the consequent difficulty in achieving depleting counts, aggregate fish numbers from all passes were used for abundance analysis. Instream habitat was resurveyed at each fishing reach during each fish sampling occasion.
GIS analysis
Riparian habitat data were digitised by scanning and ortho-rectifying the ground-truthed aerial photographs within ArcView GIS version 10.1. All habitat information was then transferred to GIS by creating shape files of the hand-drawn information. Information about each habitat feature was transferred to attribute tables for each shape file. The eight 1 km survey segments were divided into 100 m longitudinal GIS-defined riparian zones (GDZ), each with a 30 m wide area either side of the stream to encompass all riparian habitat features. All GDZ had small differences in area depending on the sinuosity of the channel (i.e. a GDZ would be slightly smaller if it included tight bends in the stream channel, or larger if it included areas at the extreme end of a survey segment and thus gained extra length). Each GDZ had an area of approximately 6000 m2 (range 5900–8800 m2).
Statistical analyses
Within each GDZ, riparian data were converted to rasta-grids to enable the area of each feature to be used as inputs for regression modelling. All instream habitat data were converted to total areas or mean percentage area cover of the wetted area for each 100 m reach to standardise the measurements. A riparian vegetation index was calculated by weighting vegetation category types according to their successional stage from pasture to mature multistoried canopies. Category weightings were as follows: mixed exotic grass (×1); mixed native and exotic grasses (×2); mixed native and/or exotic shrubs and grasses (×3); swampy and/or emergent mixed native and exotic grasses and herbs (×4); mature trees with understorey vegetation (×5). Vegetation category scores were applied to each square metre of riparian area within a GDZ, these scores were then summed to give an area weighted riparian vegetation index score. A maximum score of 60,000 would be achieved by a GDZ containing 100% mature forest (i.e. total GDZ area ×5).
Statistical analysis was undertaken using R statistical software. After exploratory data analysis, percentage (p) data (e.g. cover) were logit-transformed as follows to normalise the data, a requirement of the parametric statistical tests used:
This transformation emphasises differences near the extremes (0% and 100%) and de-emphasises differences near the centre (50%). Other data (counts and right-skewed) were log-transformed to meet the assumption of normality.
After matching instream habitat survey reaches with their corresponding GDZ, exploratory analyses were undertaken by constructing linear regressions (with linear, quadratic and cubic terms) for all measured riparian predictor variables against each instream variable. This process was first undertaken using the mean of all data available for a given riparian variable at each survey segment regressed against the combined mean for an instream habitat variable from all three instream survey reaches within the survey segment. In this analysis, we assumed that the three instream survey reaches, which were randomly nested within each riparian survey segment, were representative of instream habitat within the entire segment.
To investigate the effect of scale on potential riparian and instream habitat relationships we repeated the riparian vs instream regression analysis including only the mean values for a given riparian variable measurement for 500 m upstream of each of the instream reaches (i.e. the values from five continuous GDZ). For this analysis, our sample size was reduced because some instream habitat reaches were positioned less than 500 m downstream of the upstream end of a riparian survey segment. These reaches were excluded from the analysis. A third ‘reach scale’ regression analysis was undertaken comparing the instream habitat variables with riparian variables in the immediately adjacent GDZ.
To investigate the possibility that significant relationships were being masked by other predictor variables, we conducted multiple linear regressions using the full set of available predictors and a backward model selection process. No further significant relationships were revealed. The small sample size prevented investigation of interaction terms.
The relationship between instream deposited fine sediment and the area of fenced riparian area was examined further by including all data from the instream survey reaches. The observed instream sediment cover levels at a given reach could be the cumulative result of variation in riparian habitat predictors upstream. To account for this, we weighted the response variable (% fine sediment cover) according to the position of the instream survey reach within the riparian survey segment. Instream reaches were weighted sequentially, with reaches located at the top of a survey segment weighted at one 10th of those located at the bottom of the segment. In addition, we also conducted a series of 10 sequenced regression analyses that incrementally included the mean fenced riparian area of contiguous GDZ upstream. Starting at 100 m (reach scale), the fenced riparian area from the adjacent GDZ is used as the predictor value. For each subsequent regression, the mean fenced riparian areas of upstream GDZ were incrementally included (i.e. ≤200 m upstream, ≤300 m upstream etc.). The instream habitat reaches were located randomly within the riparian survey segments. Therefore, sample size was reduced as more GDZ were incrementally included in subsequent regressions.
For fish population data, exploratory analysis was undertaken by constructing regression matrices of instream habitat and fish population variables for both the November and March sampling occasions. As with the riparian and instream habitat data, multiple linear regressions using the full set of available instream habitat predictors were performed.
Results
Instream habitat survey
Overall, 2470 m of the instream habitat (c. 15% of the Waikakahi stream’s total length) and 8500 m of the riparian area (c. 50% of the stream’s length) in the mainstem was surveyed. Mean water velocities for ‘typical’ fast, medium and slow runs were estimated to be 0.6, 0.5 and 0.3 m/s, respectively. Water velocity for fast runs gives an indication of the fastest habitats in the stream (excluding shallow riffles). ‘Slow run’ was the dominant mesohabitat type, averaging 48% of the surveyed habitat (). The depth categories 0–0.3 m and 0.3–0.5 m combined comprised 70% of the surveyed area whereas habitat with water depths exceeding 1 m contributed only 6% (). Macrophyte beds were a dominant feature of the stream, with a mean cover of 38%. Coarse gravel (grain size 16–32 mm) was the most common substratum size category, comprising an estimated 39% of the streambed surface.
Table 1. Mean percentage values (and standard deviations) for instream habitat variables, including mesohabitat type, depths and sediment cover, for all 20 m sub-reaches combined (n = 115). Stream bed sediment categories were only for the visible areas of the stream bed (i.e. areas not obscured by deep water or aquatic macrophytes).
Deposited fine sediment cover was highest in the upper Waikakahi stream. The two uppermost survey segments had mean fine sediment covers of 63% and 36%, respectively, whereas the overall catchment mean was 19%. Fine sediment and fine gravel together made up 39% of the stream bed (). Instream cover was predominantly overhanging vegetation and emergent and submerged aquatic macrophytes (). Undercut banks were also reasonably common comprising 15% of the stream edge. Minor amounts of woody debris, submerged branches and man-made cover objects were present ().
Riparian habitat
Grazed pasture dominated the areas of the GDZ. Ungrazed exotic grasses were the predominant vegetation category within the fenced riparian areas, although minor amounts of other vegetation types were also present (). Exotic willows (Salix spp.), poplars (Populus spp.), pines (Pinus spp.) and macrocarpa (Cupressus macrocarpa) were the most common riparian tree species. Native plantings of trees and grasses associated with restoration projects were present in <0.2% of the catchment’s riparian area. The distribution of riparian vegetation index scores was right skewed, confirming the dominance of rank grass as the most common vegetation type in the catchment. The mean riparian vegetation quality index score was 6840 (range 1990–9540).
Table 2. Mean percentages (and standard deviations) for the coverage of various riparian vegetation categories for all GDZ (n = 86).
Effective stock exclusion fencing occurred in all but four of the 86 GDZ. Evidence of livestock activity (i.e. stock pugging) occurred in seven GDZ. In GDZ where stock pugging occurred, the mean length of pugged areas was 17.6 m/GDZ (range 9.9–32.2 m). Active bank slumping occurred in 23 GDZ; the mean length of slumping was 17.5 m/GDZ (range 3.2–42.5 m). In total, 331 m of bank slumping was recorded in the catchment, or 2% of the total length of surveyed stream bank. Overall, the GDZ had a mean fenced riparian area of 1140 m2 (range 0–3430 m2). This equates to a mean fenced riparian margin width of 5.7 m on each bank (range 0–17.2 m).
Riparian and instream habitat correlations
Overall, 621 regressions were performed for all possible riparian and instream habitat combinations at three spatial scales (reach scale, 100 m; sub-segment scale, 500 m; segment scale, 1000 m). Of these, 198 (or 32%) were statistically significant (P = <0.05). This percentage is far higher than the 31 (just under 5%) significant regressions one would expect to emerge by chance alone. Nevertheless, using a conservative approach, we report only those of primary interest (i.e. those that relate directly to our hypotheses) ().
Table 3. Correlations from an exploratory regression analysis of all riparian and instream habitat variables.
Fenced riparian area was negatively correlated with deposited fine sediment at the sub-segment and segment scales but not at the reach scale. Fenced riparian area was negatively correlated with bank slumping at the reach scale. Fenced riparian area was also negatively correlated with recent stock access (as indicated by stock pugging) at the sub-segment and segment scale, but not at the reach scale. Stock pugging was positively correlated with the occurrence of instream fine sediment at all spatial scales (). Consistent with our hypotheses, the strength of the negative relationship between instream fine sediment cover and fenced riparian area increased as we increased the spatial scale of analysis (). Therefore, this relationship was chosen for more detailed analysis.
Instream fine sediment cover was significantly negatively correlated with the area of ‘fenced riparian area with full stock exclusion’ (henceforth called ‘fenced riparian area’). Furthermore, the strength of this relationship increased over the three scales tested (1 km, 500 m, 100 m). The non-linear, negative shape of the relationship between fenced riparian area and deposited fine sediment at the stream segment scale is illustrated in .
Figure 2. Regression between longitudinally weighted mean % fine sediment cover and mean fenced riparian area per 100 m of stream length (n = 23) for all GDZ within each stream segment (1000 m). Circle size represents the weight (0 through 10) applied to each % fine sediment response value according to the location of the 100 m reach within the 1 km survey segment. For example, fine sediment cover values from a reach at the top of a survey segments were weighed one 10th the value of a reaches at the bottom of the segment.
A significant negative relationship between fenced riparian area (m2) and instream fine sediment cover emerged when a 300 m section of upstream riparian area was included in the sequenced regression analysis (). This relationship was strongest when a 400 m upstream riparian area was included, after which it dropped below the P = 0.05 significance level at 600 m (probably because of reduced sample size). The non-linear, negative shape of the relationship at 400 m upstream riparian area, where it was strongest, is shown in .
Figure 3. Summary of P, adjusted R2 and sample size values for 10 individual (unweighted) sequential regressions of instream fine sediment cover vs mean fenced riparian area. The first regression, at the 100 m reach scale, compares sediment cover in instream survey reaches to fenced riparian area from adjacent GDZ. For each subsequent regression, the fenced riparian area is the mean from upstream GDZ incrementally included in the analysis.
Figure 4. Mean deposited fine sediment cover from 100 m instream reaches regressed against the mean fenced riparian area of four upstream continuous 100 m GDZ (n = 15). The relationship shown (the fourth regression in a sequence of 10 regressions that included predictor variables from upstream areas in 100 m increments) had the strongest R2 value.
Instream habitat and fish populations
Trout and eels averaged three to five individuals (of each species) per 40 m electric fishing reach (range for all species: 0–11 individuals per reach). Trout densities averaged 0.02/m2 in November (range 0.007–0.05) and 0.01/m2 in March (range 0.003–0.03). Brown trout >200 mm outnumbered juvenile trout (<200 mm) 2:1 in November and 10:1 in March. Trout biomass averaged 8.5 g/m2 in November (range 14.1–2.9) and 9.7 g/m2 in March (range 23.9–1.0). Few juvenile eels (<400 mm) were captured on either sampling occasion (three in total). Total eel densities averaged 0.02/m2 during November (range 0.002–0.05) and 0.01/m2 during March (range 0.0–0.02). Longfin eel biomass averaged 15.4 g/m2 in November (range 0–39.7) and 10.2 g/m2 in March (range 0–23.3 g/m2). Shortfin eel biomass averaged 9.7 g/m2 in November (range 0–58.5) and 2.5 g/m2 in March (range 0–15.8).
In November, longfin and shortfin eel densities were negatively related to wetted width (A) whereas, trout biomass showed a positive linear relationship with overhanging vegetation (B). In March, none of these relationships was significant but total trout biomass was positively related to wetted width (C). There were no other significant relationships between fish population metrics and the measured habitat variables.
Figure 5. A, Linear regression between mean density (no./m2) of longfin and shortfin eels (combined) and wetted width (of instream survey reaches) in November 2012; B, mean trout biomass (g/m2) and overhanging (draping) vegetation expressed as mean % cover of the wetted width in November 2012; C, total trout biomass (g) and wetted width in March 2013.
Discussion
Excessive levels of suspended and deposited fine sediment were present throughout the Waikakahi Stream following dairy conversion in the 1980s (Meredith et al. Citation2003). In part, this provided the impetus to implement a catchment-scale fencing initiative. Riparian fencing and improvements to effluent management were suggested as the primary actions that led to a four-fold reduction in suspended fine sediment levels in the Waikakahi over the 10 years of the Dairy Best Practice Catchment programme (Dodd et al. Citation2009; Monaghan et al. Citation2009). The present study shows that stock exclusion fencing, as part of a wider best practice programme, can provide significant benefits by increasing bank stability and maintaining relatively low levels of deposited fine sediment instream.
Fish habitat
We found a significant negative relationship between instream fine sediment cover and fenced riparian area in the Waikakahi catchment, supporting our first hypothesis that relatively wide fenced riparian areas would have a positive influence on various aspects of instream eel and trout structural habitat quality. Moreover, consistent with hypothesis two, the strength of this relationship emerged as significant as the spatial scale of analysis was increased. Sequenced regressions that included the fenced area upstream as a predictor variable, in increments of 100 m, showed that the negative response of deposited fine sediment to fenced riparian area emerged as significant at ≥300 m ( and ). This suggests that the relatively large fenced riparian areas that are present along at least 300 m lengths of the Waikakahi stream maintain relatively low levels of deposited fine sediment downstream.
Decreased stock access, increased bank stability and increased filtering of overland flow are all potential mechanisms by which relatively large fenced riparian areas can reduce fine sediment entering a stream (Trimble & Mendel Citation1995; Wood & Armitage Citation1999; Lyons et al. Citation2000; Pusey & Arthington Citation2003). Indeed, relatively large fenced riparian areas appear to have a localised stabilising effect on adjacent stream banks in the Waikakahi catchment. Fenced riparian area was negatively correlated with the occurrence of active bank slumping at the reach scale. In addition, relatively large riparian areas also appear to afford better stream bank protection from stock. Stock activity, as evidenced by pugging on the stream margins, was significantly negatively related to fenced riparian area at the sub-segment and segment scale but not at the reach scale, indicating that stock travelled short distances from riparian access points before accessing water logged soil. Unsurprisingly, recent stock pugging within the riparian management area was significantly positively related to deposited fine sediment cover in the adjacent stream reach. The effect strength of this relationship increased cumulatively with regressions that accounted for greater upstream areas (). These results agree with an established body of research linking stream edge stock activity to sediment input in streams (e.g. Trimble & Mendel Citation1995).
Riparian vegetation can have a stabilising effect on stream banks, although in some instances larger trees have been shown to cause channel instability (Sweeney & Newbold Citation2014). In our study, there was no apparent effect of riparian vegetation category type on bank stability at the various spatial scales investigated. However, the Waikakahi catchment lacks substantial areas of established dense riparian trees. Therefore, our analysis is limited to comparing fallow exotic grasses with short reaches of flax plantings or areas with sparsely planted exotic trees and (wilding) willows. All GDZ had low vegetation index scores (range 1990–9540) relative to the maximum possible score (60,000).
Fine sediment cover was highest in the upper Waikakahi Stream suggesting limited sediment transport capacity between survey segments. A similar pattern of relatively high deposited sediment levels in upper catchments of small Canterbury Plain drains and streams was observed by Greenwood et al. (Citation2012). The bed-flushing power of the Waikakahi Stream is augmented by Waitaki River irrigation water (Meredith et al. Citation2003). This augmented flow probably complements the riparian fencing initiative by flushing stored sediment, the legacy of dairy conversion and subsequent poor farming practices, reducing chronic sediment load and increasing stream flushing power via encroachment of stream-edge vegetation narrowing the channel (Greenwood et al. Citation2012). We cannot discount that flushing power, and hence sediment transport rates, vary moderately throughout the low gradient mainstem. However, channel form is similar over the entire sample frame and the channel widens to accommodate the moderately increased flows downstream. Meredith et al. (Citation2003) reports that high deposited sediment levels were ubiquitous throughout the catchment following dairy conversion. This suggests that conditions conducive to fine sediment loading and deposition were likewise similar throughout the catchment prior to the stream fencing initiative.
Fish populations
Overall, and contrary to our third hypothesis, we did not find consistently higher fish densities or biomass in reaches with ‘high’ habitat quality (i.e. relatively large amounts of fish cover, low amounts of deposited fine sediment and relatively deep water). Native eels and exotic brown trout were sparse and evenly distributed throughout the catchment on both sampling occasions, numbering just 0–11 individuals (of each species) per 40 m electric fishing reach. Possibly, there was too little differentiation between our high- and low-quality habitat reaches to influence fish distributions within the catchment. Alternatively, our reach-scale habitat and fish population survey was too coarse to detect any fish–habitat linkages at the low population densities observed. Densities of trout were an order of magnitude lower than those observed in streams that are approaching carrying capacity (Hayes Citation1988; Grant & Kramer Citation1990; Ayllón et al. Citation2010). Similarly, densities of both long- and short-finned eels were very low compared with a survey of small streams from a range of land-use types that had not been commercially fished (Hicks & McCaughan Citation1997). Even our ‘low habitat quality’ electric fishing reaches had patch scale (1–5 m2) cover features (e.g. macrophyte beds or small pockets of deep water) that could have provided adequate cover for one or two large eels. As with trout, the low densities of eels across all our sampling reaches probably meant that habitat was not saturated, so we observed little discrimination in abundance over the habitat quality gradient. A third reason is that electric fishing may have been more effective in the shallower, less structurally complex ‘low quality’ fishing sites. Deeper water and relatively large amounts of vegetative debris in the high-quality sites may have allowed fish to evade capture during all electric fishing passes (Hickey & Closs Citation2006).
Hay (Citation2004) conducted a trout spawning survey in the Waikakahi Stream and suggested that the trout population may be recruitment limited. He observed high egg mortality rates and suggested this was as a result of excessive levels of deposited fine sediment and possibly high nitrate concentrations. In our survey, adult trout outnumbered juvenile trout in all reaches during both sampling occasions, which would be consistent with Hay’s hypothesis. Olsson & Persson (Citation1988) found that deposited fine sediment cover levels >20% negatively affected trout embryo survival rates. Our survey revealed that deposited fine sediment levels in the Waikakahi catchment are generally above this threshold, especially in the upper catchment.
In the case of eels (which do not reproduce instream) there is no clear reason for the apparent low densities. The Waikakahi, a tributary of the Waitaki River, is a low-elevation catchment near the coast with low flow variability and no known passage barriers for elvers migrating upstream. However, based on elva catches at the base of the Waitaki Dam over the past decade, recruitment of longfin and shortfin eels in the Waitaki River system may be minimal in comparison with the available habitat (Jellyman Citation2012). In addition, our study could not account for the possibility of commercial fishing occurring. Eel fishers selectively target ‘high-quality habitat’ in easily accessible lowland streams such as the Waikakahi. Furthermore, commercial fishing methods can substantially reduce eel biomass in a single night and population recovery may take up to 10 years if immigration is factored out (Chisnall et al. Citation2003; Jellyman & Graynoth Citation2005).
Good practice riparian management
The New Zealand dairy industry’s ‘Sustainable Dairying: Water Accord’ (2013) currently recommends that streams wider than 1 m should be fenced, but it provides no guidance on how wide riparian fencing should be. A recent review and meta-analysis by Sweeney & Newbold (Citation2014) concluded that riparian areas should be at least 30 m wide to protect key aspects of forested small stream ecosystems. Thirty metre wide forested riparian management areas are obviously unrealistic within intensively farmed pastoral landscapes. However, our findings suggest that some instream values, particularly those linked to deposited fine sediment (e.g. salmonid spawning and juvenile eel habitats), may already be protected by substantially narrower riparian areas.
Reducing or maintaining fine sediment cover below 20% could be an appropriate target to protect invertebrate food resources and recruitment of eels and trout in streams (Olsson & Persson Citation1988; Crisp & Carling Citation1989; Clapcott et al. Citation2011; Burdon et al. Citation2013). In our study, on average, deposited fine sediment levels were below 20% in 1 km stream segments that had 1000 m2 of fenced riparian area per 100 stream m (). This area equates to a mean fenced width of 5 m along each bank. We put this figure forward as an interim recommendation for wadeable spring-fed streams, with the caution that it is based on a correlative study in a single stream catchment and is unlikely to be directly transferable to rain-fed streams. We expect that wider fenced riparian areas would be required in streams with greater erosive power, although decreased channel stability, and thus increased sediment loading, might be countered by increased flushing of bed sediments.
Further research is needed to determine if riparian fencing widths, that adequately protect instream values, vary in proportion with catchment and segment-scale parameters (for instance, land use, flow source, stream geomorphology or disturbance regime). In anticipation of this research, our paper presents a survey and analysis method that can be applied on a catchment-by-catchment basis to indicate the riparian fencing widths required to reduce instream deposited fine sediment below a target value.
Supplementary data
Field protocol S1.
Field protocol S2.
Field protocol S2.
Download MS Word (31.6 KB)Field protocol S1.
Download MS Word (106 KB)Acknowledgements
We would like to thank the following people who assisted us with fieldwork: Mark Webb, Graeme Hughes, Hamish Stevens (Fish & Game New Zealand) and Mary Beech (Environment Canterbury). Thanks also to all Waikakahi Catchment farmers for granting access throughout the stream and to Robin Murphy (Morven Glenavy Ikawai Irrigation Company) for help with farmer liaison. Thanks to Rasmus Gabrielsson for help with logistics in the field and for general discussions on the topic of fish habitat.
Associate Editor: Dr Joanne Clapcott.
Disclosure statement
No potential conflict of interest was reported by the authors.
Additional information
Funding
Related Research Data
References
- Allan DJ. 2004. Landscapes and riverscapes: the influence of land use on stream ecosystems. Annual Review of Ecology, Evolution, and Systematics. 35:257–284. doi: 10.1146/annurev.ecolsys.35.120202.110122
- Allouche S. 2002. Nature and functions of cover for riverine fish. Bulletin Francais De La Peche Et De La Pisciculture. 365:297–324. doi: 10.1051/kmae:2002037
- Ayllón D, Almodóvar A, Nicola GG, Elvira B. 2010. Modelling brown trout spatial requirements through physical habitat simulations. River Research Applications. 26:1090–1102. doi: 10.1002/rra.1315
- Bash JS, Ryan CM. 2002. Stream restoration and enhancement projects: is anyone monitoring? Environ Manage. 29:877–885. doi: 10.1007/s00267-001-0066-3
- Beentjes MP, Boubée JAT, Jellyman DJ, Graynoth E. 2005. Non-fishing mortality of freshwater eels (Anguilla spp.). New Zealand Fisheries Assessment Report, Ministry of Fisheries, No. 34, Wellington.
- Biggs BJE, Kilroy C. 2000. Stream preriphyton monitoring manual. NIWA technical report ISBN 0-478-09099-4. Prepared for New Zealand Ministry for Environment. 233p.
- Bjornn TC, Brusven MA, Molnau MP, Milligan JH, Klamt RA, Chacho E, Schaye C. 1977. Transport of granitic sediment in streams and its effects on insects and fish. Forest, Wildlife and Range Experiment Station bulletin. Prepared for University of Idaho. 43 p.
- Burdon FJ, McIntosh AR, Harding JS. 2013. Habitat loss drives threshold response of benthic invertebrate communities to deposited sediment in agricultural streams. Ecol Appl. 23:1036–1047. doi: 10.1890/12-1190.1
- Chisnall BL, Hicks BJ, Martin ML. 2003. Effect of harvest on size, abundance, and production of freshwater eels Anguilla australis and A. dieffenbachii in a New Zealand stream. In: Dixon DA, editor. Biology, management, and protection of catadromous eels. Bethesda, Maryland: American Fisheries Society, Symposium 33; p. 177–189.
- Clapcott JE, Young RG, Harding JS, Matthaei CD, Quinn JM, Death RG. 2011. Sediment assessment methods: protocols and guidelines for assessing the effects of deposited fine sediment on in-stream values. Cawthron Institute, Nelson, New Zealand.
- Crisp DT, Carling PA. 1989. Observations on siting, dimensions and structure of salmonid redds. J Fish Biol. 34:119–134. doi: 10.1111/j.1095-8649.1989.tb02962.x
- DeWalle DR. 2010. Modeling stream shade: riparian buffer height and density as important as buffer width. J Am Water Resour Assoc. 46:323–333. doi: 10.1111/j.1752-1688.2010.00423.x
- Dodd M, Wilcock B, Parminter T. 2009. Review of recent rural catchment-based research in New Zealand. AgResearch and National Institute of Water and Atmospheric Research Report, prepared for MAF policy. 121 p.
- Duncan SH, Ward JW. 1985. The influence of watershed geology and forest roads on the composition of salmon spawning gravel. Northwest Sci. 59:204–212.
- Glova GJ. 2002. Density effects on juvenile shortfinned eel (Anguilla australis) cover preferences in replicate channels. New Zeal J Mar Fresh. 36:483–490. doi: 10.1080/00288330.2002.9517103
- Glova GJ, Jellyman DJ, Bonnett ML. 1998. Factors associated with the distribution of habitat of eel (Anguilla spp.) in three New Zealand lowland streams. New Zeal J Mar Fresh. 32:255–269. doi: 10.1080/00288330.1998.9516824
- Grant JWA, Kramer DL. 1990. Territory size as a predictor of the upper limit to population-density of juvenile salmonids in streams. Can J Fish Aquat Sci. 47:1724–1737. doi: 10.1139/f90-197
- Greenwood MJ, Harding JS, Niyogi DK, McIntosh AR. 2012. Improving the effectiveness of riparian management for aquatic invertebrates in a degraded agricultural landscape: stream size and land-use legacies. J Appl Ecol. 49:213–222. doi: 10.1111/j.1365-2664.2011.02092.x
- Harding JS, Clapcott JE, Quinn JM, Hayes JW, Joy MK, Greig HS, James T, Beech M, Ozane R, Hay J, et al. 2009. Stream habitat assessment protocols for wadeable rivers and streams of New Zealand. Christchurch: University of Canterbury Press; p. 133.
- Hay J. 2004. Survival of trout eggs in relation to sediment composition of redds in Waikakahi Stream. Prepared for Fish & Game New Zealand. Cawthron Report No. 965 p.
- Hayes JW. 1988. Mortality and growth of juvenile brown and rainbow trout in a lake inlet nursery stream, New Zealand. New Zeal J Mar Fresh. 22:40–47.
- Hickey MA, Closs GP. 2006. Evaluating the potential of night spotlighting as a method for assessing species composition and brown trout abundance: a comparison with electrofishing in small streams. J Fish Biol. 69:1513–1523. doi: 10.1111/j.1095-8649.2006.01215.x
- Hicks BJ, McCaughan HMC. 1997. Land use, associated eel production, and abundance of fish and crayfish in streams in Waikato. New Zeal J Mar Fresh. 31:635–650. doi: 10.1080/00288330.1997.9516795
- Hillman M, Brierley G. 2005. A critical review of catchment-scale stream rehabilitation programmes. Prog Phys Geog. 29:50–76. doi: 10.1191/0309133305pp434ra
- Holmes R, Goodwin E, Hayes JW. 2013. Development of a GIS-based index to assess riparian habitat quality in a dairy best practice catchment. Cawthron Report No. 2350. 32 p.
- Holmes R, Hayes JW. 2011. Broad-scale trout habitat mapping for streams (Using Aerial Photography and GIS). Cawthron Report. No. 1979. 40 p.
- Jellyman DJ. 2012. The status of longfin eels in New Zealand—an overview of stocks and harvest NIWA client report. Prepared for Parliamentary Commissioner for the Environment. No. CHC2012-006. 78 p.
- Jellyman DJ, Graynoth E. 2005. The use of fyke nets as a quantitative capture technique for freshwater eels (Anguilla spp.) in rivers. Fisheries Manag Ecol. 12:237–247. doi: 10.1111/j.1365-2400.2005.00445.x
- Jellyman DJ, Unwin MJ, James GD. 2003. Anglers’ perceptions of the status of New Zealand lowland rivers and their trout fisheries. National Institute of Water and Atmospheric Research Technical Report No. 122.
- Jowett IG, Richardson J. 2008. Habitat use by New Zealand fish and habitat suitability models. National Institute of Water and Atmospheric Research Technical Report No. 55.
- Jowett IG, Richardson J, Boubee JAT. 2009. Effects of riparian manipulation on stream communities in small streams: two case studies. New Zeal J Mar Fresh. 43:763–774. doi: 10.1080/00288330909510040
- Keller CR, Burnham KP. 1982. Riparian fencing, grazing, and trout habitat preference on summit creek, Idaho. N Am J Fish Manage. 2:53–59. doi: 10.1577/1548-8659(1982)2<53:RFGATH>2.0.CO;2
- Kondolf GM, Micheli E. 1995. Evaluating stream restoration projects. Environ Manage. 19:1–15. doi: 10.1007/BF02471999
- Larned ST, Scarsbrook MR, Snelder TH, Norton NJ, Biggs BJF. 2004. Water quality in low elevation streams and rivers of New Zealand: recent state and trends in contrasting land cover classes. New Zeal J Mar Fresh. 38:347–366. doi: 10.1080/00288330.2004.9517243
- Lester RE, Boulton AJ. 2008. Rehabilitating agricultural streams in Australia with wood: a review. Environ Manage. 42:310–326. doi: 10.1007/s00267-008-9151-1
- Lyons J, Weigel BM, Paine LK, Undersander DJ. 2000. Influence of intensive rotational grazing on bank erosion, fish habitat quality, and fish communities in south-western Wisconsin trout streams. J Soil Water Conserv. 55:271–276.
- Matthaei CD, Weller F, Kelly DW, Townsend CR. 2006. Impacts of fine sediment addition to tussock, pasture, dairy and deer farming streams in New Zealand. Freshwater Biol. 51:2154–2172. doi: 10.1111/j.1365-2427.2006.01643.x
- McDowall RM. 1994. Game keepers for the nation, 1861–1990. Christchurch, New Zealand: Canterbury University Press.
- McDowall RM. 2011. Ikawai. Freshwater fishes in Māori culture and economy. Christchurch, New Zealand: Canterbury University Press.
- Meredith A, Smith Z, Lavender R. 2003. Waikakahi stream: assessment of water quality and ecosystem monitoring, 1995–2002. Environment Canterbury, Report No. R03/14, Christchurch.
- Monaghan RM, Carey PL, Wilcock RJ, Drewry JJ, Houlbrooke DJ, Quinn JM, Thorrold BS. 2009. Linkages between land management activities and stream water quality in a border dyke-irrigated pastoral catchment. Agr Ecosyst Environ. 129:201–211. doi: 10.1016/j.agee.2008.08.017
- Mossop B, Bradford MJ. 2006. Using thalweg profiling to assess and monitor juvenile salmon (Oncorhynchus spp.) habitat in small streams. Can J Fish Aquat Sci. 63:1515–1525. doi: 10.1139/f06-060
- Niyogi DK, Koren M, Arbuckle CJ, Townsend CR. 2007. Longitudinal changes in biota along four New Zealand streams: declines and improvements in stream health related to land use. New Zeal J Mar Fresh. 41:63–75. doi: 10.1080/00288330709509896
- Olsson TI, Persson BG. 1988. Effects of deposited sand on ova survival and alevin emergence in brown trout (Salmo trutta L.). Archiv für Hydrobiologie. 113:621–627.
- Palmer MA, Ambrose RF, Poff NL. 1997. Ecological theory and community restoration ecology. Restor Ecol. 5:291–300. doi: 10.1046/j.1526-100X.1997.00543.x
- Parkyn SM, Davies-Colley RJ, Halliday NJ, Costley KJ, Croker GF. 2003. Planted riparian buffer zones in New Zealand: do they live up to expectations? Restor Ecol. 11:436–447. doi: 10.1046/j.1526-100X.2003.rec0260.x
- Platts WS, Wagstaff FJ. 1984. Fencing to control livestock grazing on riparian habitats along streams: is it a viable alternative? N Am J Fish Manage. 4:266–272. doi: 10.1577/1548-8659(1984)4<266:FTCLGO>2.0.CO;2
- Pusey BJ, Arthington AH. 2003. Importance of the riparian zone to the conservation and management of freshwater fish: a review. Mar Freshwater Res. 54:1–16. doi: 10.1071/MF02041
- Quinn JM. 2000. Effects of pastoral development. In: Collier KJ, Winterbourn MJ, editors. New Zealand stream invertebrates: ecology and implications for management. Christchurch: New Zealand Limnological Society; p. 208–229.
- Quinn JM, Cooper AB, Davies-Colley RJ, Rutherford JC, Williamson RB. 1997. Land use effects on habitat, water quality, periphyton, and benthic invertebrates in Waikato, New Zealand, hill-country streams. New Zeal J Mar Fresh. 31:579–597. doi: 10.1080/00288330.1997.9516791
- Raleigh RF, Zuckerman LD, Nelson PC. 1986. Habitat suitability index models and instream flow suitability curves: brown trout, revised. Technical Report prepared for U.S. Fish and Wildlife Service.
- Richardson J, Jowett IG. 2002. Effects of sediment on fish communities in East Cape streams, North Island, New Zealand. New Zeal J Mar Fresh. 36:431–442. doi: 10.1080/00288330.2002.9517098
- Roni P, Beechie TJ, Bilby RE, Leonetti FE, Pollock MM, Pess GR. 2002. A review of stream restoration techniques and a hierarchical strategy for prioritizing restoration in Pacific Northwest watersheds. N Am J Fish Manage. 22:1–20. doi: 10.1577/1548-8675(2002)022<0001:AROSRT>2.0.CO;2
- Sternecker K, Geist J. 2010. The effects of stream substratum composition on the emergence of salmonid fry. Ecol Freshw Fish. 19:537–544. doi: 10.1111/j.1600-0633.2010.00432.x
- Stevens DL, Olsen AR. 2004. Spatially balanced sampling of natural resources. J Am Stat Assoc. 99:262–278. doi: 10.1198/016214504000000250
- Stewart GB, Bayliss HR, Showler DA, Sutherland WJ, Pullin AS. 2009. Effectiveness of engineered in-stream structure mitigation measures to increase salmonid abundance: a systematic review. Ecol Appl. 19:931–941. doi: 10.1890/07-1311.1
- Stewart-Koster B, Bunn SE, MacKay SJ, Poff NL, Naiman RJ, Lake PS. 2010. The use of Bayesian networks to guide investments in flow and catchment restoration for impaired river ecosystems. Freshwater Biol. 55:243–260. doi: 10.1111/j.1365-2427.2009.02219.x
- Summers DW, Giles N, Stubbing DN. 2008. Rehabilitation of brown trout, Salmo trutta, habitat damaged by riparian grazing in an English chalkstream. Fisheries Manage Ecol. 15:231–240. doi: 10.1111/j.1365-2400.2008.00604.x
- Sutherland AB, Meyer JL, Gardiner EP. 2002. Effects of land cover on sediment regime and fish assemblage structure in four southern Appalachian streams. Freshwater Biol. 47:1791–1805. doi: 10.1046/j.1365-2427.2002.00927.x
- Sweeney BW, Newbold JD. 2014. Streamside forest buffer width needed to protect stream water quality, habitat and organisms: a literature review. J Am Water Resour As. 50:560–584. doi: 10.1111/jawr.12203
- Trimble SW, Mendel AC. 1995. The cow as a geomorphic agent—a critical review. Geomorphology. 13:233–253. doi: 10.1016/0169-555X(95)00028-4
- US EPA. 2015. United States environmental protection agency web site. Aquatic resource monitoring; [cited 2015 February 25]. Available from: http://www.epa.gov/owow/monitoring/volunteer/stream/stream.pdf.
- Wahl CM, Neils A, Hooper D. 2013. Impacts of land use at the catchment scale constrain the habitat benefits of stream riparian buffers. Freshwater Biol. 58:2310–2324.
- Waters TF. 1995. Sediment in streams: sources, biological effects and control. American Fisheries Society: Monograph 7. 251 p.
- Wentworth CK. 1922. A scale of grade and class terms for clastic sediments. J Geol. 30:377–392. doi: 10.1086/622910
- Wilcock RJ, Monaghan RM, Thorrold BS, Meredith AS, Betteridge K, Duncan MJ. 2007. Land-water interactions in five contrasting dairying watersheds: issues and solutions. Land Use and Water Resources Research. 7:2.1–2.10.
- Wilcock RJ, Nagels JW, Rodda HJE, O'Connor MB, Thorrold BS, Barnett JW. 1999. Water quality of a lowland stream in a New Zealand dairy farming catchment. New Zeal J Mar Fresh. 33:683–696. doi: 10.1080/00288330.1999.9516911
- Wood PJ, Armitage PD. 1997. Biological effects of fine sediment in the lotic environment. Environ Manage. 21:203–217. doi: 10.1007/s002679900019
- Wood PJ, Armitage PD. 1999. Sediment deposition in a small lowland stream—management implications. Regulated Rivers—Research and Management. 15:199–210. doi: 10.1002/(SICI)1099-1646(199901/06)15:1/3<199::AID-RRR531>3.0.CO;2-0
- Yuan YP, Bingner RL, Locke MA. 2009. A review of effectiveness of vegetative buffers on sediment trapping in agricultural areas. Ecohydrology. 2:321–336. doi: 10.1002/eco.82
- Zhang XY, Liu XM, Zhang MH, Dahlgren RA, Eitzel M. 2010. A review of vegetated buffers and a meta-analysis of their mitigation efficacy in reducing nonpoint source pollution. J Environ Qual. 39:76–84. doi: 10.2134/jeq2008.0496