
ABSTRACT
In this study, the effects of linoleic acid on the growth, photosynthetic activities and oxidative system of the invasive cyanobacterium Cylindrospermopsis raciborskii were investigated. The results indicated that linoleic acid decreased the growth rate and chlorophyll a concentration in C. raciborskii after 48 h incubation. The maximum photochemical efficiency (Fv/Fm) of photosystem II (PSII) and maximum relative electron transport rate (ETRmax) decreased significantly at concentrations higher than 1 mg L−1. However, non-photochemical quenching (NPQ) significantly increased when cultured at concentrations of 0.5, 1, 2 and 4 mg L−1. PSII electron transfer rate and chlorophyll a fluorescence transients appeared to be affected after the cells were exposed to higher concentrations of linoleic acid; the density of the reaction centres (RCs), quantum energy flux ratios and the performance index on absorption basis decreased, but absorption flux per RC and dissipated energy flux per RC increased. Malondialdehyde content, superoxide dismutase and catalase activities were enhanced when exposed to 2 and 4 mg L−1 of linoleic acid. This suggests that the blockage of electron transport on the donor and acceptor sides of PSII is the mechanism responsible for the toxicity of linoleic acid in PSII of C. raciborskii.
Introduction
The cyanobacterium Cylindrospermopsis raciborskii is a nitrogen-fixing filamentous species found in many eutrophic freshwater lakes and reservoirs worldwide (Padisák Citation1997). It has been described as an invasive species because of its increased occurrence in temperate regions (Sinha et al. Citation2012). This causes many problems, such as oxygen depletion, deterioration in water quality and decline in water transparency (Paerl et al. Citation2001). Moreover, C. raciborskii produces diverse toxins such as cylindrospermospin and paralytic shellfish poisons that are harmful to zooplankton, fish, shellfish and humans (Ohtani et al. Citation1992; Lagos et al. Citation1999; Fastner et al. Citation2003). Therefore, control of Cylindrospermopsis blooms is crucial for the maintenance of water supply safety.
Previous studies have demonstrated that chemical algicides (Hrudey et al. Citation1999) can efficiently control cyanobacterial blooms. However, subsequent secondary pollution was observed to influence the ecosystem of the water bodies due to a toxic to other aquatic biology via the algicides or their degradation products (Anderson Citation1997). Therefore, biological control was considered a promising strategy for controlling cyanobacterial blooms (Choi et al. Citation2005). Recently, aquatic macrophytes have been proven to produce many algicidal compounds such as eugenin (Saito et al. Citation1989), ellagic acid (Nakai et al. Citation2000), nonanoic acid (Nakai et al. Citation2005), pyrogallic acid (Dziga et al. Citation2007) and N-phenyl-2-naphthylamine (Qian et al. Citation2009). These compounds showed different allelopathic effects on growth and photosynthesis in cyanobacteria (Saito et al. Citation1989; Nakai et al. Citation2005; Dziga et al. Citation2007). Among these compounds, polyunsaturated fatty acids were thought to be potential promising algicides due to their significantly allelopathic effect on inhibiting several phytoplanktons at low concentrations (Alamsjah et al. Citation2005) with little negative affect on marine organisms (Alamsjah et al. Citation2008). Linoleic acid isolated from Typha latifolia (Aliotta et al. Citation1990) is a common polyunsaturated fatty acid. Alamsjah et al. (Citation2008) indicated that linoleic acid was significantly active against the growth of Chattonella antiqua, Chattonella marina, Fibrocapsa japonica, Heterosigma akashiwo and Karenia mikimotoi, as well as moderately effective against Heterocapsa circularisquama, Prorocentrum minimum and Prorocentrum sigmoides. A previous study has shown that linoleic acid inhibited the growth of Microcystis aeruginosa by affecting O2– generation, which induced lipid peroxidation of the cell membrane, changed the penetrability of the cell membrane, resulted in damage to DNA and some macromolecules, inhibited the synthesis of the chlorophyll a and PsbA protein of PSII (D1 proteins) and destroyed algal cells (Zhang et al. Citation2009). However, there is little information on the effects of linoleic acid on species that belong to the genus Cylindrospermopsis.
Cylindrospermopsis raciborskii, a N2-fixing filamentous cyanobacterium, is attracting increasing concern worldwide due to its ability to produce diverse toxins, including cylindrospermopsin and neurotoxins, as well as other, as yet unidentified, toxins (Lagos et al. Citation1999; Humpage et al. Citation2000). Moreover, C. raciborskii is regarded as an invasive cyanobacterial species as a result of the increasing occurrence of population blooms in temperate regions (Padisák Citation1997; Sinha et al. Citation2012). Controlling the growth of Cylindrospermopsis in water could, therefore, play a critical role in limiting the occurrence of harmful algal bloom (HAB) conditions. In the present study, two aspects of the possible effect of linoleic acid on Cylindrospermopsis were investigated. First, chlorophyll a concentration, growth rate and oxidative system of C. raciborskii cultured with varying concentrations of linoleic acid were determined. Second, fluorescence kinetic parameters for chlorophyll a on PSII were also monitored when cultured with varying concentrations of linoleic acid.
Materials and methods
Strain and culture conditions
Cylindrospermopsis raciborskii FACHB-1096 was provided by the Freshwater Algae Culture Institute of Hydrobiology, Chinese Academy of Science. The alga was cultured in liquid medium for algae (MA) (Ichimura Citation1979) at 25 ± 1 °C in an incubator under a constant light intensity of 35 µmol photons·m−2·s−1 with a light:dark cycle of 12:12, and shaken three times every day.
Experimental design
Cylindrospermopsis raciborskii were harvested in the exponential growth phase by centrifugation at 4000 × g for 10 min, washed twice in fresh MA medium, and divided into 18 equal volumes. Linoleic acid solution (Aladdin) was added to the cultures and diluted to the following concentrations: 0.1, 0.5, 1, 2 and 4 mg L−1 on the basis of previous studies (Alamsjah et al. Citation2005; Zhang et al. Citation2009) and a preliminary experiment. Cultures without linoleic acid were used as negative controls. All treatments were carried out in triplicate and cultured for 48 h under the same conditions described above. The initial concentration of C. raciborskii in each treatment was 104 cells·mL−1.
Chlorophyll ɑ concentration and mean growth rate
Growth of the cultures was monitored daily by measuring cell optical density at 680 nm (OD680) with a UV visible spectrophotometer (UV2550; Shimadzu Corporation). Cell density number was determined using a hemocytometer chamber under a Nikon CE-I microscope (Nikon Corp.). The number of cell filaments was obtained by: first, measuring the size and cell number of different individuals in order to count the mean cell number per unit; second, determining the size of each filament; and, finally, converting individual size to cell number. Chlorophyll a was extracted with 90% acetone and measured according to the method described by Nusch (Citation1980). Mean growth rate (μ) was calculated using the following equation:where Ct2 and Ct1 are cell density concentrations at times t2 and t1, respectively.
Photosynthetic efficiency of PSII measurement
After 48 h culture, cells were used to measure chlorophyll fluorescence parameters with a pulse-amplitude-modulated fluorescence monitoring system (Phyto-PAM). After the cells were dark-adapted for 20 min, F0 (original fluorescence) and Fm (maximum fluorescence) were measured under a low measuring light and a saturation light pulse, respectively. F0′ (minimal fluorescence of light-adapted cells) and Fm′ (maximum fluorescence of light-adapted cells) were measured without dark adaptation under a low measuring light and a saturation light pulse, respectively. Maximum photochemical efficiency of PSII (Fv/Fm), relative electron transport rate (rETR) and non-photochemical quenching (NPQ) were calculated as follows: Fv/Fm = (Fm–F0)/Fm (Ting & Owens Citation1992); rETR = (Fm′–Fs)/Fm′ × 0.42 × photosynthetic photo flux density (Schreiber et al. Citation1998); and NPQ = Fm/Fm′ – 1 (Kromkamp & Forster Citation2003). Rapid light curves (RLC) were determined after dark adapting cells for 20 min. Fluorescence was measured under a sequence of actinic light levels: 1, 32, 64, 192, 320, 512, 704, 960, 1088 and 1216 μmol photons m−2 s−1 at 30 s intervals between light levels. Non-linear curve fitting was performed with Origin v6.1 (Microcal Software) according to the methods of Platt et al. (Citation1980).
Malondialdehyde, catalase and superoxide dismutase assays
Forty-eight hours after inoculation, a 40 mL algal sample was centrifuged at 5000 × g at 4 °C. The algae cell was ground in liquid nitrogen and extracted in 4 mL of 0.05 mol L−1 potassium phosphate buffer (pH 7.8). The extract was centrifuged for 5 min at 5000 × g at 4 °C. The supernatant was used for a lipid peroxidation product (malondialdehyde [MDA]), and antioxidant enzymes (superoxide dismutase [SOD] and catalase [CAT]) analyses. MDA was assayed using the thiobarbituric acid method (Uchimaya & Mihara Citation1978). CAT and SOD activities were determined according to the methods published by Choo et al. (Citation2004) and Wu et al. (Citation2007), respectively. Total soluble protein (TSP) content was determined using the Coomassie Blue dye-binding assay (Bradford Citation1976), with bovine serum albumin as the standard protein.
Chlorophyll fluorescence measurement
Forty-eight hours after inoculation, all samples were dark-adapted for 20 min before chlorophyll a fluorescence measurements. Polyphasic chlorophyll a fluorescence transients were measured using the Handy-Plant Efficiency Analyzer (Handy-PEA, Hansatech) with an actinic light of 3000 µmol quanta·m−2·s−1. The fluorescence signals were recorded within a period of 10 µs to 2 s. Normalised chlorophyll a fluorescence transient curves were plotted on a logarithmic time scale, known as the JIP test (Strasser et al. Citation1995).
The following data were directly obtained from the chlorophyll a fluorescence kinetic curves: F0, initial fluorescence was determined at 50 μs when all PSII reaction centres (RCs) were open; FJ and FI, fluorescence intensity at step J (2 ms) and step I (30 ms), respectively; Fm, maximum fluorescence at step P when all RCs were closed; and F300, fluorescence at 300 μs. Several parameters, selected to quantify the PSII behaviour of C. raciborskii, were calculated from the above mentioned original data, as shown in (Strasser & Strasser Citation1995).
Table 1. JIP test parameters with explanations and formulae (Strasser & Strasser Citation1995) calculated using data extracted from the O-J-I-P fast fluorescence transient.
Statistical analysis
All treatments were carried out in triplicate. Mean and standard deviation (SD) values were calculated for each treatment. All analyses were performed using SPSS v16.0 (IBM) and Origin software v8.6 (OriginLab Corp.). Significance of the differences between the control and various treatments was determined using one-way analysis of variance (ANOVA) and the t-test. Statistical significance was accepted when the P value was less than 0.05.
Results
Cell growth and chlorophyll a inhibition
After 48 h of incubation in different concentrations of linoleic acid, mean growth rate (μ) and chlorophyll a concentration for C. raciborskii were observed (). Compared with the controls, chlorophyll a concentration deteriorated significantly with increasing linoleic acid concentrations (P < 0.05, ANOVA; A). After 48 h of exposure, mean growth rate (μ) was significantly decreased by 58% and 85% in the 2 and 4 mg L−1 treatments, respectively (P < 0.05, ANOVA; B) when compared with the control (P < 0.05, ANOVA; B). Additionally, EC50 of linoleic acid for C. raciborskii was 1.288 ± 0.454 mg L−1.
Figure 1. Parameters observed when Cylindrospermopsis raciborskii was exposed to 0, 0.1, 0.5, 1, 2 and 4 mg·L−1 of linoleic acid for 48 h. A, Chlorophyll a concentration; B, mean growth rate (μ).
Rapid light curve and photosynthetic parameters of PSII
RLC behaviours in C. raciborskii were dramatically different at different concentrations of linoleic acid (). A marked decrease in the initial slope of the RLC (α), the maximal rETR through PSII (ETRmax) and the maximum quantum yield (Fv/Fm) was found following incubation at 1, 2 and 4 mg L−1 of linoleic acid (P < 0.05, ANOVA; ). However, NPQ markedly increased at 0.5, 1, 2 and 4 mg L−1, in contrast to the 0 and 0.1 mg L−1 treatments (P < 0.05, ANOVA; ).
Figure 2. Rapid light curves of Cylindrospermopsis raciborskii exposed to 0, 0.1, 0.5, 1, 2 and 4 mg L−1 of linoleic acid for 48 h. Values shown are the means of three replicates ± SD.
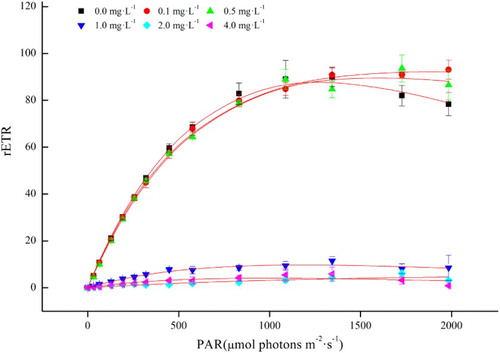
Table 2. Changes in photosynthetic parameters following different concentration treatments of linoleic acid in C. raciborskii.
Chlorophyll a fluorescence
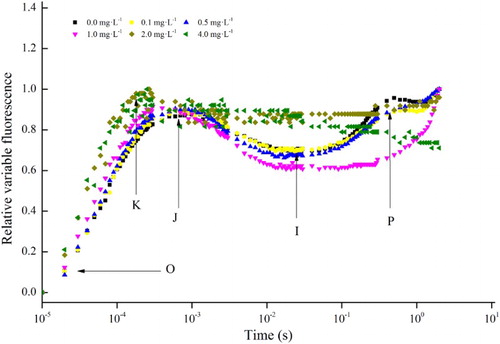
Fluorescence induction kinetics of chlorophyll a in cells treated with increasing concentrations of linoleic acid for 48 h are shown in . Effect of linoleic acid on the fast-phase fluorescence induction curve (O-J-I-P) was found to be concentration-dependent in C. raciborskii. Similar chlorophyll a fluorescence transient curves were found at treatments of 0, 0.1 and 0.5 mg L−1 of linoleic acid; however, phase I and phase P disappeared from the curves when C. raciborskii was exposed to 1, 2 and 4 mg L−1 of linoleic acid. Additionally, a K phase (an imbalance between the electron flow leaving the RC to the acceptor side and the electron flow coming to the RC from the donor side) was found at 2 and 4 mg L−1 concentrations of linoleic acid.
Figure 3. Relative variable fluorescence (OJIP transient curve) of Cylindrospermopsis raciborskii after 48 h of incubation with 0, 0.1, 0.5, 1, 2 and 4 mg L−1 of linoleic acid.
JIP test
Six parameters, including the density of the RCs (RC/CS0), absorption flux per RC (ABS/RC), dissipated energy flux per RC (DI0/RC), maximum quantum yield of primary photochemistry (ϕP0) and the probability that an absorbed photon will move an electron into the electron transport chain further than QA− (ϕE0), as well as the performance index on absorption basis (PIABS, which deviated from the JIP test) are shown in . ϕE0 and RC/CS0 showed a significant decrease with increasing concentrations of linoleic acid (P < 0.05, ANOVA). When exposed to 4 mg L−1 of linoleic acid, ϕE0 and RC/CS0 decreased by 81.1% and 87.3%, respectively (A). ϕP0 and PIABS showed the same trends under linoleic acid stress: ϕP0 and PIABS were 6.4 and 42.6 times lower than those of the control at 2 mg L−1 (P < 0.05, ANOVA). Interestingly, ϕP0, ϕE0, PIABS and RC/CS0 showed a slight increase at 0.5 mg L−1 when compared with those at 0.1 mg L−1.
Figure 4. Changes in the JIP test parameters expressed as a percentage of the control when Cylindrospermopsis raciborskii was exposed to various concentrations of linoleic acid for 48 h. A, Absorption flux per RC (ABS/RC) and dissipated energy flux per RC (DI0/RC); B, RC parameters (RC/CS0), parameters related to QA reduction (φP0 and φE0) and performance index based on absorption (PIABS). For more information, see .
ABS/RC and DI0/RC showed a significant increase with increasing concentrations of linoleic acid (P < 0.05, ANOVA; B). At 2 mg L−1 of linoleic acid, ABS/RC and DI0/RC were 7.81 and 8.69 times higher than that of the control, respectively. However, ABS/RC and DI0/RC decreased slightly at 4 mg L−1, in contrast to the values at 2 mg L−1.
Lipid peroxidation and antioxidant enzyme activities
After 48 h of exposure to various concentration of linoleic acid, antioxidant enzyme (SOD and CAT) activities showed a similar trend (A–B). Compared with the control, there were no significant differences in SOD and CAT activities when the specimens were incubated with 0.1, 0.5 and 1 mg L−1 of linoleic acid. A remarkable increment in SOD activity was found at 2 and 4 mg L−1 (P < 0.05, ANOVA; A). However, CAT activity significantly increased at 1, 2 and 4 mg L−1 (P < 0.05, ANOVA; B). CAT activity was 1.91, 2.01 and 3.08 times higher at 1, 2 and 4 mg L−1, respectively, when compared with the controls. Lipid peroxidation, expressed as MDA concentration, showed that MDA levels generally increased with increasing concentrations of linoleic acid (C). Compared with the control, MDA concentration was significantly higher when the concentration of linoleic acid was greater than 0.5 mg L−1 (P < 0.05, ANOVA). MDA concentrations were 2.63, 2.95, 2.84 and 2.52 times higher than the control when exposed to 0.5, 1, 2 and 4 mg L−1 of linoleic acid.
Figure 5. Parameters for Cylindrospermopsis raciborskii incubated with 0, 0.1, 0.5, 1, 2 and 4 mg L−1 of linoleic acid for 48 h. A, Superoxide dismutase (SOD) activity; B, catalase (CAT) activity; C, malondialdehyde (MDA) concentration. Error bars represent ± SD for triplicate treatments.
Discussion
Allelopathic compounds identified from many aquatic macrophytes have been proposed as a method for controlling the growth of undesired phytoplankton that is a threat to aquatic ecosystems (Huang et al. Citation2004). In the present study, after inoculation with treatments of 1, 2 and 4 mg L−1 linoleic acid, chlorophyll a and growth rate (μ) significantly declined in C. raciborskii in contrast to the control (). Similar results have also been reported by Zhang et al. (Citation2009), who showed that the chlorophyll a content of M. aeruginosa decreased with increasing concentrations of linoleic acid. These results suggest that the ability of C. raciborskii cells to synthesise chlorophyll was reduced in the presence of linoleic acid. Chlorophyll content is closely associated with the photosynthetic characteristics of plants (Niu et al. Citation2012). Lower chlorophyll content reflects a decrease in the antenna size of the photosynthetic RC complexes (Björkman Citation1981), suggesting that damage to the photosynthetic system may have occurred when C. raciborskii was exposed to linoleic acid.
The photosynthetic electron transport chain in photosynthetic system II (PSII) is an important target site for allelopathic inhibition in cyanobacteria (Liu et al. Citation2015). In this study, we investigated the RLCs of C. raciborskii in response to different concentrations of linoleic acid (). The initial slope of the RLC (α), Fv/Fm and ETRmax of C. raciborskii were dramatically reduced at concentrations of 1, 2 and 4 mg L−1 (, ), indicating that the ability of C. raciborskii to use light dramatically decreased at these concentrations of linoleic acid, while the extent of photoinhibition markedly increased at 1, 2 and 4 mg L−1. NPQ is a major photoprotective mechanism in which the excess light energy absorbed by the light-harvesting chlorophyll–protein complexes (LHCs) of PSII is dissipated as heat (Demmig-Adams & Adams Citation1996, Citation2000; Horton et al. Citation1996). In this study, we found that NPQ increased upon exposure to high concentrations of 0.5, 1, 2 and 4 mg L−1 (), suggesting that excess energy trapped by the RCs is dissipated as heat to avoid the damaging effects of high concentrations of linoleic acid.
To obtain further insight into the mechanisms involved in the influence of linoleic acid on the photosynthetic system, a fast chlorophyll a fluorescence transient curve was used to detect and estimate the status of PSII (). Phase I and phase P disappeared from the chlorophyll a fluorescence induction curves when C. raciborskii was exposed to 1, 2 and 4 mg L−1 of linoleic acid. Strasser et al. (Citation1995) proposed that phase O corresponds to a situation where all molecules of the primary electron acceptor of PSII (QA) are in the oxidised state, QA is reduced to QA– in the transition from phase O to J, and the secondary electron acceptor of PSII (QB) is reduced when phase J transforms to phase P in the polyphasic chlorophyll fluorescence transients. This indicated that a high concentration of linoleic acid might inhibit electron transport at the acceptor side of PSII, leading to the accumulation of P680+ (Govindjee Citation1995; Srivastava et al. Citation1997). Furthermore, in this study, a K phase was found at 2 and 4 mg L−1 of linoleic acid. Strasser (Citation1997) suggested that the occurrence of a K step may be attributable to an imbalance between the electron flow leaving the RC to the acceptor side and the electron flow coming to the RC from the donor side. The K step has also been observed to appear when the oxygen-evoling complex (OEC) is damaged (Srivastava et al. Citation1997; Strasser Citation1997). Therefore, the K step in this study suggested that the OEC of C. raciborskii might be damaged or the electron flow might be imbalanced when exposed to 2 and 4 mg L−1 of linoleic acid, supported by a decrease value of ETRmax at high concentration.
The JIP test can provide information on the fluxes of photons, excitons, electrons and further metabolic events, and it has proven to be a sensitive probe for PSII behaviour under environmental stress (Han et al. Citation2008). In this study, ϕE0 represents the efficiency with which a trapped exciton can move an electron into the electron transport chain (Strasser et al. Citation2004). Linoleic acid caused a decrease in ϕE0 (A), suggesting the probability that an electron residing on QA–, which will enter the transport chain, is reduced. This showed that the electron transport of PSII was blocked because of QA– accumulation. These findings suggest a less efficient electron transfer after QA– to QB resulting from disassociation of QB from thylakoids and reduction of the QB pools (Ran et al. Citation2015). The decline in the density of active photosynthetic RCs (RC/CS0) further demonstrated that inactivation of the RCs was increased at high concentrations of linoleic acid. ϕP0 and PIABS showed the same trends under linoleic acid stress: ϕP0 and PIABS were 6.4 and 42.6 times lower than those of the control at 2 mg L−1 (P < 0.05, ANOVA). Interestingly, ϕP0, ϕE0, PIABS and RC/CS0 showed a slight increase at 0.5 mg L−1 when compared with those at 0.1 mg L−1. Strasser et al. (Citation2004) showed that a decrease in ϕP0 resulted in the block of trapping probability of RC. The decreased ϕP0 implied that the photosynthetic efficiency of C. raciborskii was inhibited. PIABS, one of the most sensitive parameter in the JIP test, represents the overall expression of three functional steps: energy absorption; energy trapping; and energy conversion into electron transport (Srivastava et al. Citation1999). A significant decrease in PIABS (A) and a marked increase in NPQ at high concentrations of linoleic acid () imply visible vitality losses in PSII (Lange et al. Citation2004).
Increased ABS/RC, especially at the highest concentrations of linoleic acid (1, 2 and 4 mg L−1; B), illustrates that there has been a decrease in the antenna size of PSII RC and thus can result from an increase in the number of LHCs per RC or to a partial inactivation of RCs to form non-QA-reducing or ‘heat sink’ or ‘silent’ RCs (Eullaffroy et al. Citation2009). This possible inactivation of PSII RCs was confirmed by the increase of total dissipation through active RCs (DI0/RC), which indicates that extra energy received has to be dissipated to avoid possible photodamage to remaining active RCs (B). Since no decrease in the light reactions leading to the energy flux as trapping per active RC was observed, we concluded that energy dissipation was increasing via a relative increase in LHCs per RC which favour the dissipation of excess energy through non-photochemical pathways (thermal dissipation processes).
Oxidative damage caused by allelochemicals might be a lethal mechanism for algae (Hong et al. Citation2009). In this study, MDA content in C. raciborskii significantly increased at high concentrations of linoleic acid (C), reflecting that oxidative damage occurred in C. raciborskii. To reduce oxidative damage, cellular responses of antioxidant enzymes need to be induced after stress caused by allelochemicals (Gniazdowska & Bogatek Citation2005; Singh et al. Citation2006; Hong et al. Citation2008). In this study, SOD and CAT activities showed a significant increase at 2 and 4 mg L−1 of linoleic acid, indicating that C. raciborskii cells encountered oxidative stress and that they have to remove reactive oxygen species (ROS) when exposed to linoleic acid (A and B). Similar results were also obtained by Wu et al. (Citation2013), who observed that SOD and CAT activities were enhanced by pyrogallic acid stress. However, it was apparent that enhanced SOD and CAT activities were not enough to prevent the sudden increase in H2O2 content and consequent formation of ROS, leading to extensive lipid peroxidation, as indicated by enhanced MDA values at high concentrations of linoleic acid (Yu et al. Citation2003; Li & Hu Citation2005; Hong et al. Citation2008).
Conclusion
In summary, the results of this study suggest that high concentrations (2 and 4 mg L−1) of linoleic acid significantly inhibited growth and changed the oxidative system and PSII activity of C. raciborskii, indicating that damage to the oxidative and photosynthetic systems could be two important mechanisms underlying the allelopathic effect of linoleic acid on C. raciborskii. In addition, QA– accumulation that resulted in the blockage of electron transport in PSII was the mechanism responsible for the toxicity of linoleic acid in the PSII of C. raciborskii.
Acknowledgement
Associate Editor: Dr Joanne Clapcott.
Disclosure statement
No potential conflict of interest was reported by the authors.
Additional information
Funding
References
- Alamsjah MA, Hirao S, Ishibashi F, Oda T, Fujita Y. 2008. Algicidal activity of polyunsaturated fatty acids derived from Ulva fasciata and U. pertusa (Ulvaceae, Chlorophyta) on phytoplankton. J Appl Phycol. 20:713–720. doi: 10.1007/s10811-007-9257-5
- Alamsjah MA, Ishibe K, Kim DK, Yamaguchi K, Ishibashi F, Fujity Y, Oda T. 2005. Isolation and structure determination of algicidal compounds from Ulva fasciata. Biosci Biotech Bioch. 69:2186–2192. doi: 10.1271/bbb.69.2186
- Aliotta G, Greca MD, Monaco P, Pinto G, Pollio A, Previtera L. 1990. In vitro algal growth inhibition by phytotoxins of Typha latifolia. L. Chem Ecol. 16:2637–2646.
- Anderson DM. 1997. Turning back the harmful red tides. Nature. 388:513–514. doi: 10.1038/41415
- Björkman O. 1981. Responses to different quantum flux densities. In: Lange OL, Nobel PS, Osmond CB, Ziegler H editors. Physiological plant ecology ( Encyclopedia Plant Physiology, NS, vol 12A). Berlin Heidelberg New York: Springer; p. 57–107.
- Bradford MM. 1976. A rapid and sensitive method for the quantitation of microgram quantities of protein utilizing the principle of protein-dye binding. Anal Biochem. 72:248–54. doi: 10.1016/0003-2697(76)90527-3
- Choi HJ, Kim BH, Kim JD, Han MS. 2005. Streptomyces neyagawaensis as a control for the hazardous biomass of Microcysits aeruginosa (Cyanobacteria) in eutrophic freshwaters. Biol Control. 33:335–343. doi: 10.1016/j.biocontrol.2005.03.007
- Choo K, Snoeijs P, Pedersén M. 2004. Oxidative stress tolerance in the filamentous green algae Cladophora glomerata and Enteromorpha ahlneriana. J Exp Mar Biol Ecol. 298:111–123. doi: 10.1016/j.jembe.2003.08.007
- Demmig-Adams B, Adams WWIII. 1996. Xanthophyll cycle and light stress in nature: uniform response to excess direct sunlight among higher plant species. Planta. 198:460–470. doi: 10.1007/BF00620064
- Demmig-Adams B, Adams WWIII. 2000. Harvesting sunlight safely. Nature. 403:371–374. doi: 10.1038/35000315
- Dziga D, Suda M, Bialczyk J, Urszula CP, Lechowski Z. 2007. The alteration of Microcystis aeruginosa biomass and dissolved microcystin-LR concentration following exposure to plantproducing phenols. Environ Toxicol. 22:341–346. doi: 10.1002/tox.20276
- Eullaffroy P, Frankart C, Aziz A, Couderchet M, Blaise C. 2009. Energy fluxes and driving forces for photosynthesis in Lemna minor exposed to herbicides. Aquat Bot. 90:172–178. doi: 10.1016/j.aquabot.2008.09.002
- Fastner J, Wiedner C, Visser PM, Metcalf JS, Codd GA, Mur LR. 2003. Effects of light on the microcystin content of Microcystis strain PCC 7806. Appl Environ Microb. 69:1475–1481. doi: 10.1128/AEM.69.3.1475-1481.2003
- Gniazdowska A, Bogatek R. 2005. Allelopathic interactions between plants: multisite action of allelochemicals. Acta Physiol Plant. 27:395–407. doi: 10.1007/s11738-005-0017-3
- Govindjee E. 1995. Sixty-three years since Kautsky: chlorophyll a fluorescence. Australian Journal of Plant Physiology. 22:131–160. doi: 10.1071/PP9950131
- Han T, Kang SH, Park JS, Lee HK, Brown MT. 2008. Physiological responses of Ulva pertusa and U. armoricana to copper exposure. Aquat Toxicol. 86:176–184. doi: 10.1016/j.aquatox.2007.10.016
- Hong Y, Hu HY, Xie X, Li FM. 2008. The responses of enzymatic antioxidants and non-enzymatic antioxidants in cyanobacterium Microcystis aeruginosa to allelochemical ethyl2-methyl acetoacetate (EMA) isolated from reed (Phragmites communis). Plant physiol. 165:1264–1273. doi: 10.1016/j.jplph.2007.10.007
- Hong Y, Hua HY, Xie X, Sakoda A, Sagehashi M, Li FM. 2009. Gramine-induced growth inhibition, oxidative damage and antioxidant responses in freshwater cyanobacterium Microcystis aeruginosa. Aquat Toxicol. 91:262–269. doi: 10.1016/j.aquatox.2008.11.014
- Horton P, Ruban AV, Walters RG. 1996. Regulation of light harvesting in green plants. Annual Review of Plant Physiology and Plant Molecular Biology. 47:655–684. doi: 10.1146/annurev.arplant.47.1.655
- Hrudey S, Burch S, Burch M, Drikas M, Greorgy R. 1999. Remedial measures. In: Chorus I and Bartram J, editors. Toxic cyanobacteria in water: a guide to their public health consequences, monitoring and management. London: Routledge; p. 275–312.
- Huang WY, Chiang IZ, Wu JT. 2004. Allelochemicals of Botryococcus braunii (Chlorophyceae). J Phycol. 40:474–480. doi: 10.1111/j.1529-8817.2004.03096.x
- Humpage AR, Fenech M, Thomas P, Falconer IR. 2000. Micronucleus induction and chromosome loss in transformed human white cells indicate clastogenic and aneugenic action of the cyanobacterial toxin, cylindrospermopsin Mutat. DNA Repair. 72:155–161.
- Ichimura T. 1979. Isolation and culture methods of algae (Sôrui no bunri to baiyôhô. 2.5.B. Tansui sôrui). In: Nishizawa K and Chihara M, editors. Methods in phycological studies. Tokyo: Kyoritu Shuppan; p. 294–305. ( in Japanese without English title)
- Kromkamp JC, Forster RM. 2003. The use of variable fluorescence measurements in aquatic ecosystems: differences between multiple and single turnover measuring protocols and suggested terminology. Eur J Phycol. 38:103–112. doi: 10.1080/0967026031000094094
- Lagos N, Onodera H, Zagatto PA, Andrinolo D, Azevedo SMFQ, Oshima Y. 1999. The first evidence of paralytic shellfish toxin in the freshwater cyanobacterium Cylindrospermopsis raciborskii, isolated from Brazil. Toxicon. 37:1359–1373. doi: 10.1016/S0041-0101(99)00080-X
- Lange1 CA, Weissflog L, Strasser RJ, Krueger GHJ, Pfennigsdorff A. 2004. Phytotoxic effects of trichloroacetic acid on Scots pine and birch determined by Chl a fluorescence and the JIP-Test. S Afr J Bot. 70:683–694. doi: 10.1016/S0254-6299(15)30167-8
- Li FM, Hu HY. 2005. Isolation and characterization of a novel antialgal allelochemical from Phragmites communis. Appl Environ Microb. 71:6545–6553. doi: 10.1128/AEM.71.11.6545-6553.2005
- Liu R, Ran XF, Bai F, Xu JZ, Yang SQ, Shi JQ, Wu ZX. 2015. Use of chlorophyll a fluorescence to elucidate the toxicity target of N-phenyl-2-naphthylamine on photosynthetic system of Cylindrospermopsis raciborskii (Cyanobacteria). Phycologia. 54:12–19. doi: 10.2216/14-050.1
- Nakai S, Inoue Y, Hosomi M, Murakami A. 2000. Myriophyllum spicatum-released allelopathic polyphenols inhibiting growth of blue-green algae Microcystis aeruginosa. Water Res. 34:3026–3032. doi: 10.1016/S0043-1354(00)00039-7
- Nakai S, Yamada S, Hosomi M. 2005. Anti-cyanobacterial fatty acids released from Myriophyllum spicatum. Hydrobiologia. 543:71–78. doi: 10.1007/s10750-004-6822-7
- Niu XD, Lia GR, Kang ZH, Huang JL, Wang GX. 2012. Photosynthetic characteristics and antioxidant enzyme system in high chlorophyll rice Gc mutant. Russ J Plant Physl. 59:691–695. doi: 10.1134/S1021443712050123
- Nusch EA. 1980. Comparison of different methods for chlorophyll and phaeopigment determination. Archiv für Hydrobiologie – Beiheft Ergebnisse der Limnologie. 14:14–36.
- Ohtani I, Moore RE, Runnegar MTC. 1992. Cylindrospermopsin: a potent hepatotoxin from the blue-green alga Cylindrospermopsis raciborskii. American Chemical Society. 114:7941–7942. doi: 10.1021/ja00046a067
- Padisák J. 1997. Cylindrospermopsis raciborskii (Woloszynska) Seenayya et Subba Raju, an expanding, highly adaptive cyanobacterium: worldwide distribution and review of its ecology. Arch Hydrobiol Suppl. 107:563–593.
- Paerl HW, Fulton RS, Moisander PH, Dyble J. 2001. Harmful freshwater algal blooms, with an emphasis on Cyanobacteria. Scientific World Journal. 1:76–113. doi: 10.1100/tsw.2001.16
- Platt T, Gallegos CL, Harrison WG. 1980. Photo inhibition and photosynthesis in natural assemblages of marine phytoplankton. J Mar Res. 38:687–701.
- Qian H, Xu X, Chen W, Jiang H, Jin Y, Liu W, Fu Z. 2009. Allelochemical stress causes oxidative damage and inhibition of photosynthesis in Chlorella vulgaris. Chemosphere. 75:368–375. doi: 10.1016/j.chemosphere.2008.12.040
- Ran XF, Liu R, Xu S, Bai F, Xu JZ, Yang YJ, Shi JQ, Wu ZX. 2015. Assessment of growth rate, chlorophyll a fluorescence, lipid peroxidation and antioxidant enzyme activity in Aphanizomenon flos-aquae, Pediastrum simplex and Synedra acus exposed to cadmium. Ecotoxicology. 24:468–477. doi: 10.1007/s10646-014-1395-3
- Saito KM, Matsumoto TS, Murakoshi I. 1989. Inhibitory substances from Myriophyllum brasiliense on growth of blue-green algae. J Nat Prod. 52:1221–1226. doi: 10.1021/np50066a004
- Schreiber U, Bilger W, Hormann H, Neubauer C. 1998. Photosynthesis. In: Raghavendia AS, editor. Chlorophyll fluorescence as a diagnostic tool: the basics and some aspects of practical relevance. Cambridge: University of Cambridge; p. 320–326.
- Singh HP, Batish DR, Kaur S, Arora K, Kohli RK. 2006. Alpha-Pinene inhibits growth and induces oxidative stress in roots. Ann Bot. 98:1261–1269. doi: 10.1093/aob/mcl213
- Sinha R, Pearson LA, Davis TW, Burford MA, Orr PT, Neilan BA. 2012. Increased incidence of Cylindrospermopsis raciborskii in temperate zones—is climate change responsible? Water Res. 46:1408–1419. doi: 10.1016/j.watres.2011.12.019
- Srivastava A, Guisse B, Greppin H, Strasser RJ. 1997. Regulation of antenna structure and electron transport in PS II of Pisum sativum under elevated temperature probed by the fast polyphasic chlorophyll a fluorescence transient: OKJIP. Biochimica et Biophysica Acta. 1320:95–106. doi: 10.1016/S0005-2728(97)00017-0
- Srivastava A, Strasser RJ, Govindjee E. 1999. Greening of peas: parallel measurements of 77K emission spectra, OJIP chlorophyll a fluorescence transients, period four oscillation of the initial fluorescence level, delayed light emission and P700. Photosynthetica. 37:365–392. doi: 10.1023/A:1007199408689
- Strasser BJ. 1997. Donor side capacity of photosystem II probed by chlorophyll a fluorescence transients. Photosynth Res. 52:147–155. doi: 10.1023/A:1005896029778
- Strasser RJ, Srivastava A, Govindjee E. 1995. Polyphasic chlorophyll a fluorescence transients in plants and cyanobacteria. J Photoch Photobio B. 61:32–42. doi: 10.1111/j.1751-1097.1995.tb09240.x
- Strasser RJ, Srivastava A, Tsimilli-Michael M. 2004. Analysis of the chlorophyll a fluorescence transient. In: Papageorgiou GC, Govindjee editors. Chlorophyll a fluorescence: a signature of photosynthesis. Series of Advances in Photosynthesis and Respiration, vol 19. Netherlands: KAP Press; p. 321–362.
- Strasser RJ, Strasser BJ. 1995. Measuring fast fluorescence transients to address environmental questions: the JIP test. Photosynthesis: from Light to Biosphere. 5:977–980.
- Ting CS, Owens TG. 1992. Limitations of the pulse-modulated technique for measuring the fluorescence characteristics of algae. Plant Physiol. 100:367–373. doi: 10.1104/pp.100.1.367
- Uchimaya M, Mihara M. 1978. Determination of malonadehyde precursor in tissues by thiobarbituric acid test. Anal Biochem. 86:271–278. doi: 10.1016/0003-2697(78)90342-1
- Wu Z, Gan N, Huang Q, Song L. 2007. Response of Microcystis to copper stress—do phenotypes ofMicrocystis make a difference in stress tolerance? Environ Pollut. 147:324–330. doi: 10.1016/j.envpol.2006.05.022
- Wu Z, Shi JQ, Yang SQ. 2013. The effect of pyrogallic acid on growth, oxidative stress, and gene expression in Cylindrospermopsis raciborskii (Cyanobacteria). Ecotoxicology. 22:271–278. doi: 10.1007/s10646-012-1023-z
- Yu JQ, Ye SF, Zhang MF, Hu WH. 2003. Effects of root exudates and aqueous root extracts of cucumber (Cucumis sativus) and allelochemicals, on photosynthesis and antioxidant enzymes in cucumber. Biochem Syst Ecol. 31:129–139. doi: 10.1016/S0305-1978(02)00150-3
- Zhang TT, Zhang CY, He M, Wu AP, Nie LW. 2009. The inhibitory mechanism of linoleic acid on Microcystis aeruginosa. China Environmental Science 29:419–424 ( in Chinese).