
ABSTRACT
Declines in bivalve populations have been quite common worldwide, often associated with coastal development, pollution and climate change. In addition to the impacts of these chronic stressors, occasional mass mortality events may have severe consequences on ecosystem services and biodiversity. In this study, we examined the impact of a mass mortality event of the clam (Austrovenus stutchburyi) on an estuarine food web and the grazing pressure exerted by the bivalve population. In February 2009, c. 60% of the clam population died in Whangateau Harbour, New Zealand. Population clearance rate calculations suggest that the clam population do not exert significant top-down control on phytoplankton biomass in the estuary, and thus the impact of the mortality event on bivalve grazing pressure was less severe than the reduction in abundance would suggest. A trophic model shows that phytoplankton play a limited role in the estuary food web, which is instead dominated by microphytobenthos and clams. This study highlights the importance of microphytobenthos in shallow estuaries, and the application of the trophic model is a useful tool that can identify key components of the ecosystem and could help inform monitoring programmes.
Introduction
Suspension feeding bivalves act as key species in estuarine ecosystems, being integral to benthic–pelagic coupling and altering rates of nutrient regeneration (e.g. Smaal & Prins Citation1993; Thrush et al. Citation2006). Due to their position in the food web, they can exert considerable top-down control on phytoplankton populations and provide a substantial food source for higher trophic levels (see review by Newell Citation2004). Previous research has often focussed on the pelagic grazing pressure exerted by suspension feeding bivalves (e.g. Hily Citation1991; Dame & Prins Citation1998; Lonsdale et al. Citation2007; Klimmerer & Thompson Citation2014) or their influence on nutrient cycling and primary productivity (e.g. Thrush et al. Citation2006; Jones et al. Citation2011a). Indeed, in some systems, the loss of suspension feeders has resulted in an increased incidence of phytoplankton blooms, for example, following reductions in eastern oyster (Crassostrea virginica) beds in Chesapeake Bay, USA (Jackson et al. Citation2001; Kemp et al. Citation2005) or clams (Mercenaria mercenaria) in Great South Bay, NY, USA (Lonsdale et al. Citation2007). However, the focus on control of phytoplankton populations by suspension feeding bivalves overlooks the importance of other food sources, such as microphytobenthos that may dominate production in shallow estuaries with high water clarity and extensive intertidal flats (e.g. MacIntyre et al. Citation1996). In these systems, infaunal suspension feeding bivalves often dominate macrofauna communities (Thrush et al. Citation2003; Newell Citation2004; Alfaro Citation2006), and resuspended microphytobenthos may provide an important food source for these bivalves (e.g. Kang et al. Citation2003; Safi Citation2003).
Populations of infaunal suspension feeding bivalves have declined globally in many estuaries, likely associated with increasing pressure from expanding coastal human populations (Piersma et al. Citation2001; Peterson Citation2002; Kraeuter et al. Citation2008). The infaunal suspension feeding bivalve, Austrovenus stutchburyi, is a dominant species on intertidal flats in New Zealand estuaries, often present in large, high-density (c. 1000 ind. m−2) beds (Dobbinson et al. Citation1989; Whitlatch et al. Citation1997). A. stutchburyi is a key species in these systems, capable of influencing microphytobenthos productivity and nutrient cycling, as well as providing a food source for shorebird and ray species (Thrush et al. Citation1991, Citation2006; Sandwell et al. Citation2009; Jones et al. Citation2011a; Pratt et al. Citation2014). A. stutchburyi populations are declining in some areas, however, likely due to adverse effects associated with sedimentation, pollution and over-harvesting (De Luca-Abbott Citation2001; Norkko et al. Citation2006; Cummings et al. Citation2007).
In addition to chronic stressors adversely affecting bivalve populations, mass mortality events may have severe consequences on ecosystem services or biodiversity (e.g. Jonsson & Andé Citation1992; Horiguchi Citation1995). In New Zealand, a mass mortality event significantly impacted bivalve beds in Whangateau Harbour (North Island) in February 2009, an estuary with an abundant A. stutchburyi population. It was estimated that c. 60% of the A. stutchburyi population was affected by the die-off, amounting to a loss of c. 250 million clams in an estuary 7.5 km2 in area (Ministry of Fisheries Citation2009). This event was attributed to a combination of infection by a coccidian parasite and a mycobacterium, and high temperatures coinciding with mid-afternoon low tides (Ministry of Fisheries Citation2009). Similar mass mortality events have also been observed elsewhere, for example, in Germany, where the bivalve was Cerastroderma edule (Thieltges Citation2006), but the effects of these events on the wider food web are largely unknown, despite the fact that bivalve populations may provide an important food source for higher trophic levels, such as shorebirds, rays and other fish (e.g. Thrush et al. Citation1991; Le Port Citation2003). For example, a reduction in both the abundance and condition of cockles (C. edule) in the Dutch Wadden Sea due to shellfish dredging has been linked to the loss of red knots (Calidris canutus islandica) from the area (van Gils et al. Citation2006).
Our aim in this study was to evaluate the impact of a mass mortality event on an estuarine ecosystem, focusing on its effects on: (i) the grazing pressure exerted by A. stutchburyi, which is potentially an important ecosystem service regulating pelagic phytoplankton biomass; (ii) the estuarine food web. In order to do so, the population filtration rate was calculated for before and after the mass mortality event and compared to other key ecosystem parameters (water residence time and phytoplankton production time) to assess the effect of the mortality event on filtration rates at the ecosystem scale. Moreover, a mass-balance trophic model (Ecopath) was configured to quantify functional attributes (e.g. biomass, production and consumption) of the entire system prior to the mass mortality event, and also to allow the establishment of a possible A. stutchburyi biomass range to compare with the biomass following the mass mortality event, and to determine the relative importance of phytoplankton, microphytobenthos and detritus in sustaining estuarine consumers. A mass-balance trophic model for a New Zealand estuary has not previously been published, making this a key case study on the evaluation of estuarine food webs.
Methods
Study area
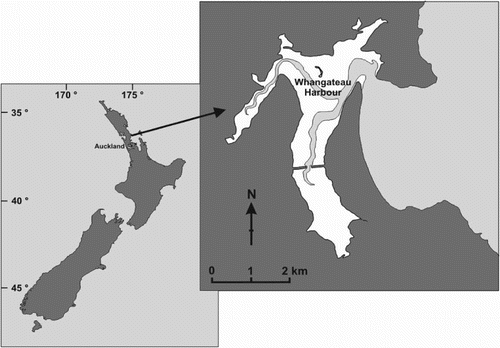
Whangateau Harbour is located on the north-east coast of New Zealand (36°19′S, 174°46′E), 60 km north of the city of Auckland (). It is representative of a common estuary type in New Zealand (Hume et al. Citation2007), and has been the focus of a number of studies, which provide a substantial database (reviewed by Kelly Citation2009; Townsend et al. Citation2010) suitable for parameterisation of a trophic model and for ecosystem scale calculations. Whangateau is a small barrier-enclosed lagoon (area 7.5 km2, mean depth 1.6 m), which has extensive intertidal sandflats (85% of total estuary area), is well-flushed (the tidal prism is 81% of total estuary spring-tide volume) and receives little freshwater input (Hume et al. Citation2007). Tides are semi-diurnal, with a range of c. 2 m. Substrate transitions from sand in the main estuary body to mud in the sheltered parts of the arms, and the resulting complex and varied habitat supports diverse benthic macrofauna and fish communities (e.g. Francis et al. Citation2005; Alfaro Citation2006).
Figure 1. Whangateau Harbour, New Zealand. Land is shaded dark grey, intertidal flats are white and subtidal areas are light grey.
Austrovenus stutchburyi grazing pressure in Whangateau Harbour
Estuary-wide A. stutchburyi bed clearance rates were estimated from the density-dependent empirically derived equations given in Jones et al. (Citation2011b) and surveyed densities before and after the mortality event (Walshe et al. Citation2006; Pawley & Ford Citation2007; Pawley Citation2011). These surveys focused on the high-density beds; for the rest of the intertidal area, A. stutchburyi density was assumed to be 50 ind. m−2 (Townsend et al. Citation2010). The bed clearance rates measured by Jones et al. (Citation2011b) used clams of a size (20–25 mm shell height) similar to those in Whangateau prior to the mass mortality event, and so the equations are likely to be appropriate for this period. Following the mass mortality event, however, mean clam size was reduced in high-density beds from 23.4 to 20.5 mm (Pawley Citation2011). To account for the reduction in size on bed clearance rates, we used a previously determined allometric relationship between biomass and shell length for A. stutchburyi (R2 = 0.93, n = 140; C. Pilditch unpub. data), and the relationship between clearance rate and biomass for the European cockle (C. edule) derived by Smaal et al. (Citation1997):where M = ash-free dry weight (g) and L = shell length (cm), and
where CR = clearance rate (m3 d−1 ind−1).
To calculate A. stutchburyi population clearance rate, the bed clearance rates were scaled by the estuary intertidal area and converted to the volume of water cleared per day. We assumed that A. stutchburyi feed for 8 h d−1 because tides are semi-diurnal and beds are located in the mid-tide zone. This feeding period is consistent with previous research that established that A. stutchburyi feed for 4 h per tide (Beentjes and Williams Citation1986).
We scaled the A. stutchburyi population clearance rates pre- and post-mortality event to the estuary volume to calculate bivalve clearance time, and compared these to the residence time and rate of phytoplankton turnover to quantify the effect of the mortality event on bivalve grazing pressure. Bivalve clearance time was calculated as follows:where BCT = clearance time (d), EV = estuary volume (m3) and QB = volume of water cleared by A. stutchburyi in 1 day (m3 d−1). Water residence time (RT; d) was estimated from Ev and the volume of water exchanged between the estuary and the coast in 1 day (Qp; m3 d−1). Estuary volume and the tidal prism were derived from NIWA’s Coastal Explorer (retrieved from http://wrenz.niwa.co.nz/webmodel/coastal on 15 August 2011). Phytoplankton production time (PPt; d) was estimated from areal phytoplankton biomass (g C m−2) and production (g C m−2 d−1) values for other North Island New Zealand estuaries (Vant & Budd Citation1993; Gallegos & Vant Citation1996; Wilcock & Kemp Citation2003).
Trophic model of Whangateau Harbour
Model description
Food web models are used to explore the energy flow and interactions between multiple trophic levels (Gaedke Citation1995; Fulton et al. Citation2003; Christensen et al. Citation2008). Ecopath is a well-established mass-balance (i.e. steady state) food web model, which has previously been applied to a wide range of coastal systems (Christensen & Pauly Citation1992), including estuaries (Milessi et al. Citation2010; Byron et al. Citation2011a). The model estimates the biomass and food consumption of species (or groups of species) in an ecosystem using a parameterisation based on an assumption that a mass-balance is achieved over an arbitrary period, typically 1 year (Christensen et al. Citation2008).
Parameterisation is based on two governing equations; the first equation describes production for each group i (which may be a single species or a group of species that share a common functional role), whereby mortality of a prey group (a reduction in that state variable) equates to consumption for a predator group (increase in the state variable), so that:where Pi is production for a group i, Yi is total fishery catch, Bi is biomass, M2i is the total predation rate, Ei is net migration (emigration–immigration), BAi is biomass accumulation, and EEi is ‘ecotrophic efficiency’, which is the proportion of production that is used within the system. The term given by Pi (1 – EEi) is also sometimes described as ‘other mortality’.
Ecopath consists of a series of linear equations (of the form of the equation above) for each group in the system, which are then solved for one of the following four parameters: biomass (Bi), production/biomass ratio (Pi/Bi), consumption/biomass ratio (Ci/Bi) or ecotrophic efficiency (EEi). The other three parameters, along with catch, net migration, biomass accumulation, assimilation and diet composition, must be assigned for each group. After ensuring mass-balance between groups, the energy balance within a group is obtained using the second governing equation:where Ci is consumption, Pi is production, Ri is respiration and UAi is unassimilated consumption. A balanced model is defined as one in which EE < 1 for all model groups. If EE ≥ 1 for one or more groups, the model is deemed unbalanced (because consumption of a group cannot be greater than its production), and the input parameters must be adjusted to obtain a balanced solution (Christensen and Walters Citation2004).
Model input, balancing and outputs
The food web of Whangateau Harbour was defined with 16 groups, where species that shared similar functional roles were combined together in a single functional group. A full list of species included in each functional group is given in and the groups are listed in . All available information on biomass, P/B and C/B ratios and diet composition for each of the model groups was assembled from a significant body of literature (including c. 50 scientific articles, c. 15 reports, c. 5 university theses and authors’ unpublished data) and converted into appropriate units for the model, that is, g carbon m−2 for biomass and g carbon m−2 yr−1 for production and consumption. The origin of the input data is given in and described in detail in Jones (Citation2011). Quantitative data on diet composition for each of the species/groups were scarce. Where only qualitative estimates were available, the proportion of prey in the diet of a group was assumed to be proportional to the fraction that its biomass contributed to the total biomass of all the prey items for the group (Pinkerton et al. Citation2008). Unassimilated consumption (i.e. the fraction of food that is egested and directed to detritus) was assumed to be 0.3 for herbivores and 0.2 for carnivores (Christensen et al. Citation2008). Recreational A. stutchburyi harvest was also included as a fishery term in the model based on data in Kearney (Citation1999).
Table 1. Input data sources for groups in Whangateau Harbour trophic model.
Table 2. List of abbreviations for model parameters, model groups and summary statistics.
Input data were examined to ensure values conformed to simple ecological and physiological rules. For example, biomass, and production and consumption ratios should decrease with increasing trophic level (Link Citation2010). The input parameters for biomass, P/B and C/B required only minor adjustments to the initial estimates for C/B for birds and some benthic invertebrate groups to balance the model. Model output was examined to ensure that values for respiration and assimilation were also within realistic ranges. Ratios of respiration to assimilation were <1, and decreased with trophic level. Ratios of respiration to biomass, which are an expression of the activity level of a group, were also within the ranges reported in the literature (Bradford-Grieve et al. Citation2003; Jiang & Gibbs Citation2005; Christensen et al. Citation2008).
Ecopath outputs fractional trophic levels (TLs) for each model group to recognise that predators can consume prey across a range of TLs. Producers and detritus have, by definition, a TL of 1 and TL for consumers is calculated as 1 + the weighted average of the prey TLs (Christensen et al. Citation2008). Summary statistics provide overall measures of total system throughput (i.e. the sum of all flows through each group), consumption, respiration, export and flows to detritus, as well as total and primary production, and gross efficiency of any fisheries (i.e. catch/net primary productivity). The mixed trophic impact (MTI) routine in Ecopath evaluates the impact that a very small increase in biomass of one group will have on other groups in the system.
Post-mortality event bivalve biomass and possible range in A. stutchburyi biomass
We assume that the balanced Ecopath model represents the estuary food web before the mass mortality event. A possible range for A. stutchburyi biomass was established using the model to place the reduction in A. stutchburyi following the mass mortality event (estimated to be 1.58 g C m−2; Jones Citation2011; Pawley Citation2011) in the context of a theoretical minimum biomass. To establish the possible biomass range, we adapted a process that has previously been used to calculate ecological carrying capacity for harvested shellfish in other systems (Jiang & Gibbs Citation2005; Byron et al. Citation2011a). In these instances, shellfish biomass is increased in consecutive model runs until the model is no longer balanced (i.e. Ecotrophic efficiencies [EE] for one or more groups is greater than 1), and the point just prior to this is defined as the ecological carrying capacity. We first decreased A. stutchburyi biomass in consecutive model runs until the model was no longer balanced, to quantify the minimum A. stutchburyi biomass the system might be able to support, and then increased A. stutchburyi biomass in consecutive model runs to quantify the ecological carrying capacity.
Results
Austrovenus stutchburyi grazing pressure in Whangateau Harbour
Bivalve bed clearance rate was calculated to range from 94 to 276 L h−1 m−2 prior to the mass mortality event, but decreased to between 66 and 174 L h−1 m−2 after the mass mortality event (). Before the mass mortality event the total volume of water cleared by A. stutchburyi per tidal cycle (i.e. the population clearance rate) was estimated to be between 565,100 and 1,653,300 m3, which is much less than the tidal prism (9,491,105 m3). After the mass mortality event, the population clearance rate was reduced slightly to between 529,600 and 1,391,500 m3. The water cleared by A. stutchburyi before the mass mortality event was equivalent to c. 9% of total harbour volume, and after the mass mortality event it was reduced slightly to c. 8% of total harbour volume.
Table 3. Whangateau Harbour A. stutchburyi population clearance rates calculated for three flow speeds (2, 5 and 15 cm s−1). Mean A. stutchburyi density and size are as reported in Pawley (Citation2011).
The bivalve clearance time (i.e. the estuary volume divided by the volume of water cleared by A. stutchburyi per day) was 5.5 and 6 days, before and after the mass mortality event, respectively (). This is much greater than both the water residence time for Whangateau Harbour (0.61 days) and typical phytoplankton production time (1.4 days; Vant & Budd Citation1993; Gallegos & Vant Citation1996; Wilcock & Kemp Citation2003).
Table 4. Ecosystem scale parameters for Whangateau Harbour.
Trophic modelling
Pre-mortality event food web
The trophic model of Whangateau Harbour is shown in , and input/output parameters and summary statistics are described in and , respectively. The benthic groups equated to 87% of total living biomass (A. stutchburyi accounted for 30%), and of the primary producers, microphytobenthos were by far the largest group, making up 90% of total primary producer biomass. Consumption by the benthic groups (92 g C m−2 yr−1) far outweighed that of the pelagic groups (4 g C m−2 yr−1) with A. stutchburyi accounting for 43% of total consumption and exceeded only by that of deposit feeding benthic invertebrates (50% of total).
Figure 2. Trophic model for Whangateau Harbour. Circle size is proportional to biomass. See for group name abbreviations.
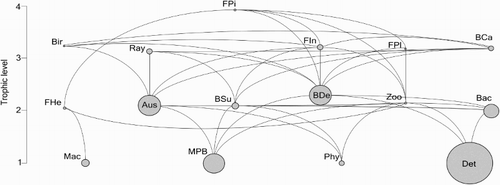
Table 5. (a) Balanced model input and output parameters, and (b) diet matrix, where numbers represent percentage prey (rows) taken by predators (columns).
Table 6. Summary statistics for balanced models representing: original model for Whangateau Harbour (before the A. stutchburyi mass mortality event); the estuary at minimum A. stutchburyi biomass; and the estuary at ecological carrying capacity (i.e. maximum A. stutchburyi biomass).
EE were low for some groups, such as the primary producers and benthic invertebrates (EE < 0.4), but were higher (>0.6) for other groups, such as invertebrate-feeding fish. Of the total flow into detritus, c. 60% was consumed by, and c. 40% exported from, the system (). Of the total system throughput (659 g C m−2 yr−1), 34% was consumed, 15% respired, 37% flowed to detritus and 15% was exported from the system (). Fractional TLs ranged from 1 for primary producers to 3.9 for piscivorous fish (). The greatest proportion (58%) of living biomass was in herbivores, whilst primary producers accounted for 29% of biomass, and only 3% of living biomass was at a trophic level of 3 or above.
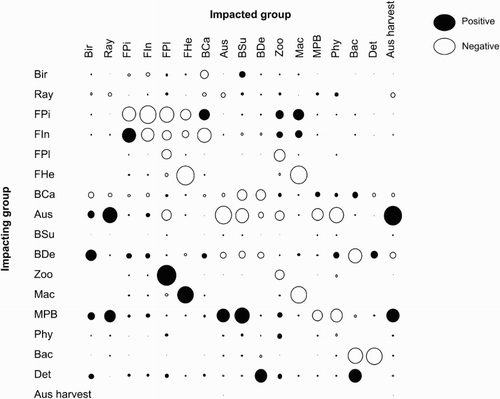
The MTI analysis indicated that, of the top predators, birds and rays had little impact on any other group; piscivorous fish, however, had a large negative impact on their prey, and a positive impact on carnivorous benthic invertebrates, zooplankton and macroalgae (). Negative impacts on prey species were obvious, for example, on zooplankton by planktivorous fish, and on phytoplankton and microphytobenthos by A. stutchburyi. Microphytobenthos had a positive impact on most groups, especially A. stutchburyi and other benthic suspension feeders. A. stutchburyi had relatively large impacts (either negative or positive) on most other groups, and the harvest of A. stutchburyi (i.e. recreational fishery) had little impact on A. stutchburyi or any other groups.
Figure 3. MTI analysis of Whangateau Harbour model. Direct and indirect impacts of a small increase in the biomass of one group (vertical axis) on all other groups (horizontal axis) are shown. Positive impacts are shown in black and negative in white. Impacts are relative and circle size is proportional to the size of the impact. See for group name abbreviations.
Austrovenus stutchburyi biomass range and post-mortality event biomass
A. stutchburyi biomass was decreased in small increments from the original model value of 3.38 to 0.72 g C m−2, at which point the model became unbalanced (i.e. EE > 1) (). A. stutchburyi biomass following the 2009 mass mortality event (1.58 g C m−2) was nearly three times greater than the minimum possible biomass as determined in this study (i.e. 0.73 g C m−2).
Table 7. Effect of changes in A. stutchburyi biomass on Whangateau Harbour trophic model under two scenarios: (1) decreasing biomass whilst maintaining a constant harvest at 0.022 g C m−2 yr−1, (2) increasing biomass (and harvest proportional to biomass) to calculate ecological carrying capacity.
Increasing A. stutchburyi biomass in small increments suggests that the biomass could increase by 4.5 times without exceeding the ecological carrying capacity of Whangateau Harbour (). When biomass was increased further than this the grazing pressure on microphytobenthos was too great (i.e. the model became unbalanced).
Total system throughput (i.e. the sum of all flows through each group) decreased slightly (by c. 2%) when A. stutchburyi biomass was reduced to the minimum possible, but increased by 10% when A. stutchburyi biomass was increased to ecological carrying capacity (). The sum of all exports increased by c. 15% at the minimum A. stutchburyi biomass, but decreased by c. 75% at ecological carrying capacity.
Discussion
Bivalve grazing pressure pre- and post-mortality event
Our calculations of A. stutchburyi population clearance rate in Whangateau Harbour reveal that the volume of water cleared by the bivalve population in each tidal cycle is much less than the tidal prism, and the ecosystem scale parameters reveal that the bivalve clearance time (c. 6 days) is much greater than both the water residence and phytoplankton production times (0.61 and 1.4 days, respectively). The impact of the 2009 mass mortality event on the grazing pressure exerted by the A. stutchburyi population was therefore probably less severe than the reduction in mean size and density of the population would suggest. Jones et al. (Citation2011b) found that A. stutchburyi bed clearance rates do not scale proportionally with A. stutchburyi density, as individual clearance rates are suppressed at high bed densities. Thus the reduced clam density following the mass mortality event is partially offset by higher individual clearance rates. Regardless, the population clearance rate calculations for both before and after the mass mortality event suggest that A. stutchburyi do not exert a significant top-down control on phytoplankton in the harbour. In fact, the trophic model indicates that pelagic phytoplankton play a limited role in the estuary food web.
Pre-mortality event food web
The trophic model shows a system dominated by the benthic groups, particularly A. stutchburyi, deposit feeding benthic invertebrates and microphytobenthos. The latter group was the most important primary producer in terms of biomass and productivity, and A. stutchburyi and deposit feeding benthic invertebrates were responsible for the vast majority of total consumption. Furthermore, relatively large impacts on numerous other groups for both microphytobenthos and A. stutchburyi confirm that these groups are important components of the system, particularly in sustaining higher TLs.
In estuarine ecosystems where pelagic phytoplankton populations are low (as in this case) and there is limited top-down control, then bottom-up control on phytoplankton productivity may be more important (Prins et al. Citation1998). It is unlikely that light is limiting pelagic phytoplankton growth in such a shallow estuary with a highly abundant and productive microphytobenthos community (Cahoon and Safi Citation2002), but water column nutrient concentrations in estuaries similar to Whangateau tend to be low ( and
concentrations are typically <0.01 mg/L; e.g. Tay et al. Citation2012). This highlights the functionally important link between benthic macrofauna, such as A. stutchburyi, and microphytobenthos. Microphytobenthos have been recognised as important primary producers in shallow estuarine systems worldwide (see reviews by MacIntyre et al. Citation1996; Miller et al. Citation1996), and in many of these systems there are abundant natural or cultivated suspension feeding bivalve populations. Experimental studies have shown that resuspended microphytobenthos may represent an important food source for bivalves in many estuarine systems, for example in Marennes-Oleron Bay in France (Kang et al. Citation1999), in Halifax, Nova Scotia (Grant et al. Citation1990) and in Kwangyang Bay in Korea (Kang et al. Citation2006). The bivalves, in turn, can enhance microphytobenthos productivity by increasing nutrient availability through excretion and bioturbation of nutrient-rich porewaters (Sandwell et al. Citation2009; Jones et al. Citation2011a). Our model results support these studies by highlighting the important role of microphytobenthos in our study system. Removal of microphytobenthos from the model revealed that phytoplankton and detrital production alone were not enough to sustain the consumer groups (i.e. a balanced solution was not obtained with benthic invertebrates and zooplankton feeding only on phytoplankton and detritus). It would seem that in this estuary (and likely in other similar systems) suspension feeding bivalves are not a ‘natural eutrophication control’ (sensu Officer et al. Citation1982); rather they appear to perform the opposite function by stimulating benthic primary production.
The trophic model also shows a system characterised by high flows to detritus for some groups and relatively high detritus export (c. 40%) from the system. Some other coastal lagoon systems show similar characteristics, for example, high microphytobenthos productivity and significant export of organic material to the open ocean (Haese & Pronk Citation2011), as well as high flows to detritus and dominance of benthic groups (Milessi et al. Citation2010). The ‘detritus export’ in our model was 96 g C m−2 yr−1, which includes detritus that is buried in the sediment and that which is physically exported out of system. Sedimentation rates in Whangateau Harbour are likely to be relatively low across most of the estuary due to the limited development of the catchment, and the well-flushed nature of the estuary (Kelly Citation2009). However, mangrove expansion indicates that net sedimentation is occurring in the more sheltered reaches of the estuary, and suggests that detritus burial is likely in these areas at least (Townsend et al. Citation2010).
Whangateau Harbour is ebb-dominated (Grace Citation1972) and has a large tidal prism (80% of estuary volume), and thus the system likely conforms to the ‘outwelling hypothesis’, where a substantial amount of detritus may be advected to the coastal environment (Odum et al. Citation1979; Childers et al. Citation2000). The flux of organic matter from Whangateau has not been measured directly, but comparison with studies from other estuaries reveals that an export of c. 100 g C m−2 yr−1 is not unreasonable, for example, 50–80 g C m−2 yr−1 for Manukau Harbour, New Zealand (Vant et al. Citation1998), 453 g C m−2 yr−1 for North Inlet, South Carolina (Dame et al. Citation1986), and c. 320 g C m−2 yr−1 for Swartkops Estuary, South Africa (Baird et al. Citation1987). This export of organic material to the coastal ocean is likely to provide an energy source for plankton and benthic consumers, which may significantly influence coastal productivity (Dame and Allen Citation1996; Schlacher et al. Citation2009; Savage et al. Citation2012).
Post-mortality event bivalve biomass in the context of possible A. stutchburyi biomass range
In this study, a possible range for A. stutchburyi biomass was established using the trophic model to place the reduction in A. stutchburyi following the mass mortality event in the context of a theoretical minimum biomass. We found that A. stutchburyi biomass was able to be substantially decreased, to 22% of its original value, without unbalancing the model. The minimum biomass (0.73 g C m−2) was less than the A. stutchburyi biomass estimated for the estuary after the mass mortality event (1.58 g C m−2), suggesting that the system is able to assimilate such a reduction in clam biomass. In other ecosystems (particularly those with commercially fished shellfish populations), low bivalve stocks are believed to have contributed to mass mortalities of shorebirds, such as oystercatchers (e.g. Atkinson et al. Citation2003). However, to the best of our knowledge, there were no adverse effects reported on any other components of the ecosystem following the mass mortality event in 2009. Furthermore, recent surveys (in 2013 and 2014) suggest that the A. stutchburyi population in Whangateau Harbour has recovered (Berkenbusch et al. Citation2015). We recognise that incorporating spatial and temporal dynamics into the modelling process might reveal that the system is more sensitive than the current results suggest, and this study does not address other potential effects of the mass mortality event. For example, there may have been spatially and temporally localised effects associated with organic matter decomposition, and changes in sediment composition associated with an increase in shell hash, that cannot be resolved by the ecosystem-level calculations and mass-balance modelling carried out in this study.
We estimated the maximum A. stutchburyi biomass (i.e. ecological carrying capacity) to be 4.5 times greater than the pre-mass mortality event level (fuelled by the high microphytobenthos biomass in the ecosystem), perhaps supporting anecdotal evidence of historically larger individual bivalves and bivalve populations (Marsden & Adkins Citation2010). A. stutchburyi populations in estuaries around New Zealand in recent decades may have been lower they were historically, due to habitat degradation, sedimentation and over-fishing (e.g. Cummings et al. Citation2007; Marsden & Adkins Citation2010). In other systems, detritus has been shown to make up a significant proportion of suspension feeding bivalves’ diet (Kang et al. Citation1999; Decottignies et al. Citation2007). If detritus were to be a more important component in A. stutchburyi diet (than is assumed in this model), then there is the potential for even greater ecological carrying capacity; in the current model, the detritus is not a large food source. However, as a substantial amount of detritus, phytoplankton and resuspended microphytobenthos is likely to be removed from the estuary by tidal flushing, ecological carrying-capacity calculations should be viewed with caution.
Conclusions
This study highlights the important role of microphytobenthos in sustaining the food web in Whangateau Harbour, and suggests that phytoplankton production, and the interactions between suspension feeding bivalves and phytoplankton are of reduced importance. Instead, the A. stutchburyi population plays a key role in facilitating the transfer of energy from microphytobenthos to higher TLs. Our results are likely to be applicable to other shallow, well-flushed estuaries that are characterised by extensive intertidal flats, and abundant microphytobenthos and suspension feeding bivalve populations.
The trophic model indicates that A. stutchburyi biomass may be reduced or increased considerably without exceeding the ecologically carrying capacity or resulting in food limitation for higher TLs. The reduction in A. stutchburyi biomass in Whangateau Harbour following a mass mortality event in 2009 was within the range identified in the model, suggesting it may have had a limited effect on trophic dynamics. However, this study does not address other potential effects (e.g. from organic matter decomposition or changes in sediment composition) of the mass mortality event.
The trophic model provided a framework to synthesise available knowledge from a wide range of sources, quantify the relative importance of ecosystem components, which is difficult to accomplish any other way when components are coupled in a complex and nonlinear way, and finally, to identify knowledge gaps. Although this study incorporated a comprehensive overview of available data, there were still limited data available for quantifying fish biomass in Whangateau Harbour (and in New Zealand estuaries in general). Further complicating parameter estimation, a number of fish species migrate to and from estuaries, or use estuarine habitats as nursery grounds before dispersing to open coast environments (Morrison et al. Citation2002; Francis et al. Citation2005). Finally, the model did not include temporal dynamics due to lack of time series data for validation. It is possible that dynamic features of the die-off event such as anoxia, sediment composition changes and rapid increase in detrital material might mean that the system is somewhat more sensitive to biomass changes than the current mass-balance model suggests.
This study highlights the importance of ensuring microphytobenthos productivity in shallow estuarine ecosystems is not compromised by catchment or estuarine management practices that increase turbidity and/or sedimentation (e.g. Pratt et al. Citation2013). Furthermore, the application of an ecosystem-level model that can identify key components of a system is a useful tool that can inform and prioritise monitoring programmes. National and international reporting programmes are often focused on environmental performance indicators, and results from ecosystem-level models may aid in the selection of indicator species to ensure that programmes include components of the ecosystem which have a significant impact on trophic dynamics.
Acknowledgements
We thank the following people for responding to requests for data and/or advice: Megan Carbines (Auckland Council), Richard Ford and Alan Moore (Ministry for Primary Industries), Mark Morrison, Malcolm Francis and Carolyn Lundquist (all National Institute of Water and Atmospheric Research). Matt Pinkerton (NIWA) provided helpful comments on an earlier draft of this manuscript. Associate editor: Associate Professor Andrea C Alfaro. HFEJ and CAP designed the study, HFEJ undertook the modelling, and wrote the manuscript. CAP, DPH, and KRB assisted in interpretation of results and editing the manuscript.
Disclosure statement
No potential conflict of interest was reported by the authors.
ORCID
Hannah F. E. Jones http://orcid.org/0000-0002-3231-4376
Additional information
Funding
References
- Alfaro AC. 2006. Benthic macro-invertebrate community composition within a mangrove/seagrass estuary in northern New Zealand. Estuar Coast Shelf Sci. 66:97–110. doi: 10.1016/j.ecss.2005.07.024
- Ansell AD. 2001. Dynamics of aggregations of a gastropod predator/scavenger on a New Zealand harbour beach. J Mollus Stud. 67:329–341. doi: 10.1093/mollus/67.3.329
- Atkinson PW, Clark NA, Bell MC, Dare PJ, Clark JA, Ireland PL. 2003. Changes in commercially fished shellfish stocks and shorebird populations in the Wash, England. Biol Conserv. 114:127–141. doi: 10.1016/S0006-3207(03)00017-X
- Baird D, Winter PED, Wendt G. 1987. The flux of particulate material through a well-mixed estuary. Cont Shelf Res. 7:1399–1403. doi: 10.1016/0278-4343(87)90044-6
- Battley PF, Boyer JK, Brownell B, Habraken AM, Moore SJ, Walsh JL. 2007. Population biology and foraging ecology of waders in the Firth of Thames – Update 2007. Auckland Regional Council Technical Publication 347.
- Beentjes MP, Williams BG. 1986. Endogenous circatidal rhythmicity in the New Zealand cockle Chione stutchburyi (Bivalvia, Veneridae). Mar Behav Physiol. 12:171–180. doi: 10.1080/10236248609378644
- Berkenbusch K, Abraham E, Neubauer P. 2015. Intertidal shellfish monitoring in the northern North Island region, 2013–14. New Zealand Fisheries Assessment Report 2015/15. Wellington: Ministry for Primary Industries.
- Bradford-Grieve JM, Murdoch RC, Chapman BE. 1993. Composition of macrozooplankton assemblages associated with the formation and decay of pulses within an upwelling plume in greater Cook Strait, New Zealand. N Z J Mar Freshw Res. 27:1–22. doi: 10.1080/00288330.1993.9516541
- Bradford-Grieve JM, Probert PK, Nodder SD, Thompson D, Hall J, Hanchet S, Boyd P, Zeldis J, Baker AN, Best HA, et al. 2003. Pilot trophic model for subantarctic water over the Southern Plateau, New Zealand: a low biomass, high transfer efficiency system. J Exp Mar Biol Ecol. 289:223–262. doi: 10.1016/S0022-0981(03)00045-5
- Brey T. 2001. Population dynamics in benthic invertebrates. A virtual handbook. Version 01.2. [Internet]. [Cited 2011 Feb 11]. Available from: http://www.thomas-brey.de
- Byron C, Link J, Costa-Pierce B, Bengtson D. 2011a. Calculating ecological carrying capacity of shellfish aquaculture using mass-balance modeling: Narragansett Bay, Rhode Island. Ecol Model. 222:1743–1755. doi: 10.1016/j.ecolmodel.2011.03.010
- Byron C, Link J, Costa-Pierce B, Bengtson D. 2011b. Modeling ecological carrying capacity of shellfish aquaculture in highly flushed temperate lagoons. Aquaculture. 314:87–99. doi: 10.1016/j.aquaculture.2011.02.019
- Cahoon LB, Safi KA. 2002. Distribution and biomass of benthic microalgae in Manukau Harbour, New Zealand. N Z J Mar Freshw Res. 36:257–266. doi: 10.1080/00288330.2002.9517084
- Cammen LM, Seneca ED, Stroud LM. 1984. Long-term variation of fiddler crab populations in North Carolina salt marshes. Estuaries. 7:171–175. doi: 10.2307/1351772
- César II, Armendáriz LC. 2007. Secondary production of Chasmagnathus granulatus (Crustacea; Decapoda) in a Ramsar Site from Argentina. Braz J Biol. 67:235–241. doi: 10.1590/S1519-69842007000200008
- Childers DL, Day JW, McKellar HN. 2000. Twenty more years of marsh and estuarine flux studies: revisiting Nixon (1980). In: Weinstein MP, Kreeger DA, editors. Concepts and controversies in tidal marsh ecology. Hingham, MA: Kluwer Academic Publishers; p. 391–423.
- Christensen V, Pauly D. 1992. ECOPATH II – a software for balancing steady-state ecosystem models and calculating network characteristics. Ecol Model. 61:169–185. doi: 10.1016/0304-3800(92)90016-8
- Christensen V, Walters CJ. 2004. Ecopath with Ecosim: methods, capabilities and limitations. Ecol Model. 172:109–139. doi: 10.1016/j.ecolmodel.2003.09.003
- Christensen V, Walters CJ, Pauly D, Forrest R. 2008. Ecopath with Ecosim Version 6: a user guide. Vancouver: Fisheries Centre, University of British Columbia.
- Chubb CF, Potter IC, Grant CJ, Lenanton RCJ, Wallace J. 1981. Age, structure, growth rates and movements of sea mullet, Mugil cephalus L., and yellow-eye mullet, Aldrichetta forsteri (Valenciennes) in the Swan-Avon river system, Western Australia. Aust J Mar Freshw Res. 32:605–628. doi: 10.1071/MF9810605
- Cummings V, Hewitt J, Halliday J, Mackay G. 2007. Optimizing the success of Austrovenus stutchburyi restoration: preliminary investigations in a New Zealand estuary. J Shellfish Res. 26:89–100. doi: 10.2983/0730-8000(2007)26[89:OTSOAS]2.0.CO;2
- Cummings VJ, Schneider DC, Wilkinson MR. 1997. Multiscale experimental analysis of aggregative responses of mobile predators to infaunal prey. J Exp Mar Biol Ecol. 216:211–227. doi: 10.1016/S0022-0981(97)00097-X
- Curtis TD, Shima JS. 2005. Geographic and sex-specific variation in growth of yellow-eyed mullet, Aldrichetta forsteri, from estuaries around New Zealand. N Z J Mar Freshw Res. 39:1277–1285. doi: 10.1080/00288330.2005.9517392
- Dame R, Chrzanowski T, Bildstein K, Kjerfve B, McKellar H, Nelson D, Spurrier J, Stancyk S, Stevenson H, Vernberg J, Zingmark R. 1986. The outwelling hypothesis and North Inlet, South Carolina. Mar Ecol Prog Ser. 33:217–229. doi: 10.3354/meps033217
- Dame RF, Allen DM. 1996. Between estuaries and the sea. J Exp Mar Biol Ecol. 200:169–185. doi: 10.1016/S0022-0981(96)02642-1
- Dame RF, Prins TC. 1998. Bivalve carrying capacity in coastal ecosystems. Aquat Ecol. 31:409–421. doi: 10.1023/A:1009997011583
- Decottignies P, Beninger PG, Rince Y, Robins RJ, Riera P. 2007. Exploitation of natural food sources by two sympatric, invasive suspension-feeders: Crassostrea gigas and Crepidula fornicata. Mar Ecol Prog Ser. 334:179–192. doi: 10.3354/meps334179
- De Luca-Abbott S. 2001. Biomarkers of sub-lethal stress in the soft-sediment bivalve Austrovenus stutchburyi exposed in-situ to contaminated sediment in an urban New Zealand harbour. Mar Pollut Bull. 42:817–825. doi: 10.1016/S0025-326X(00)00226-5
- Dobbinson SJ, Barker MF, Jillett JB. 1989. Experimental shore level transplantation of the New Zealand cockle Chione stutchburyi. J Shellfish Res. 8:197–212.
- Dowding JE, Chamberlin SP. 1991. Annual movement patterns and breeding-site fidelity of the New Zealand Dotterel (Charadrius obscurus). Notornis. 38:89–102.
- Francis MP, Morrison MA, Leathwick J, Walsh C, Middleton C. 2005. Predictive models of small fish presence and abundance in northern New Zealand harbours. Estuar Coast Shelf Sci. 64:419–435. doi: 10.1016/j.ecss.2005.03.007
- Francis R. 1988. Recalculated growth rates for sand flounder, Rhombosolea plebeia, from tagging experiments in Canterbury, New Zealand, 1964–66. N Z J Mar Freshw Res. 22:53–56. doi: 10.1080/00288330.1988.9516277
- Froese R, Pauly D. 2005. Fishbase: electronic publication. Version 11/2010. [Internet] [Cited 2011 Feb 4]. Available from: http://www.fishbase.org
- Froneman PW. 2001. Seasonal changes in zooplankton biomass and grazing in a temperate estuary, South Africa. Estuar Coast Shelf Sci. 52:543–553.
- Fulton EA, Smith ADM, Johnson CR. 2003. Effect of complexity on marine ecosystem models. Mar Ecol Prog Ser. 253:1–16. doi: 10.3354/meps253001
- Fulton RS. 1984. Distribution and community structure of estuarine copepods. Estuaries. 7:38–50. doi: 10.2307/1351955
- Gaedke U. 1995. A comparison of whole-community and ecosystem approaches (biomass size distributions, food web analysis, network analysis, simulation models) to study the structure, function and regulation of pelagic food webs. J Plankton Res. 17:1273–1305. doi: 10.1093/plankt/17.6.1273
- Gallegos CL, Vant WN. 1996. An incubation procedure for estimating carbon-to-chlorophyll ratios and growth-irradiance relationships of estuarine phytoplankton. Mar Ecol Prog Ser. 138:275–291. doi: 10.3354/meps138275
- Giles KF. 2002. Seasonal dynamics of zooplankton in Tauranga Harbour, New Zealand [MSc thesis]. Hamilton: University of Waikato.
- van Gils JA, Piersma T, Dekinga A, Spaans B, Kraan C. 2006. Shellfish dredging pushes a flexible avian top predator out of a marine protected area. PLoS Biol. 4(12):e376. doi: 10.1371/journal.pbio.0040376
- Grace RV. 1972. The benthic ecology of the entrance to Whangateau Harbour, Northland, New Zealand [ PhD thesis]. Auckland: University of Auckland.
- Grant CM, Hay BE. 2003. A review of the issues related to the depletion of populations of selected infaunal bivalve species in the Hauraki Gulf Marine Park. Prepared for the Hauraki Gulf Forum. Auckland: AquaBio Consultants Ltd.
- Grant J, Enright CT, Griswold A. 1990. Resuspension and growth of Ostrea edulis: a field experiment. Mar Biol. 104:51–59. doi: 10.1007/BF01313157
- Haedrich RL, Merrett NR. 1992. Production/biomass ratios, size frequencies, and biomass spectra in deep-sea demersal fishes. In: Rowe GT, Pariente V, editors. Deep-sea food chains and the global carbon cycle. Dordrecht: Kluwer Academic; p. 157–182.
- Haese RR, Pronk GJ. 2011. Intra-annual variability in primary producer groups and nitrogen dynamics in an intermittently closed estuary exposed to Mediterranean climate. Estuar Coasts. 34:557–568. doi: 10.1007/s12237-010-9363-5
- Halliday J, Cummings V. 2009. Mahurangi Estuary ecological monitoring programme – report on data collected from July 1994 to January 2009. Auckland Regional Council Technical Report 2009/120.
- Hartill BW, Morrison MA, Shankar U, Drury J. 2000. Whangateau Harbour habitat map. Wellington: NIWA.
- Heather B, Robertson H. 2000. The field guide to the birds of New Zealand. Auckland: Viking.
- Hewitt JE. 2008. Benthic ecology of Weiti estuary and Karepiro Bay. Auckland Regional Council Technical Report 2008/019.
- Hicks GRF. 1985. Biomass and production estimates for an estuarine meiobenthic copepod, with an instantaneous assessment of exploitation by flatfish predators. N Z J Ecol. 8:125–127.
- Hily C. 1991. Is the activity of benthic suspension feeders a factor controlling water quality in the Bay of Brest? Mar Ecol Prog Ser. 69:179–188. doi: 10.3354/meps069179
- Horiguchi T. 1995. Heterocapsa circularisquama sp. nov. (Peridiniales, Dinophyceae): a new marine dinoflagellate causing mass mortality of bivalves in Japan. Phycol Res. 43:129–136. doi: 10.1111/j.1440-1835.1995.tb00016.x
- Hume TM, Snelder T, Weatherhead M, Liefting R. 2007. A controlling factor approach to estuary classification. Ocean Coast. Manage. 50:905–929. doi: 10.1016/j.ocecoaman.2007.05.009
- Jackson JBC, Kirby MX, Berger WH, Bjorndal KA, Botsford LW, Bourque BJ, Bradbury RH, Cooke R, Erlandson J, Estes JA, et al. 2001. Historical overfishing and the recent collapse of coastal ecosystems. Science. 293:629–637. doi: 10.1126/science.1059199
- Jiang W, Gibbs MT. 2005. Predicting the carrying capacity of bivalve shellfish culture using a steady, linear food web model. Aquaculture. 244:171–185. doi: 10.1016/j.aquaculture.2004.11.050
- Jones HFE. 2011. The ecological role of the suspension feeding bivalve, Austrovenus stutchburyi, in estuarine ecosystems [ PhD thesis]. Hamilton: University of Waikato.
- Jones HFE, Pilditch CA, Bruesewitz DA, Lohrer AM. 2011a. Sedimentary environment influences the effect of an infaunal suspension feeding bivalve on estuarine ecosystem function. PLoS ONE. 6:e27065. doi: 10.1371/journal.pone.0027065
- Jones HFE, Pilditch CA, Bryan KR, Hamilton DP. 2011b. Effects of infaunal bivalve density and flow speed on clearance rates and near-bed hydrodynamics. J Exp Mar Biol Ecol. 401:20–28. doi: 10.1016/j.jembe.2011.03.006
- Jonsson PR, Andé C. 1992. Mass mortality of the bivalve Cerastoderma edule on the Swedish west coast caused by infestation with the digenean trematode Cercaria cerastodermae I. Ophelia. 36:151–157. doi: 10.1080/00785326.1992.10430365
- Kang CK, Kim JB, Lee KS, Lee PY, Hong JS. 2003. Trophic importance of benthic microalgae to macrozoobenthos in coastal bay systems in Korea: dual stable C and N isotope analyses. Mar Ecol Prog Ser. 259:79–92. doi: 10.3354/meps259079
- Kang CK, Lee YW, Choy EJ, Shin JK, Seo IS, Hong JS. 2006. Microphytobenthos seasonality determines growth and reproduction in intertidal bivalves. Mar Ecol Prog Ser. 315:113–127. doi: 10.3354/meps315113
- Kang CK, Sauriau PG, Richard P, Blanchard GF. 1999. Food sources of the infaunal suspension-feeding bivalve Cerastoderma edule in a muddy sandflat of Marennes-Oléron Bay, as determined by analyses of carbon and nitrogen stable isotopes. Mar Ecol Prog Ser. 187:147–158. doi: 10.3354/meps187147
- Kearney MB. 1999. Ecology and management of Austrovenus stutchburyi in the Whangateau Harbour [MSc thesis]. New Zealand: University of Auckland.
- Kelly S. 2009. Whangateau catchment and harbour study: review of marine environment information. Auckland: Auckland Regional Council Technical Report 2009/003.
- Kemp WM, Boynton WR, Adolf JE, Boesch DF, Boicourt WC, Brush G, Cornwell JC, Fisher TR, Gilbert PM, Hagy JD, et al. 2005. Eutrophication of Chesapeake Bay: historical trends and ecological interactions. Mar Ecol Prog Ser. 303:1–29. doi: 10.3354/meps303001
- Klimmerer WJ, Thompson JK. 2014. Phytoplankton growth balanced by clam and zooplankton grazing and net transport into the low-salinity zone of the San Francisco estuary. Estuar Coasts. 37:1202–1218. doi: 10.1007/s12237-013-9753-6
- Kraeuter JN, Klinck JM, Powell EN, Hofmann EE, Buckner SC, Grizzle RE, Bricelj VM. 2008. Effects of the fishery on the northern quahog (hard clam, Mercenaria mercenaria L.) population in Great South Bay, New York: a modeling study. J Shellfish Res. 27:653–666. doi: 10.2983/0730-8000(2008)27[653:EOTFOT]2.0.CO;2
- Lara-Lopez A, Neira FJ. 2008. Synchronicity between zooplankton biomass and larval fish concentrations along a highly flushed Tasmanian estuary: assessment using net and acoustic methods. J Plankton Res. 30:1061–1073. doi: 10.1093/plankt/fbn063
- Leandro SM, Morgado F, Pereira F, Queiroga H. 2007. Temporal changes of abundance, biomass and production of copepod community in a shallow temperate estuary (Ria de Aveiro, Portugal). Estuar Coast Shelf Sci. 74:215–222. doi: 10.1016/j.ecss.2007.04.009
- Le Port A. 2003. Diel movement patterns and foraging activity of the New Zealand eagle ray (Myliobatis tenuicaudatus) in Whangateau estuary, New Zealand [MSc thesis]. New Zealand: University of Auckland.
- Lin HJ, Shao KT, Jan RQ, Hsieh HL, Chen CP, Hsieh LY, Hsiao YT. 2007. A trophic model for the Danshuei River Estuary, a hypoxic estuary in northern Taiwan. Mar Pollut Bull. 54:1789–1800. doi: 10.1016/j.marpolbul.2007.07.008
- Link JS. 2010. Adding rigor to ecological network models by evaluating a set of pre-balance diagnostics: a plea for PREBAL. Ecol Model. 221:1580–1591. doi: 10.1016/j.ecolmodel.2010.03.012
- Lonsdale DJ, Cerrato RM, Caron DA, Schaffner RA. 2007. Zooplankton changes associated with grazing pressure of northern quahogs (Mercenaria mercenaria L.) in experimental mesocosms. Estuar Coast Shelf Sci. 73:101–110. doi: 10.1016/j.ecss.2006.12.014
- Lundquist CJ, Pinkerton MH. 2008. Collation of data for ecosystem modelling of Te Tapuwae o Rongokako marine reserve. Science for Conservation 288. Wellington: Department of Conservation.
- MacIntyre HL, Geider RJ, Miller DC. 1996. Microphytobenthos: the ecological role of the “secret garden” of unvegetated, shallow-water marine habitats. I. Distribution, abundance and primary production. Estuaries. 19:186–201. doi: 10.2307/1352224
- Manickchand-Heileman S, Arreguin-Sanchez F, Lara-Dominguez A, Soto LA. 1998. Energy flow and network analysis of Terminos Lagoon, SW Gulf of Mexico. J Fish Biol. 53:179–197. doi: 10.1111/j.1095-8649.1998.tb01026.x
- Marsden ID, Adkins SC. 2010. Current status of cockle bed restoration in New Zealand. Aquaculture Int. 18:83–97. doi: 10.1007/s10499-009-9270-6
- Medway DG. 2000. The reed field guide to common New Zealand shorebirds. Auckland: Reed.
- Milessi AC, Danilo C, Laura RG, Daniel C, Javier S, Rodríguez-Gallego L. 2010. Trophic mass-balance model of a subtropical coastal lagoon, including a comparison with a stable isotope analysis of the food-web. Ecol Model. 221:2859–2869. doi: 10.1016/j.ecolmodel.2010.08.037
- Miller DC, Geider RJ, MacIntyre HL. 1996. Microphytobenthos: the ecological role of the “secret garden” of unvegetated shallow-water marine habitats. II. Role in sediment stability and shallow-water food webs. Estuaries. 19:202–212. doi: 10.2307/1352225
- Ministry of Fisheries. 2009. Proposal to temporarily close Whangateau Harbour to the harvesting of cockles and pipis – initial proposition paper. Wellington: Ministry of Fisheries.
- Morrisey DJ, DeWitt TH, Roper DS, Williamson RB. 1999. Variation in the depth and morphology of burrows of the mud crab Helice crassa among different types of intertidal sediment in New Zealand. Mar Ecol Prog Ser. 182:231–242. doi: 10.3354/meps182231
- Morrison M, Carbines G. 2006. Estimating the abundance and size structure of an estuarine population of the sparid Pagrus auratus, using a towed camera during nocturnal periods of inactivity, and comparisons with conventional sampling techniques. Fish Res. 82:150–161. doi: 10.1016/j.fishres.2006.06.024
- Morrison MA, Francis MP, Hartill BW, Parkinson DM. 2002. Diurnal and tidal variation in the abundance of the fish fauna of a temperate tidal mudflat. Estuar Coast Shelf Sci. 54:793–807. doi: 10.1006/ecss.2001.0857
- Needham H, Singleton N, Giles H, Jones H. 2014. Regional Estuary Monitoring Programme 10 year trend report: April 2001 to April 2011. Waikato Regional Council Technical Report 2014/41.
- Needham HR, Pilditch CA, Lohrer AM, Thrush SF. 2010. Habitat dependence in the functional traits of Austrohelice crassa, a key bioturbating species. Mar Ecol Prog Ser. 414:179–193. doi: 10.3354/meps08726
- Newell RIE. 2004. Ecosystem influences of natural and cultivated populations of suspension-feeding bivalve molluscs: a review. J Shellfish Res. 23:51–61.
- NIWA 2011. Coastal Explorer [Internet]. [cited 2011 Aug 15]. Available from: http://wrenz.niwa.co.nz/webmodel/coastal.
- Norkko J, Hewitt JE, Thrush S. 2006. Effects of increased sedimentation on the physiology of two estuarine soft-sediment bivalves, Austrovenus stutchburyi and Paphies australis. J Exp Mar Biol Ecol. 333:12–26. doi: 10.1016/j.jembe.2005.11.015
- Odum WE, Fisher JS, Pickral JC. 1979. Factors controlling the flux of particulate organic carbon from estuarine wetlands. In: Livingstone RJ, editor. Ecological processes in coastal and marine systems. New York: Plenum Press; p. 69–80.
- Officer CB, Smayda TJ, Mann R. 1982. Benthic filter feeding: a natural eutrophication control. Mar Ecol Prog Ser. 9:203–210. doi: 10.3354/meps009203
- Ortiz M, Wolff M. 2002. Trophic models of four benthic communities in Tongoy Bay (Chile): comparative analysis and preliminary assessment of management strategies. J Exp Mar Biol Ecol. 268:205–235. doi: 10.1016/S0022-0981(01)00385-9
- Palomares MLD, Pauly D. 1998. Predicting food consumption of fish populations as functions of mortality, food type, morphometrics, temperature and salinity. Mar Freshw Res. 49:447–453. doi: 10.1071/MF98015
- Parrish, G. 2000. Classified summarised notes, North Island, 1 July 1998 to 30 June 1999. Notornis 47:215–234.
- Parrish G. 2001. Classified summarised notes, North Island, 1 July 1999 to 30 June 2000. Notornis 48:165–174.
- Parrish G. 2002. Classified summarised notes, North Island, 1 July 2000 to 30 June 2001. Notornis 49:100–110.
- Parrish G. 2006. Classified summarised notes, North Island, 1 July 2002 to 30 June 2003. Notornis 53: 240–247.
- de Paula R, Silva E, Sousa MI, Caramelo AM. 1993. The Maputo Bay ecosystem (Mozambique). In: Christensen V, Pauly D, editors. Trophic models of aquatic ecosystems. Proceedings of the ICLARM Conference 26; Manilla (Philippines): ICLARM Conference Proceedings. p. 214–223.
- Pawley MDM. 2011. The distribution and abundance of pipis and cockles in the Northland, Auckland and Bay of Plenty regions in 2010. Report for the Ministry of Fisheries. Auckland: Massey University.
- Pawley MDM, Ford R. 2007. Intertidal shellfish monitoring in the Auckland Fisheries Management Area: AKI2006/01. Report for the Ministry of Fisheries. Auckland (New Zealand): University of Auckland and Auckland UniServices Ltd.
- Peterson CH. 2002. Recruitment overfishing in a bivalve mollusc fishery: hard clams (Mercenaria mercenaria) in North Carolina. Can J Fish Aquat Sci. 59:96–104. doi: 10.1139/f01-196
- Piersma T, Koolhaas A, Dekinga A, Beukema JJ, Dekker R, Essink K. 2001. Long-term indirect effects of mechanical cockle-dredging on intertidal bivalve stocks in the Wadden Sea. J Appl Ecol. 38:976–990. doi: 10.1046/j.1365-2664.2001.00652.x
- Pinkerton MH, Lundquist CJ, Duffy CAJ, Freeman DJ. 2008. Trophic modelling of a New Zealand rocky reef ecosystem using simultaneous adjustment of diet, biomass and energetic parameters. J Exp Mar Biol Ecol. 367:189–203. doi: 10.1016/j.jembe.2008.09.022
- Pratt DR, Pilditch CA, Lohrer AM, Thrush SF. 2013. The effects of short-term increases in turbidity on sandflat microphytobenthic productivity and nutrient fluxes. J Sea Res. 92:170–177. doi: 10.1016/j.seares.2013.07.009
- Pratt DR, Pilditch CA, Lohrer AM, Thrush SF, Kraan C. 2014. Spatial distributions of grazing activity and microphytobenthos reveal scale-dependent relationships across a sedimentary gradient. Estuar Coasts. 38:722–734. doi: 10.1007/s12237-014-9857-7
- Prins TC, Smaal AC, Dame RF. 1998. A review of the feedbacks between bivalve grazing and ecosystem processes. Aquat Ecol. 31:349–359. doi: 10.1023/A:1009924624259
- Russell BC. 1983. The food and feeding habits of rocky reef fish of north-eastern New Zealand. N Z J Mar Freshw Res. 17:121–145. doi: 10.1080/00288330.1983.9515991
- Rybarczyk H, Elkaim B. 2003. An analysis of the trophic network of a macrotidal estuary: the Seine Estuary (Eastern Channel, Normandy, France). Estuar Coast Shelf Sci. 58:775–791. doi: 10.1016/S0272-7714(03)00184-7
- Safi KA. 2003. Microalgal populations of three New Zealand coastal locations: forcing functions and benthic-pelagic links. Mar Ecol Prog Ser. 259:67–78. doi: 10.3354/meps259067
- Sandwell DR, Pilditch CA, Lohrer AM. 2009. Density dependent effects of an infaunal suspension-feeding bivalve (Austrovenus stutchburyi) on sandflat nutrient fluxes and microphytobenthic productivity. J Exp Mar Biol Ecol. 373:16–25. doi: 10.1016/j.jembe.2009.02.015
- Savage C, Thrush SF, Lohrer AM, Hewitt JE. 2012. Ecosystem services transcend boundaries: estuaries provide resource subsidies and influence functional diversity in coastal benthic communities. PLoS ONE. 7. doi: 10.1371/journal.pone.0042708
- Scarsbrook M. 2008. Saline water quality state and trends in the Auckland region. Auckland Regional Council Technical Report 2008/05.
- Schlacher TA, Connolly RM, Skillington AJ, Gaston TF. 2009. Can export of organic matter from estuaries support zooplankton in nearshore, marine plumes? Aquat Ecol. 43:383–393. doi: 10.1007/s10452-008-9196-5
- Smaal AC, Prins TC. 1993. The uptake of organic matter and the release of inorganic nutrients by bivalve suspension feeder beds. In: Dame RF, editor. Bivalve filter feeders in estuarine and coastal processes. Berlin: Springer-Verlag; p. 271–298.
- Smaal AC, Vonck A, Bakker M. 1997. Seasonal variation in physiological energetics of Mytilus edulis and Cerastoderma edule of different size classes. J Mar Biol Assoc UK. 77:817–838.
- Stevens MI, Hogg ID, Pilditch CA. 2006. Evidence for female-biased juvenile dispersal in corophiid amphipods from a New Zealand estuary. J Exp Mar Biol Ecol. 331:9–20. doi: 10.1016/j.jembe.2005.09.018
- Stewart MJ, Creese RG. 2004. Feeding ecology of whelks on an intertidal sand flat in north-eastern New Zealand. N Z J Mar Freshw Res. 38:819–831. doi: 10.1080/00288330.2004.9517281
- Tay HW, Bryan KR, Pilditch CA, Park S, Hamilton DP. 2012. Variations in nutrient concentrations at different time scales in two shallow tidally dominated estuaries. Mar Freshw Res. 63:95–109. doi: 10.1071/MF11102
- Taylor MH, Wolff M, Mendo J, Yamashiro C. 2008. Changes in trophic flow structure of Independence Bay (Peru) over an ENSO cycle. Prog Oceanogr. 79:336–351. doi: 10.1016/j.pocean.2008.10.006
- Taylor RB, Willis TJ. 1998. Relationships amongst length, weight and growth of north-eastern New Zealand reef fishes. Mar Freshw Res. 49:255–260. doi: 10.1071/MF97016
- Thieltges DW. 2006. Parasite induced summer mortality in the cockle Cerastoderma edule by the trematode Gymnophallus choledochus. Hydrobiologia. 559:455–461. doi: 10.1007/s10750-005-1345-4
- Thrush SF, Hewitt JE, Gibbs M, Lundquist C, Norkko A. 2006. Functional role of large organisms in intertidal communities: community effects and ecosystem function. Ecosystems. 9:1029–1040. doi: 10.1007/s10021-005-0068-8
- Thrush SF, Hewitt JE, Norkko A, Nicholls PE, Funnell GA, Ellis JI. 2003. Habitat change in estuaries: predicting broad-scale responses of intertidal macrofauna to sediment mud content. Mar Ecol Prog Ser. 263:101–112. doi: 10.3354/meps263101
- Thrush SF, Pridmore RD, Hewitt JE, Cummings VJ. 1991. Impact of ray feeding disturbances on sandflat macrobenthos: do communities dominated by polychaetes or shellfish respond differently. Mar Ecol Prog Ser. 69:245–252. doi: 10.3354/meps069245
- Thrush SF, Pridmore RD, Hewitt JE, Cummings VJ. 1994. The importance of predators on a sandflat: interplay between seasonal changes in prey densities and predator effects. Mar Ecol Prog Ser. 107:211–222. doi: 10.3354/meps107211
- Tomczak MT, Muller-Karulis B, Jarv L, Kotta J, Martin G, Minde A, Pollumae A, Razinkovas A, Strake S, Bucas M, Blenckner T. 2009. Analysis of trophic networks and carbon flows in south-eastern Baltic coastal ecosystems. Prog Oceanogr. 81:111–131. doi: 10.1016/j.pocean.2009.04.017
- Townsend M, Hailes S, Hewitt, J, Chiaroni L. 2010. Ecological communities and habitats of Whangateau Harbour 2009. Technical Report 2010/057. Auckland: Auckland Regional Council..
- Usmar NR. 2010. Ontogeny and ecology of snapper (Pagrus auratus) in an estuary, the Mahurangi Harbour [ PhD thesis]. Auckland: University of Auckland.
- Uye S, Liang D. 1998. Copepods attain high abundance, biomass and production in the absence of large predators but suffer cannibalistic loss. J Mar Syst. 15:495–501. doi: 10.1016/S0924-7963(97)00052-3
- Vant WN, Budd RG. 1993. Phytoplankton photosynthesis and growth in contrasting regions of Manukau Harbor, New Zealand. N Z J Mar Freshw Res. 27:295–307. doi: 10.1080/00288330.1993.9516570
- Vant WN, Gibbs MM, Safi KA, Thrush SF. 1998. Fluxes of organic carbon in Manukau Harbour, New Zealand. Estuaries. 21:560–570. doi: 10.2307/1353295
- Vant WN, Safi KA. 1996. Size-fractionated phytoplankton biomass and photosynthesis in Manukau harbour, New Zealand. N Z J Mar Freshw Res. 30:115–125. doi: 10.1080/00288330.1996.9516701
- Walshe KAR, Akroyd JM, Manly BFJ. 2006. Intertidal shellfish monitoring in the Auckland Fisheries Management Area AKI 2005. Report prepared for the Ministry of Fisheries. Auckland (New Zealand): Akroyd Walshe Ltd.
- Webb BF. 1973. Fish populations of the Avon-Heathcote estuary: 3. Gut contents. N Z J Mar Freshw Res. 7:223–234. doi: 10.1080/00288330.1973.9515469
- Whitlatch RB, Hines AH, Thrush SF, Hewitt JE, Cummings V. 1997. Benthic faunal responses to variations in patch density and patch size of a suspension-feeding bivalve. J Exp Mar Biol Ecol. 216:171–189. doi: 10.1016/S0022-0981(97)00095-6
- Wilcock RJ, Kemp CLS. 2003. Water quality surveys of Mahurangi Harbour, Upper Waitemata Harbour, and Tamaki Estuary: 1992–2001. Technical Publication 191. Auckland (New Zealand): Auckland Regional Council.
- Wolff M, Koch V, Chavarria JB, Vargas JA. 1998. A trophic flow model of the Golfo de Nicoya, Costa Rica. Rev Biol Trop. 46:63–79.