
ABSTRACT
There are still major gaps in our understanding of the impact of ocean acidification (OA) on some groups of organisms within different geographic regions. We investigated the effect of OA on two common and ecologically important temperate sponge species in New Zealand (Tethya bergquistae and Crella incrustans). Sponges were kept at pH 8 (control) and 7.6 for 4 weeks. Responses of the two species varied, with T. bergquistae kept at pH 7.6 showing some mortality in response to reduced pH and evidence of tissues necrosis. In contrast, only one C. incrustans died in the pH 7.6 treatment and showed little evidence of any tissue degradation. Only T. bergquistae showed evidence for physiological effects of reduced pH as respiration rates were generally higher in the pH 7.6 treatment. Our results provide preliminary evidence to support a general tolerance of temperate sponges to reduced pH, but that some species-specific responses may exist.
Introduction
At 400 ppm, the current level of atmospheric carbon dioxide (CO2) is higher than at any point in the last 800,000 years (Lüthi et al. Citation2008) and is projected to double to between 730 and 1088 ppm by the end of 2100 (IPCC Citation2014). Approximately 30% of the CO2 already released into the atmosphere has been absorbed by the ocean, which has altered seawater pH (Sabine et al. Citation2004) in a process known as Ocean Acidification (OA). The continuous dissolution of CO2 into seawater reduces pH and carbonate saturation, and increases dissolved inorganic carbon (Orr et al. Citation2005). Consequently, as more CO2 is released into the atmosphere ocean surface pH is expected to decline by 0.3–0.5 pH units by 2100, depending on the emissions scenario used (Caldeira and Wickett Citation2005; IPCC Citation2014). Temperate waters are expected to undergo an even greater decline in pH due to the higher solubility of CO2 in cooler waters (Orr et al. Citation2005).
There is now extensive evidence to support that a decline in seawater pH will impact many marine organisms with subsequent ecosystem scale impacts (Hoegh-Guldberg et al. Citation2007; Fabry et al. Citation2008). pH levels expected for 2100 may cause reductions in calcification rates (eg Jokiel et al. Citation2008), inhibit larval settlement (eg Doropoulos et al. Citation2012), reduce fertilisation success and embryo development (eg Scanes et al. Citation2014), and in many cases, negatively impact the physiology and function of photosynthetic organisms (see Anthony et al. Citation2008). Reduced pH has also been shown to disrupt the acid–base balance of extracellular body fluids (Clark et al. Citation2009), which marine organisms compensate for by increasing their standard metabolic rate (Pörtner Citation2008). Higher metabolic rates will be costly in stressful abiotic environments and cause changes in energy allocation to reproduction and somatic growth (Clarke Citation1991). Despite the global interest in OA, there are still some groups of organisms and some geographical locations where our basic understanding of the impacts of pH changes is incomplete.
Sponges are abundant members of marine benthic communities with a number of important functional roles (Bell Citation2008). These roles range from supporting primary production through the wide range of associations with symbionts (Wulff Citation2006; Taylor et al. Citation2007) to the filtration of large quantities of water (see Bell Citation2008 for review). As such, changes to sponges as a result of anthropogenic stressors (Bell et al. Citation2015) and changes in their diversity and abundance may have wide ecosystem impacts. While the responses of some groups of organisms (eg corals and molluscs) to OA have been well studied, we still know little about OA impacts on sponges, and the information that is available, is largely for tropical species (eg Wisshak et al. Citation2012; Bennett et al. Citation2016, but see Duckwork and Peterson Citation2013). Several authors have proposed that organisms such as sponges that are unable to compensate for the reductions in extracellular pH may be susceptible to OA (Pörtner Citation2008). Early studies on the cellular response of sponges to low pH were conducted by Philp (Citation1997, Citation1999), who reported that exposure to reduced seawater pH (7.0 7.1) reduced the aggregative abilities of cells in response to oxidant stressors and increased the permeability of cell membranes to toxic heavy metals. These studies support the hypothesis that reduced pH would be detrimental to sponges due to their limited ability for acid–base regulation (Pörtner Citation2008); however, the pH values used in these earlier studies far exceed those predicted for 2100 (pH < 7.55). Several authors have reported positive effects of OA on sponges. For example, Wisshak et al. (Citation2012) found an increase in bioerosion rates of Cliona orientalis in experimentally manipulated seawater (pH 7.9 and 7.6) by up to 61%. In addition, both Goodwin et al. (Citation2014) and Morrow et al. (Citation2015) reported high tolerances of some sponge species to low pH near volcanic CO2 vents.
Although several authors have reported that OA may have positive effects on sponges (Wisshak et al. Citation2012; Goodwin et al. Citation2014; Morrow et al. Citation2014; Bennett et al. Citation2016), there is some variation in how different sponge species respond. For example, Duckworth et al. (Citation2012) found low pH had no effect on growth, survival and attachment rates of six Caribbean sponge species, while Duckworth and Peterson (Citation2013) reported negative effects of pH on temperate bioeroding sponges. These authors found that bioerosion rates of Cliona celata increased in response to decreased pH, however, this result was accompanied by an increase in mortality of 61% relative to controls. These differing responses of sponges to OA highlight species-specific sensitivities (Pörtner Citation2008; Kroeker et al. Citation2010) that may make it difficult to generalise OA responses.
To date all the studies of OA on sponges, except one on the bioeroding sponge C. celata, have focused on either tropical sponges or those from the warm-water Mediterranean, with little known of how epilithic temperate sponges respond to OA. Therefore the aim of this study was to measure the impact of OA on two temperate sponge species, specifically to investigate the effect of OA on survival, health and respiration rates of two common and ecologically important New Zealand sponges: Tethya bergquistae (Hooper Citation1994) and Crella incrustans (Carter Citation2008).
Materials and methods
Study species
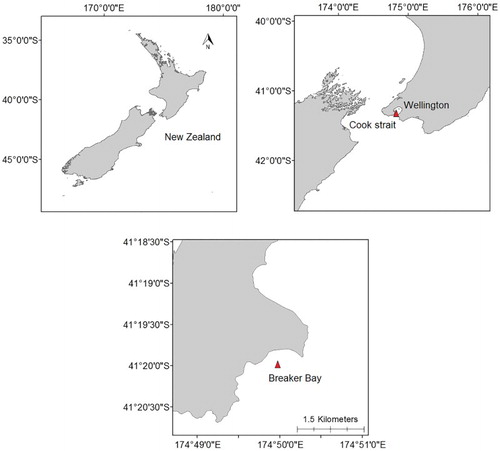
Tethya bergquistae and Crella incrustans are both demosponges, and are two of the most common species inhabiting shallow water rocky reefs in New Zealand. They are important structural components of shallow water reef systems due to their abundance (Berman and Bell Citation2010) and their interactions with the water column (see Perea-Blázquez et al. Citation2012 for data on C. incrustans). Individual specimens of T. bergquistae and C. incrustans were collected in early December 2014, at Breaker Bay, Wellington, New Zealand (41° 19′ 58″ S, 174° 49′ 52″ E; ). All specimens were collected by SCUBA at depths of 4–9 m. Sponges were acclimated for 3 weeks in aquaria at the Victoria University Coastal Ecology Laboratory, where they were kept in unfiltered flow-through seawater at 4 L min−1. In order to minimise disturbance and prevent tissue necrosis during the experiments, the sponges were attached with cotton to plastic mesh disks raised 5 mm above the bottom of the tank. In the case of T. bergquistae, whole individuals were used (approximately 3–4 cm in diameter), however, C. incrustans needed to be cut into approximately 3 cm2 explants. These were left to heal completely for 3 weeks before the experiment began to allow oscules to reform and the sponges to recover.
Figure 1. Map of site collection site, Breaker Bay (red triangle), Wellington South Coast, New Zealand.
Seawater parameters
Projections of future atmospheric and oceanic CO2 concentrations indicate that the average surface pH of the ocean could be 0.3–0.5 pH units lower than today, however, these values vary depending on the climate change model used (Caldeira and Wickett Citation2005). We kept sponges at pH 8.0 (control) and pH 7.6, which is 0.4 pH units below current ambient values in the Wellington region, and based on the midpoint of the most extreme scenarios (Caldeira and Wickett Citation2005; IPCC Citation2014). Although spatial and short-term differences in pH changes are expected to occur regionally (Steinacher et al. Citation2009), seasonally (McNeil and Matear Citation2008), and with latitude (Takahashi et al. Citation2014), depth (Feely et al. Citation2004) and habitat, we were unable to account for these differences in our experimental setup. Future New Zealand OA predictions are broadly in line with global predictions (Gluckman Citation2013), however, as temperate waters are colder than those at lower latitudes a faster change in pH is expected (Fabry et al. Citation2009). Seawater parameters chosen were based on the average pHNIST of seawater in Wellington, which acted as the control, and a ‘low pH’ treatment of 7.6. The current pH of seawater in the Wellington region averages (±SE) approximately 8.00 ± 0.07 units (Wright Citation2011).
Experimental design
The experiment was carried out in a temperature controlled room in order to maintain a stable environment. Temperatures were maintained at 13.5°C, based on the average annual SST value for the Wellington region in order to minimise any effects of thermal stress. The temperature when sponges were collected was approximately 14.5°C. Each treatment was also placed in a water bath containing seawater in order to provide a buffer against any minor fluctuations in the temperature controlled room. Both treatments (control and low pH) each had a total of 24 replicates, which were equally spread across 3 aquaria (each aquaria contained 8 separate sponges). We aimed to sample three of the eight sponges randomly for the respirometry measurements at each sampling interval. However, in some cases only the respiration rates of two sponges were measured either due to time limitations and equipment malfunction (n = 10–15 each for treatment and control at each sampling point). Each species was housed in separate aquaria to prevent potential interactions between the species. For C. incrustans, genotypes were randomly allocated to the treatment and control tanks. The sample sizes used in our study are consistent with those used in a number of recent experimental studies on sponges (see Duckworth et al. Citation2012; Fang et al. Citation2014; Bennett et al. Citation2016; Lesser et al. Citation2016).
Each experimental aquarium held 12 L of fresh seawater filtered to 10 µm, in the case of the controls, or acidified water in the case of the treatments. This level of filtration was used to retain some food for the sponges (Perea-Blaquez et al. Citation2012). All replicate tanks had individual 200 W pond pumps to maintain water flow in the system at a rate of 3.5 L min−1. Acidification of treatment seawater was achieved by the addition of gaseous CO2, which allowed an increase in pCO2 whilst holding constant total alkalinity (AT). Seawater manipulation was performed in large 150 L reservoir tanks via a CO2 solenoid, connected to a PINPOINT pH controller (American Marine Inc., Ridgefield, CT, USA). CO2 was passed through natural seawater (salinity 35 ppm) as very fine bubbles using air stones, which enabled it to pass rapidly into solution. The controller operated by measuring the pH (probe from Weipro, China) and upon detecting a value higher than 7.6 is switched on the electric solenoid allowing CO2 to flow from the cylinder and through the air stones. The speed of CO2 release was by a bubble counter on the solenoid and when the controller registered the desired pH, restricting the flow of CO2 via the solenoid.
When the required pH was reached, the reservoir was sealed for an hour to prevent the water equalising with the atmosphere. Seawater pH was checked again using an independent YSA pH100A pH probe calibrated to buffered standards (Scharlau, Spain) of pHNIST 4.0 and 7.0, after adjustment to check it had not drifted (values of ±0.05 pH were accepted for use). Following the adjustment of seawater pH, the reservoir water was divided into the three replicate aquaria for each treatment, left for another hour and rechecked before the sponges were added to the adjusted seawater.
All control treatment tanks were bubbled with ambient air to maintain a constant pH, as it had previously been discovered that sponge respiration reduced the pH of the tanks by approximately 0.2 units in 24 hours. Bubblers were kept at the far end of the aquaria and above the sponges to prevent any air bubbles from coming into contact with the sponges. Water in the replicate aquaria was replaced every day by placing the sponges in a small container, and replacing with seawater adjusted to the appropriate pH. Although the movement of sponges each day may have caused them some disturbance, care was taken to move them very gently and on days when respiration rates were measured. Sponges were left for at least 3 hours before any measurements were taken. Sponges were not exposed to air during this process. Salinity was measured every week using a handheld refractometer, while water temperature and pHNIST were recorded twice daily using a handheld YSA pH100A pH probe. If the pH of the treatments deviated by more than ±0.05 units, the seawater in the replicate tanks was adjusted by directly bubbling ambient air to increase the pH or slowly adding more CO2 to decrease it. All treatments were kept in darkened conditions to prevent fouling and minimise the growth of algae within experimental replicates and controls. Although this did reduce light levels to less than the sponge’s natural habitat, this made it easier to maintain a stable pH. We did not expect this to have caused any negative effects on the sponges as both species are heterotrophic.
Seawater chemistry parameters, pH and temperature recorded in the treatments for both species are shown in . It was not practical to measure AT or pCO2 daily, however, pH and temperature were measured daily, while salinity was measured weekly. At the end of the experiment, water samples (500 mL volume) were collected from each treatment, fixed with saturated mercuric chloride (HgCl2) and later analysed for total alkalinity by closed cell potentiometric titration (Dickson et al. Citation2007) at the University of Otago. The system is custom built and uses a closed cell titration with a Metrohm Dosimat burette, and custom written software, following the method described by Dickson et al. (Citation2007). The accuracy of the method as determined by analysis of Certified Reference Material provided by Andrew Dickson from Scripps Institution of Oceanography is estimated to be ±2 μmol kg−1. The measurements of Total alkalinity, temperature, salinity and pH were used to calculate the partial pressure of CO2 in seawater (pCO2) using CO2calc (Robbins et al. Citation2010) with refitted CO2 constants (Mehrbach et al. Citation1973; Dickson and Millero Citation1987; Wanninkhof et al. Citation1999). Since AT is unlikely to vary over the duration of the experiment, daily measurements of pH and temperature and weekly measurements of salinity were used to calculate any changes in saturation states and pCO2 during the experiment.
Table 1. Summary of the carbonate chemistry of the control and experimental pH treatments.
Experimental monitoring
The experiment ran for a total of 24 days with a 5-day acclimation period in the setup (29 days total). Baseline respiration rates were measured on the day the sponges were placed in the replicate tanks in case the setup caused them physiological stress. During the 5-day acclimation period, pH values were kept at ambient levels (pH 8) in order for the sponges to adjust to the setup. It was not possible to slowly adjust pH due to the nature of the setup, therefore the sponges experienced acute exposure to pH when the treatment began. Photographs were taken at the start and end of the experiment, or if an individual died.
Sponge survival and signs of declining health were monitored daily, with sponges with more than 50% tissue loss being removed from the experiment. They were then photographed through the cross-section of the sponge. In the case of T. bergquistae, it was noted how the sponge appeared, as on some occasions the sponges began to show signs of external degradation and loss of condition. External appearances of both species at the end of the experiment were categorised into the following groups: (1) healthy sponges with no evidence of disease; (2) presence of a few (one to two) small black lesions of necrosis; (3) transparency of the dermal cortex; (4) white cellular discharge and (5) loss of pigmentation.
Respiration measurements
To determine the metabolic response of T. bergquistae and C. incrustans to OA, respiration rates were measured at the start of each week of the experiment. Baseline respiration rates were measured for two or three sponges from each replicate tank on the day they were moved to the experimental setup (at the start of the acclimation period to the experimental setup). To measure oxygen consumption, individual sponges were moved to a 75-mL Perspex respiration chamber on top of a magnetic stirrer set to 180 rpm. The chamber was then sealed and fitted with an oxygen electrode (FIBOX 3 fibre optic oxygen meter; PreSens GmbH, Germany) and temperature probe. The chamber was sealed and air saturation was then measured every 10 seconds via PreSens Oxy View software (FIBOX 3 for PSt3, version 6.02) for either half an hour or until oxygen saturation reached 70%. Water used in the respiration measurements was maintained at the same pH as the treatment. At the end of the experiment (or following death), all sponges were blotted with paper towels and placed in a drying oven at 80°C for 48 hours to obtain dry weight measurements (DW) (to the nearest 0.0001 g). Respiration rates were normalised using dry weight of the sponge when the experiment was completed. Oxygen consumption was expressed as mg O2 g−1 dry weight h−1 (mg O2 g−1 DW h−1).
Statistical analysis
Survival time data are typically right skewed and consequently violate the assumption of normality that most statistical models require (Collett Citation2003). A Kaplan–Meier survival analysis (Kaplan and Meier Citation1958) was therefore used to obtain nonparametric estimates of the survivorship curves for both species. The Kaplan–Meier model estimates conditional probabilities at each time point when an event occurs and uses the product of those probabilities to estimate the survival rate. An ‘event’ was defined as a sponge mortality event, and sponges still surviving at the end of the experiment were considered ‘censored’ data. Due to the small size of the experiment, and because nonparametric survival analyses cannot explicitly incorporate information from replication (such as differences in survival among replicate tanks), sponges were pooled across replicate tanks to estimate overall survival curves for each species (hence n = 24 for these plots).
Permutational Multivariate Analysis of Variance (PERMANOVA) was used to identify any statistical differences between respiration rates for treatment and control sponges using data from each sponge in each treatment. PERMANOVA is a permutational-based ANOVA equivalent, but does not have the same underlying assumptions as ANOVA. A Bray-Curtis resemblance matrix was produced for the respiration data with the following settings: Pairwise test, Permutation method = unrestricted permutation of raw data, Type III (sums of squares), 999 permutations. The PERMANOVA statistical design had three factors, tank (3 levels), treatment (2 levels) and time (5 levels), along with the interactions between the factors. All means are presented ±SE.
Results
Adjustment of seawater pH
Carbonate chemistry parameters during experimental treatments were calculated from pH, temperature, salinity and total alkalinity (). In the control treatment, pH averaged between 8.07 ± 0.001 and 8.05 ± 0.001 for T. bergquistae and C. incrustans, respectively, which is consistent with the local average pH of 8.00 ± 0.07 in the Wellington region (Wright Citation2011). In the low pH treatments for both species, pH was successfully reduced by 0.4 pH units (NIST scale) with an average (±SE) of pH 7.62 (±0.09) (). This corresponded to pCO2 levels (±SE) of 1514 ± 13.6 and 1532 ± 15.2 µatm in the T. bergquistae and C. incrustans treatment tanks, respectively. The pH of seawater in both control and treatment tanks was monitored up to four times a day. Despite this, there were some fluctuations over the 29-day experiment, which was largely due to the inability to control fluctuations that occurred overnight. Despite these changes, overall variation in pH was minor over the duration of the experiment (). Temperature values were slightly higher, on average (±SE), in the pH treatments for each species (13.7 ± 0.01 and 13.6 ± 0.02), compared to controls (12.7 ± 0.01 and 12.8 ± 0.02).
Figure 2. Seawater pH during experimental conditions for C. incrustans and T. bergquistae. All replicates are shown. Black straight dashed lines represent the mean pH for entire control and experimental tanks.
Health and survival
Survival rates of T. bergquistae were lower in the low pH treatment, with four sponges having died by the end of the experiment (). Sponges in the control treatment did not experience any mortality, resulting in significantly different survival times between treatments (F(1,4) = 196.0, p < .001). Overall survival of T. bergquistae was high when exposed to lowered seawater pH, with no mortality occurring until the 12th day of the experiment, when 3 sponges died, followed by the death of one more individual on day 24. In both treatments, mortality was so low that median survival times could not be calculated. Despite this, several sponges in the low pH treatment displayed signs of external physical degradation. Towards the end of the treatment, four of the sponges exposed to low seawater pH appeared to have thinning of the external cortex, such that their internal structure was visible through the outer membrane (). In addition, two sponges showed extensive loss of pigmentation and one sponge had necrotic lesions on its surface (see Figure S1 for examples of degradation). These changes were much more noticeable compared to the controls, in which only one sponge showed signs of external tissue degradation.
Figure 3. Kaplan–Meier survival curves for T. bergquistae and C. incrustans and under ambient (control) seawater pH and reduced pH (7.6) (pooled analysis, n = 24).
Figure 4. Summary of condition of T. bergquistae and C. incrustans following exposure to lowered seawater pH. Pooled analysis, n = 24 for all treatments.
Overall, C. incrustans remained in good condition and health following exposure to the lowered pH treatment, and no negative effects of lowered pH on survival were detected. Both the control and treatment sponges were healthy externally and internally, with no measurable differences between the two treatments (). In addition, there were no signs of disease/necrosis in any sponges except in the two individuals that died in each treatment (). Because both the control and lowered pH treatment experienced mortality on days 21 and 26, respectively; survival curves were not statistically different (F(1,4) = 0.258, p = .638; ).
Oxygen consumption
Oxygen consumption rates of T. bergquistae exposed to the low pH treatment fluctuated over time and exhibited a lot more variation than the controls (A). In weeks 1 and 2, following the lowering of seawater pH, oxygen consumption of the treatment sponges declined by 0.254 (95% CI ±2.641) and 0.717 (95% CI ±2.642) mg O2 g−1 DW h−1, relative to the baseline rate, before returning to similar rates in week 3. In every week of measurements, oxygen consumption rates of treatment sponges were higher than the controls, however, these rates dropped considerably in week 4 to 0.136 ± 0.037 mg O2 g−1 DW h−1, which was 0.160 mg O2 g−1 DW h−1 lower than the controls. However, despite the high levels of variability, the PERMANOVA identified no effect of tank, but there was a significant effect of both time and treatment, with no significant interaction terms ().
Figure 5. Mean respiration rates (±SE) of T. bergquistae (top) and C. incrustans (bottom) following exposure to lowered seawater pH over a period of 5 weeks. Error bars show one standard error. Time 0 = baseline measurements.
Table 2. PERMANOVA to compare the mean respiration rate of Tethya bergquistae in lowered seawater pH over a period of 5 weeks.
The baseline respiration rates (Time 0) between control and treatment C. incrustans were similar with respiration rates of 3.626 ± 2.06 and 3.735 ± 1.12 mg O2 g−1 DW h−1, respectively (B). In general, sponges in both ambient and lowered seawater pH showed the same trend across time, with a decline in respiration rate from time 0 to week 1 of 0.672 (95% CI ±10.03) and 0.717 (95% CI ±21.93) mg O2 g−1 DW h−1 in control and treatment sponges, respectively. This downward trend continued in weeks 2 and 3 for both the controls and sponges exposed to lowered pH (), although consumption rates of treatment sponges were 0.593 ± 0.269 mg O2 g−1 DW h−1 higher than controls by week 3 (). However, despite these differences over the 4-week experimental period there was no significant interaction between pH and time, only significant main effects of treatment and time on the oxygen consumption rates of C. incrustans ().
Table 3. PERMANOVA to compare the mean respiration rate of Crella incrustans in lowered seawater pH over a period of 5 weeks (n = 3).
Discussion
OA is now recognised as one of the greatest threats to marine ecosystems that will strongly influence future ecosystem structure and function (Hall-Spencer et al. Citation2008; Christen et al. Citation2013). While there is increasing interest in how OA affects sponges, the only data available for temperate sponges are for a bioeroding species (Duckworth and Peterson Citation2013). Here we assessed how two temperate sponge species, T. bergquistae and C. incrustans, responded to a reduced pH treatment. We found that T. bergquistae respiration rates increased in response to OA, while there was no effect on the respiration rates of C. incrustans. Only one C. incrustans treatment sponge died, compared to four T. bergquistae. Our results provide the first insight into how temperate sponges may respond to projected increase in pCO2 for the year 2100 and highlight that some species appear to exhibit a greater tolerance than others.
Health and survival of sponges
The lowered pH treatment affected the survival of T. bergquistae and caused visible physical degradation in seven (approx. 30%) sponges. This was characterised primarily by loss of pigmentation and the development of a transparent outer cortex. Four (16%) sponges died in the lowered pH treatment, while all sponges survived in control treatments. Because T. bergquistae did not experience any mortality until day 12 of exposure to low pH, it seems unlikely it was acute shock from rapid exposure to low pH that killed the sponges, but rather the gradual effect of pH over time. Mortality of T. bergquistae occurred on days 12 and 22. This result, combined with the constant environmental parameters within the experiment, indicates that these mortalities were not caused by experimental error, fluctuation in environmental factors or by a single event. This result is consistent with those reported by Duckworth and Peterson (Citation2013), in which the authors reported a 20% mortality of the temperate boring sponge, C. celata, following exposure to experimentally lowered pH (pH = 7.8). These authors found mortality occurred slowly over a period of 30–60 days and suggested that these mortalities were primarily a result of pH rather than experimental stress.
Lowered pH did not appear to negatively impact the survival of C. incrustans, as both the low pH treatment and the control sponges experienced the same low mortality rate. In both cases the dead sponge in each treatment was characterised by white cellular discharge and visible necrosis. Because sponges in both the treatments remained healthy overall, these mortalities were likely a result of experimental conditions. Duckworth et al. (Citation2012) studied the survival of six species of Caribbean sponges and found that seawater pH of 7.8 had little effect on any species investigated. These authors suggested that their study species are all ‘generalists’ that are found in differing habitats with a wide array of distributions and are therefore able to tolerate fluctuations in pH. Similarly, C. incrustans could be described as a generalist species, as it is found in a wide array of habitats, from intertidal rock pools, reef walls and ridges, to the understory of macroalgal canopies (Bergquist Citation1968), and is often found growing on kelp holdfasts (Cárdenas et al. Citation2012). Growth of C. incrustans varies depending on its habitat, with more elaborate growth forms found in calmer waters and the largest specimens being found on rock ridges where there is strong current but low wave impact (Battershill et al. Citation1984), demonstrating wide adaptive abilities. Therefore C. incrustans may be less susceptible to low pH as it has a wider range of environmental tolerances, despite T. bergquistae also generally being a successful species (Bergquist Citation1968; Sanford and Kelly Citation2011). The differing survival rates and overall responses of T. bergquistae and C. incrustans to low pH are consistent to the overall variability that has been documented in sponge responses to OA (Fabricius et al. Citation2011; Goodwin et al. Citation2014; Morrow et al. Citation2014; Bennett et al. Citation2016). It is unclear why T. bergquistae showed higher susceptibility to the low pH treatment, relative to C. incrustans, but it may be the result of differential effects of cellular acidosis. Decreased pH has been found to cause acidosis in many marine invertebrates, such as corals and sea urchins (Orr et al. Citation2005; Clark et al. Citation2009), although further research will be needed to confirm if this is the case in sponges.
Another possible reason T. bergquistae was more susceptible could be due to changes in the symbiotic microbial communities associated with these species. T. bergquistae is known to host a wide array of microbial symbionts (Cárdenas et al. Citation2014), and it is possible that they perform a number of beneficial roles to the sponge that are not fully understood. While the effects of environmental variation on non-photosynthetic sponge microbes are less well studied than photosymbionts, microbial symbiont populations have been shown to shift under more acidic conditions (Morrow et al. Citation2014) and often to the detriment of the host (Fang et al. Citation2013, Citation2014). It is possible a similar phenomenon may have caused the degraded sponge health in this case, but more research is needed to investigate this further since nothing is currently known about the microbial communities associated with C. incrustans. It is also possible that changes in the microbial community could account for differences in the respiration rates between control and treatment T. bergquistae.
Linking physiological responses to physical health and survival
Our results demonstrate that respiration rates were generally higher in T. bergquistae treatment sponges compared to the controls. Although there has been little research into how OA impacts on sponge metabolism, it is thought that it might affect feeding, reproductive success and regeneration (Philp Citation1999; Fang et al. Citation2014; Goodwin et al. Citation2014; Bennett et al. Citation2016). Fang et al. (Citation2014) investigated combined effects of temperature and pH on the boring sponge C. orientalis and found that under the ‘business as usual’ climate scenario, the mean rates of oxygen consumption increased from 32.0 to 41.1 and 52.8 µg O2 cm−2 h−1, respectively. This increase was associated with bleaching and negative growth, suggesting that the total amount of acquired carbon was not sufficient for metabolic maintenance or growth (Fang et al. Citation2014). In our experiment, there was no visible loss of biomass in response to the worst case IPCC prediction for pH, and although 30% of T. bergquistae experienced external degradation, C. incrustans experienced no physical degradation.
Ecological implications
The increased respiration rates reported for T. bergquistae when subjected to OA may have implications for the population biology of this species, and for the wider ecosystem if other sponge species respond in a similar way. Increases in respiration rate mean higher energy expenditure for the sponge. This must either be met from increased food intake or a decrease in other process, such as growth and reproduction; this may reduce the overall population size. On the Wellington South Coast, T. bergquistae is generally abundant (and also throughout New Zealand), but is one of many sponge species (Berman and Bell Citation2010). If the T. bergquistae response to OA is indicative of other sponge species, then there could be declines in the overall sponge populations. Perea-Blázquez et al. (Citation2012) estimated that the sponge assemblages on the Wellington South Coast consume a significant proportion of the available picoplankton and heterotrophic bacteria from the water column. Changes in the abundance of sponges could therefore have secondary impacts on other ecosystems, although the exact nature of such effects is difficult to predict. Conversely, there will be little wider ecological impact resulting from sponge responses to OA if other temperate New Zealand sponges respond like C. incrustans. This highlights the need to study a greater number of species to enable generalisations to be made about the response of sponges to OA and understand any wider ecological impacts.
Limitations
The results of our study should be considered in respect to a number of potential limitations to the experimental design. The water in each aquaria was only replaced every 24 hours. Earlier studies have shown that similar amounts of sponge biomass as used in the present study filter between 28 and 100 litres of water per day (Perea-Blázquez et al. Citation2012, Citation2013) meaning the sponges likely filtered the water multiple times and likely removed all the food. Maintaining food concentrations in closed systems is problematic, however, sponges are subjected to wide variation in food concentrations in their natural environments (Perea-Blázquez et al. Citation2013) and are likely adapted to such temporal variations in food supply. It is also possible that waste products may have built up in the tanks. However, since control sponges remained healthy for both species over the experiment it seems unlikely that food limitation or build-up of waste influenced the results. It is possible that the food limitation explains the overall decline in respiration rates over the course of the experiment. In the case of both C. incrustans and T. bergquistae both control and treatment sponges showed a gradual decline in respiration over time. Given this response was found across all treatments and for both species, we don’t believe this is the result of the treatments and is mostly likely an experimental artefact. This response could be explained as: (1) the result of declining sponge health; (2) a possible response to lowered food concentrations in the experimental systems or (3) a further acclimation response to being in the experimental systems. As both control and treatment sponges showed the same results, we don’t believe this effect alters our interpretation of the results. A further consideration is that we may have inadvertently conducted a multiple stressor study: food limitation in combination with acidification. This has the potential to bias the low pH treatments because they may have had two stressors (pH and food limitation), whereas the control had just food limitation. Currently, there is no information on whether OA may interact (in either an additive or multiplicative way) with sponge feeding rates or mechanisms, but it cannot be completely excluded as an explanation for the treatment effect for T. bergquistae.
Our simple experimental system was unable to mimic the natural fluctuations in pH variation seen in natural systems, and only considered one fairly extreme pH treatment. Future studies should focus on examining how temperate sponges respond to such variations and to a wider range of treatments. It is possible that the disturbance caused by moving sponges during water changes or to respiration chambers resulted in the cessation of sponge pumping. The nature of the sponge morphologies made checking for pumping activity with dye problematic. However, to alleviate these problems, sponges were left for at least 3 hours after the water changes before moving to respiration chambers, and we left in respiration chambers for at least 30 minutes to acclimate before measurements were taken. Since all sponges produced reliable oxygen consumption curves they must have been pumping. We did not explicitly take into account genotype effects in our study of C. incrustans, instead we chose to randomly allocate sponges to treatment and control tanks as genotype effects were not the focus of this study. While this approach might increase the variability within the results, this should be consistent across tanks.
Conclusion
Levels of seawater pH tested in this study had little effect on the survival or health of C. incrustans, while T. bergquistae experienced some mortality and a decline in health. Tethya bergquistae showed increased respiration rates in response to being kept at pH 7.6, suggesting some physiological effects. Results from this experiment are consistent with findings from previous studies, both in terms of the limited negative response (Duckworth et al. Citation2012; Stubler et al. Citation2014) and the species-dependent differences in tolerance to pH (Goodwin et al. Citation2014; Morrow et al. Citation2014) and provide initial insights into how temperate sponges might respond to OA.
Fig S1. External signs of health degradation in Tethya bergquistae following exposure to lowered seawater pH. A, loss of pigmentation; B, thinning of external cortex (indicated by white arrows); C, protruding necrotic pustules (indicated by black arrows).
Download MS Word (384.6 KB)Acknowledgements
We are grateful to all of the divers and technicians at the Victoria University Coastal Ecology Lab (VUCEL) for help and support during diving activities and for technical support during experiments. We would also like to thank K. Currie and J. Murdock at NIWA for their assistance in seawater measuring alkalinity, and C. A. Cardenas and A. Laferriere for their assistance and feedback. We are grateful to Joe Marlow for assistance with the statistical analysis.
Disclosure statement
No potential conflict of interest was reported by the authors.
Additional information
Funding
Related Research Data
References
- Anthony KR, Kline DI, Diaz Pulido G, Dove S, Hoegh Guldberg O. 2008. Ocean acidification causes bleaching and productivity loss in coral reef builders. Proc Nat Acad Sci. 105:17442–17446. doi: 10.1073/pnas.0804478105
- Battershill C, Bergquist P, Ward V. 1984. Marine sponges: forty six sponges of northern New Zealand. Technical report, University of Auckland.
- Bell JJ. 2008. The functional roles of marine sponges. Est Coast Shelf Sci. 79:341–353. doi: 10.1016/j.ecss.2008.05.002
- Bell JJ, McGrath E, Biggerstaff A, Bates T, Cárdenas CA, Bennett H. 2015. Global conservation status of sponges. Cons Biol. 29:42–53. doi: 10.1111/cobi.12447
- Bennett HM, Altenrath C, Woods L, Davy SK, Webster NS, Bell JJ. 2016. Interactive effects of temperature and pCO2 on sponges: from the cradle to the grave. Global Change Biol. 23:2031–2046. doi: 10.1111/gcb.13474
- Bergquist PR. 1968. The marine fauna of New Zealand: Porifera, Demospongiae. Wellington: Department of Scientific and Industrial Research.
- Berman J, Bell JJ. 2010. Spatial variability of sponge assemblages on the Wellington South Coast, New Zealand. Open Mar Biol J. 4:12–25. doi: 10.2174/1874450801004010012
- Caldeira K, Wickett ME. 2005. Ocean model predictions of chemistry changes from carbon dioxide emissions to the atmosphere and ocean. J Geophy Res Oceans. 110(C9):405. doi: 10.1029/2004JC002671
- Cárdenas CA, Bell JJ, Davy SK, Hoggard M, Taylor MW. 2014. Influence of environmental variation on symbiotic bacterial communities of two temperate sponges. FEMS Micro Ecol. 88:516–527. doi: 10.1111/1574-6941.12317
- Cárdenas CA, Davy SK, Bell JJ. 2012. Correlations between algal abundance, environmental variables and sponge distribution patterns on southern hemisphere temperate rocky reefs. Aquat Biol. 16:229–239. doi: 10.3354/ab00449
- Carter L. 2008. The Taputeranga Marine Reserve. Wellington: First Edition Ltd.
- Christen N, Calosi P, McNeill C, Widdicombe S. 2013. Structural and functional vulnerability to elevated pCO2 in marine benthic communities. Mar Biol. 160:2113–2128. doi: 10.1007/s00227-012-2097-0
- Clark D, Lamare M, Barker M. 2009. Response of sea urchin pluteus larvae (Echinodermata: Echinoidea) to reduced seawater pH: a comparison among a tropical, temperate, and a polar species. Mar Biol. 156:1125–1137. doi: 10.1007/s00227-009-1155-8
- Clarke A. 1991. What is cold adaptation and how should we measure it? American Zoologist. 31:81–92. doi: 10.1093/icb/31.1.81
- Collett D. 2003. Modelling survival data in medical research. Bristol: CRC Press.
- Dickson AG, Millero F. 1987. A comparison of the equilibrium constants for the dissociation of carbonic acid in seawater media. Deep Sea Res A. 34:1733–1743. doi: 10.1016/0198-0149(87)90021-5
- Dickson AG, Sabine CL, Christian JR. 2007. Guide to best practices for ocean CO2 measurements. Ocean Data Practices.
- Doropoulos C, Ward S, Diaz Pulido G, Hoegh-Guldberg O, Mumby PJ. 2012. Ocean acidification reduces coral recruitment by disrupting intimate larval algal settlement interactions. Ecol Lett. 15:338–346. doi: 10.1111/j.1461-0248.2012.01743.x
- Duckworth AR, Peterson BJ. 2013. Effects of seawater temperature and pH on the boring rates of the sponge Cliona celata in scallop shells. Mar Biol. 160:27–35. doi: 10.1007/s00227-012-2053-z
- Duckworth AR, West LL, Vansach TT, Stubler AA, Hardt MM. 2012. Effects of water temperature and pH on growth and metabolite biosynthesis of coral reef sponges. Mar Ecol Prog Ser. 462:67–77. doi: 10.3354/meps09853
- Fabricius KE, Langdon C, Uthicke S, Humphrey C, Noonan S, De’ath G, Okazaki R, Muehllehner N, Glas MS, Lough JM. 2011. Losers and winners in coral reefs acclimatized to elevated carbon dioxide concentrations. Nature Climate Change. 1:165–169. doi: 10.1038/nclimate1122
- Fabry VJ, McClintock JB, Mathis JT, Grebmeier JM. 2009. Ocean acidification at high latitudes: the bell weather. Oceanography. 22:160–171. doi: 10.5670/oceanog.2009.105
- Fabry VJ, Seibel BA, Feely RA, Orr JC. 2008. Impacts of ocean acidification on marine fauna and ecosystem processes. ICES J Mar Sci. 65:414–432. doi: 10.1093/icesjms/fsn048
- Fang JK, Mello Athayde MA, Schönberg CH, Kline DI, Hoegh Guldberg O, Dove S. 2013. Sponge biomass and bioerosion rates increase under ocean warming and acidification. Global Change Biol. 19:3581–3591. doi: 10.1111/gcb.12334
- Fang JK, Schönberg CH, Mello Athayde MA, Hoegh Guldberg O, Dove S. 2014. Effects of ocean warming and acidification on the energy budget of an excavating sponge. Global Change Biol. 20:1043–1054. doi: 10.1111/gcb.12369
- Feely RA, Sabine CL, Lee K, Berelson W, Kleypas J, Fabry VJ, Millero FJ. 2004. Impact of anthropogenic CO2 on the CaCO3 system in the oceans. Science. 305(5682):362–366. doi: 10.1126/science.1097329
- Gluckman P. 2013. New Zealand's changing climate and oceans: the impact of human activity and implications for the future. An assessment of the current state of scientific knowledge by the Office of the Chief Science Advisor. Wellington: Office of the Prime Minister's Science Advisory Committee.
- Goodwin C, Rodolfo Metalpa R, Picton B, Hall-Spencer JM. 2014. Effects of ocean acidification on sponge communities. Mar Ecol. 35:41–49. doi: 10.1111/maec.12093
- Hall-Spencer JM, Rodolfo-Metalpa R, Martin S, Ransome E, Fine M, Turner SM, Rowley SJ, Tedesco D, Buia MC. 2008. Volcanic carbon dioxide vents show ecosystem effects of ocean acidification. Nature. 454:96–99. doi: 10.1038/nature07051
- Hoegh-Guldberg O, Mumby P, Hooten A, Steneck R, Greenfield P, Gomez E, Harvell C, Sale P, Edwards A, Caldeira K, et al. 2007. Coral reefs under rapid climate change and ocean acidification. Science. 318:1737–1742. doi: 10.1126/science.1152509
- Hooper J. 1994. Zoological catalogue of Australia, Vol. 12. CSIRO, Canberra, Australia. Chapter Porifera; p. 624.
- IPCC. 2014. IPCC, 2013: Climate Change 2013: The Physical Science Basis. Contribution of Working Group I to the Fifth Assessment Report of the Intergovernmental Panel on Climate Change. Cambridge University Press.
- Jokiel P, Rodgers K, Kuffner I, Andersson A, Cox E, Mackenzie F. 2008. Ocean acidification and calcifying reef organisms: a mesocosm investigation. Coral Reefs. 27:473–483. doi: 10.1007/s00338-008-0380-9
- Kaplan EL, Meier P. 1958. Nonparametric estimation from incomplete observations. J Am Stat Assoc. 53:457–481. doi: 10.1080/01621459.1958.10501452
- Kroeker KJ, Kordas RL, Crim RN, Singh GG. 2010. Meta-analysis reveals negative yet variable effects of ocean acidification on marine organisms. Ecol Lett. 13:1419–1434. doi: 10.1111/j.1461-0248.2010.01518.x
- Lesser MP, Fiore C, Slattery M, Zaneveld J. 2016. Climate change stressors destabilize the microbiome of the Caribbean barrel sponge, Xestospongia muta. J Exp Mar Biol Ecol. 475:11–18. doi: 10.1016/j.jembe.2015.11.004
- Lüthi D, Le Floch M, Bereiter B, Blunier T, Barnola JM, Siegenthaler U, Raynaud D, Jouzel J, Fischer H, Kawamura K, et al. 2008. High-resolution carbon dioxide concentration record 650,000–800,000 years before present. Nature. 453:379–382. doi: 10.1038/nature06949
- McNeil BI, Matear RJ. 2008. Southern Ocean acidification: A tipping point at 450-ppm atmospheric CO2. Proc Nat Acad Sci. 105:18860–18864. doi: 10.1073/pnas.0806318105
- Mehrbach, C, Culberson C, Hawley J, Pytkowicx R. 1973. Measurement of the apparent dissociation constants of carbonic acid in seawater at atmospheric pressure. Limnol Oceanogr. 18:897–907. doi: 10.4319/lo.1973.18.6.0897
- Morrow KM, Bourne DG, Humphrey C, Botté ES, Laffy P, Zaneveld J, Uthicke S, Fabricius KE, Webster NS. 2015. Natural volcanic CO2 seeps reveal future trajectories for host–microbial associations in corals and sponges. ISME J. 9:894–908. doi: 10.1038/ismej.2014.188
- Orr JC, Fabry VJ, Aumont O, Bopp L, Doney SC, Feely RA, Gnanadesikan A, Gruber N, Ishida A, Joos F, et al. 2005. Anthropogenic ocean acidification over the twenty-first century and its impact on calcifying organisms. Nature. 437:681–686. doi: 10.1038/nature04095
- Perea-Blázquez A, Davy SK, Bell JJ, Thrush S. 2012. Estimates of particulate organic carbon flowing from the pelagic environment to the benthos through sponge assemblages. PLoS One. 7(1):e29569. doi: 10.1371/journal.pone.0029569
- Perea-Blázquez A, Davy SK, Magana-Rodríguez B, Bell JJ. 2013. Temporal variation in food utilisation by three species of temperate demosponge. Mar Ecol Prog Ser. 485:91–103. doi: 10.3354/meps10316
- Philp R. 1997. Effects of pH and oxidant stressors (hydrogen peroxide and bleach) on calcium-induced aggregation of cells of the marine sponge Microciona prolifera. Comp Bioch Physiol Part C. 118:347–351.
- Philp R. 1999. Cadmium content of the marine sponge Microciona prolifera, other sponges, water and sediment from the eastern Florida panhandle: possible effects on Microciona cell aggregation and potential roles of low pH and low salinity. Comp Biochem Physiol Part C. 124:41–49. doi: 10.1016/S0305-0491(99)00095-4
- Pörtner HO. 2008. Ecosystem effects of ocean acidification in times of ocean warming: a physiologists view. Mar Ecol Prog Ser. 373:203–217. doi: 10.3354/meps07768
- Robbins L, Hansen M, Kleypas J, Meylan S. 2010. CO2calc: A user friendly seawater carbon calculator for Windows, Mac OS X, and iOS (iPhone). Technical report, US Geological Survey.
- Sabine CL, Feely RA, Gruber N, Key RM, Lee K, Bullister JL, Wanninkhof R, Wong C, Wallace DW, Tilbrook B. 2004. The oceanic sink for anthropogenic CO2. Science. 305:367–371. doi: 10.1126/science.1097403
- Sanford E, Kelly MW. 2011. Local adaptation in marine invertebrates. Ann Rev Mar Sci. 3:509–535. doi: 10.1146/annurev-marine-120709-142756
- Scanes E, Parker LM, O’Connor WA, Ross PM. 2014. Mixed effects of elevated pCO2 on fertilisation, larval and juvenile development and adult responses in the mobile subtidal scallop Mimachlamys asperrima (Lamarck, 1819). PLoS One. 9(4):e93649. doi: 10.1371/journal.pone.0093649
- Steinacher M, Joos F, Frolicher T, Plattner GK, Doney SC. 2009. Imminent ocean acidification in the Arctic projected with the NCAR global coupled carbon cycle climate model. Mar Chem Geochem. 6:515–533.
- Stubler AD, Furman BT, Peterson BJ. 2014. Effects of pCO2 on the interaction between an excavating sponge, Cliona varians, and a hermatypic coral, Porites furcate. Mar Biol. 161:1851–1859. doi: 10.1007/s00227-014-2466-y
- Takahashi T, Sutherland S, Chipman D, Goddard J, Ho C, Newberger T, Sweeney C, Munro D. 2014. Climatological distributions of pH, pCO2, total CO2, alkalinity, and CaCO3 saturation in the global surface ocean, and temporal changes at selected locations. Mar Chem. 164:95–125. doi: 10.1016/j.marchem.2014.06.004
- Taylor MW, Radax R, Steger D, Wagner M. 2007. Sponge-associated microorganisms: evolution, ecology, and biotechnological potential. Micro Mol Biol Rev. 71:295–347. doi: 10.1128/MMBR.00040-06
- Wanninkhof R, Lewis E, Feely RA, Millero FJ. 1999. The optimal carbonate dissociation constants for determining surface water pCO2 from alkalinity and total inorganic carbon. Mar Chem. 65:291–301. doi: 10.1016/S0304-4203(99)00021-3
- Wisshak M, Schönberg CH, Form A, Freiwald A. 2012. Ocean acidification accelerates reef bioerosion. PLoS One. 7(9):e45124. doi: 10.1371/journal.pone.0045124
- Wright JP. 2011. pH control in recirculating aquaculture systems for Paua (Haliotis iris) [master’s thesis]. Victoria University of Wellington.
- Wulff JL. 2006. Ecological interactions of marine sponges. Can J Zoo. 84:146–166. doi: 10.1139/z06-019