
 ?Mathematical formulae have been encoded as MathML and are displayed in this HTML version using MathJax in order to improve their display. Uncheck the box to turn MathJax off. This feature requires Javascript. Click on a formula to zoom.
ABSTRACT
The shelf seas surrounding New Zealand/Aotearoa, a region nominally extending out to the 250 m depth contour, are complex and varied as they sit above the submerged continent of Zealandia. These seas surround the two main islands that span 1,500 km in latitude from 34°S to 47°S and include a series of plateaus that extend far beyond. This review summarises the present state of knowledge of the physical processes that control ocean transport and mixing in this domain. The focus is on documenting recent regional advances in understanding the balance between off-shelf drivers, terrestrially sourced freshwater, winds, tides, stratification and the underlying topography. The review considers outstanding themes such as connectivity, climate and stratification and closes with an assessment of the potential future for understanding the physical marine environment of the shelf seas of the New Zealand region.
Introduction
Shelf seas are typically defined as shallow waters less than 250 m depth. By this definition, shelf seas make up around 9% by area of the world’s oceans (Harris et al. Citation2014) and most maritime economic and societal activity takes place within this zone. New Zealand’s marine domain as defined by its exclusive economic zone (EEZ) overlaps with the drowned continent of Zealandia (Campbell Citation2013), with large submerged plateaus, some areas of which are shallow enough to be defined as shelf seas. Apart from these plateaus, the New Zealand continental shelf is relatively narrow compared to other continental margins (Harris et al. Citation2014). Consequently, New Zealand’s shelf seas encompass a diverse range of environments from shallow river-affected coastal waters through to essentially open-ocean.
Physical oceanographic understanding relates to currents, transport, mixing, dilution and fate and provenance of water masses. Near-shore temperatures and dissolved oxygen levels and other biophysical properties strongly affect coastal ecosystems and marine industries such as aquaculture and fishing. Sediment transport affects water clarity and habitat modification. Transport of introduced species and harmful algal blooms influences how people and industries utilise the near-shore environment.
Here we review the present state of knowledge of the physical oceanography of New Zealand’s continental shelf seas. This is a companion to a review of the advances made in New Zealand’s open ocean (‘blue water’) oceanography over the last three decades (Chiswell et al. Citation2015). Many aspects of New Zealand’s shelf seas described here connect with the offshore processes discussed in the blue water review, while sedimentation is reviewed by Bostock et al. (Citation2018). To maintain focus, the present review mostly does not extend into harbours or estuaries as these varied, idiosyncratic and complex, systems need their own descriptions (aspects of which are reviewed in Hume et al. Citation1992). Neither do we consider swell, wind-waves or tsunami as these occupy a relatively confined section of the energy spectrum and thus also merit their own reviews (Gorman et al. Citation2003; Power et al. Citation2007).
The present focus is primarily on oceanic transport, stratification, energetics, and their drivers, in shelf seas. Thus, one of the challenges of describing these processes is that the scales of variability in the forcing are broad, ranging from regional scale through to those associated with coastal topography, tides and rainfall. At the regional scale, the Zealandia system is fed with Subtropical Water from the north by the East Australia Current and the Tasman Front, which becomes the East Auckland Current (EAUC, ). This merges with highly modified Subtropical Water from the south in flows associated with the Subtropical Front that forms the Southland Current. The Southland Current is the local name for the Subtropical Front as it runs up the New Zealand South Island east coast. The front separates modified Subtropical Water inshore and Subantarctic Water offshore (Sutton Citation2003). While the current is formed by Pacific Ocean regional processes, fluctuations are predominately wind-driven (Chiswell Citation1996). There is also a much smaller contribution directly from the Tasman Sea to the west, although this is relatively weak in terms of energetics (Chiswell et al. Citation2015). Exactly how these currents affect the shelf region varies in both space and time and depends on a confluence of drivers.
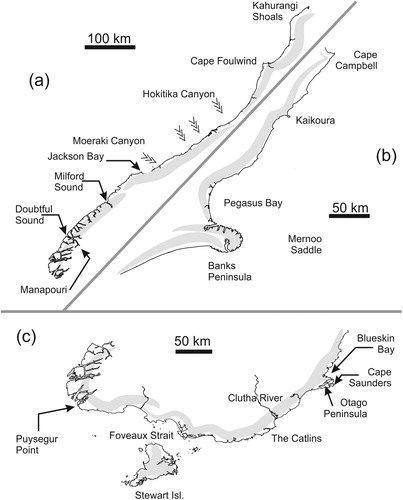
Figure 1. New Zealand/Aotearoa at the shelf seas scale showing coastal currents, plateaus and features including the Tasman Front, East Auckland Current (EAUC), Wairarapa Coastal Current (WCC) and Eddy (WE), Westland (WC) and Southland Currents (SC), Hikurangi Eddy (HE), Mernoo Saddle (MS) and the d’Urville Current (dUC). Regions less than 250 m are shaded and the 500 and 1000 m isobaths are shown.
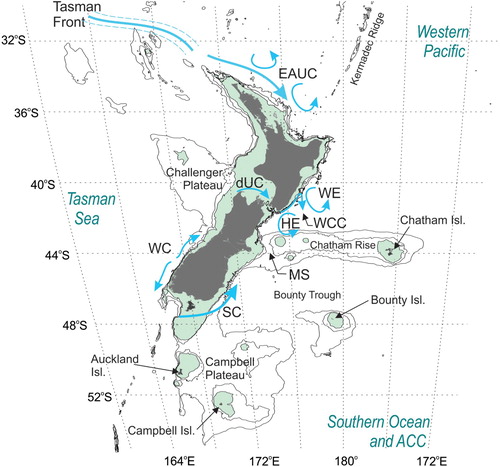
The tides are a key driver of coastal flows at short timescales and are somewhat idiosyncratic around New Zealand as they are dominated by the semidiurnal M2 and N2 tides that rotate anti-cyclonically around the two main islands as Kelvin waves (Stanton et al. Citation2001; Walters et al. Citation2001). This ‘around island’ cycling of the M2 and N2 tides is clearer than in comparable ‘large island’ situations elsewhere in places like Madagascar and Iceland (Bye and Heath Citation1975; Heath Citation1977) and has the particular consequence of amplifying tidal flow through Cook Strait (Raukawa) which separates the two islands ().
New Zealand’s marine wind field, a function of its latitudinal position and topography, is characterised by the land blocking the prevailing westerly winds (Sterl et al. Citation1998; Sturman and Tapper Citation2006). Despite this, the modest area of the land means that primarily maritime conditions prevail (see example wind roses in ). In the ocean, this wind field drives currents and generates mixing, both of which can contribute to upwelling of deeper, cooler, nutrient-rich waters. In addition, wind is often associated with rainfall, especially due to the orographic effects of the New Zealand landmass.
Figure 2. Primary river inflows from the New Zealand New Zealand River Environment Classification scheme (Biggs et al. Citation1990) named, with annual flow rates distributed to represent proportional region of freshwater influence (symbolic RoFI) scale, along with example wind roses from New Plymouth, White Island and Nugget Point. Assuming 10% freshwater distributed over the upper 1 m, the areas are symbolic RoFI filled in c. 20 days.
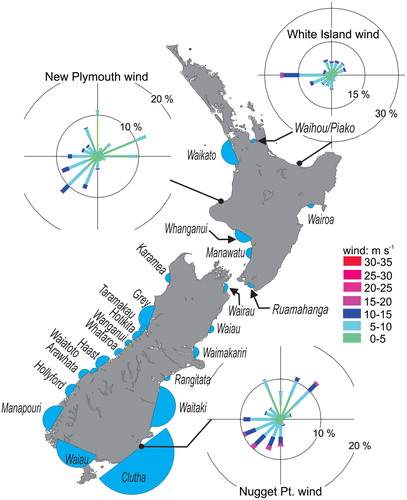
River flows in New Zealand () can be characterised as fast-response and highly variable, with substantial sediment loads (Biggs et al. Citation1990; Zeldis and Swaney Citation2018). This terrestrially-sourced buoyancy is injected into the coastal ocean in river plumes, leading to substantial Regions of Freshwater Influence (RoFI, e.g. O’Callaghan and Stevens Citation2017; O’Callaghan 2018).
The present review frames a region-by-region description of New Zealand’s physical shelf seas ocean science over the past several decades in the context of where this science might lead over the next several decades. This focuses on the upcoming challenges, technological advances and future initiatives.
Northern zone
The East Auckland Current and the Hauraki Gulf
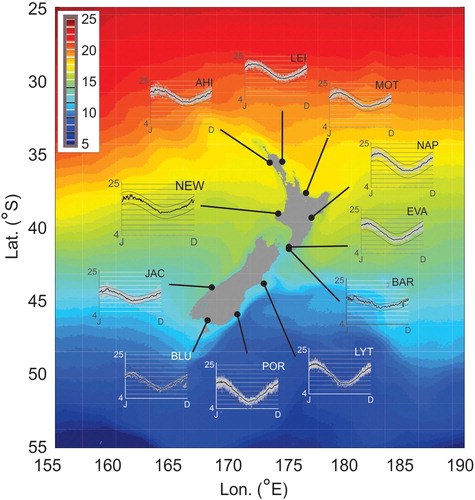
In the north, flows associated with the Tasman Front at latitudes just north of Cape Reinga bring Subtropical Water from the East Australia Current into the New Zealand region. From there the bulk of the Subtropical Water flows down the eastern seaboard of the North Island as the East Auckland Current. The East Auckland Current is a western boundary current with a transport of c. 9 Sv (Roemmich and Sutton Citation1998). The continental shelf along this coast is 20–30 km wide with a number of major island groups. Its currents are strongly influenced by internal tide flows (Sharples et al. Citation2001). Offshore temperatures range from typically c. 15°C in winter to c. 22°C in summer (, also Sutton and Roemmich Citation2001). Depending on location, inshore surface temperatures are highly variable. The long timeseries at Leigh Marine Laboratory observes temperature over the annual cycle ranging from 16.5 to 21.0°C (). Bowen et al. (Citation2017) used an ocean reanalysis to identify the shared impact of atmospheric heat fluxes and oceanic transport of heat in the context of temperature variations at Leigh, whereby the SST around New Zealand is connected to regional processes over a wide area of the South Pacific.
Figure 3. Regional sea surface temperatures (SST, averaged over the period 2003–2015 from MODIS, courtesy Helen MacDonald) and available coastal sea surface temperatures (CSST) shown as annual cycles (grey), with the mean value in thick black line and thin black lines show the ±1 standard deviation. Locations are LEI Leigh Marine Laboratory, MOT Motiti Island Bay of Plenty, NAP Napier, EVA Evans Bay, Wellington Harbour, BAR Baring Head, LYT Lyttleton, POR Portobello Otago Harbour, BLU Bluff, JAC Point Jackson, NEW New Plymouth, and AHI Ahipara. The data record durations vary from station to station.
The short timescales for variability inherent in the internal tide is highly relevant to ocean biological production. Sharples et al. (Citation2001) calculated the onshore internal tide energy flux at the shelf edge just north of this region to be ∼400 W m−1, albeit with considerable variability. This energy was significantly greater than the energy in either the barotropic tide or inertial shear. The dissipation rate of the internal tide was estimated to be 15 ± 10 mW m−2 with an associated vertical eddy diffusivity of (4 ± 3) × 10−4 m2 s−1. Sharples et al. (Citation2001) also suggested an internal-tide enhanced vertical nitrogen flux into the photic zone drives significant subsurface production throughout the summer.
These mixing-driven nutrient fluxes influence primary productivity, which is especially apparent at the Poor Knight Islands marine reserve (). Stevens et al. (Citation2005) used current-metre, temperature, and turbulence observations to show the structure of the internal kinematics and mixing as the internal tide encountered the islands. The propagation speed of the main internal wave was observed to be c. 0.3 m s−1. While the average energy dissipation rate (5 × 10⁻⁸ m2 s−3) was an order of magnitude smaller than that observed on the open shelf, peaks in dissipation rate were measured to be much greater. The corresponding vertical diffusivity of heat was of the order of 10−4 m2 s−1, which agrees with Sharples et al. (Citation2001) estimate away from the islands.
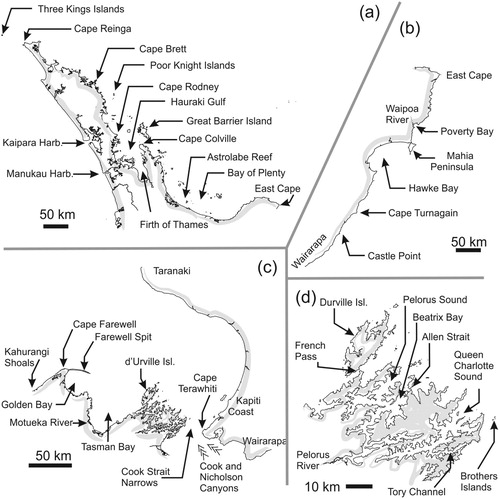
Figure 4. North and central regions as referenced in the text.
Wind-driven processes also impact the north-east shelf dynamics. Sharples (Citation1997) suggested that intrusions of Subtropical Water towards the shelf edge is a general result of (downwelling) south-easterly wind events. Sharples and Greig (Citation1998) determined that curvature in the along-shore flow around Cape Brett (A) could be a significant localised upwelling mechanism so that upwelling might result in the absence of wind. In addition, episodic wind-driven upwelling events drive shelf-slope water up onto the shelf. Sharples and Greig (Citation1998) estimated that such upwelling significantly influences supply of nitrate to the shelf waters between Cape Brett and Hauraki Gulf to the south.
As the East Auckland Current flows down the east coast, it forms the outer boundary to the greater Hauraki Gulf, a complex region of islands and relatively wide shelf (∼60 km), which we defined as the region from the Poor Knights to the Firth of Thames, encompassing Great Barrier Island. The presence of the Auckland urban region, and the region’s considerable recreational and commercial marine activities, has resulted in this region being one the better studied areas of New Zealand’s shelf seas. Early work by Paul (Citation1968) suggests that local factors (wind, rainfall, tides, water depth, and proximity to land) influence sea temperatures in the inner Gulf, whereas oceanic conditions prevail seawards of a line from Cape Rodney to Cape Colville (A).
Identification of localised upwelling has been a feature of a number of studies in this region. Following from Sharples (Citation1997), Zeldis et al. (Citation2004) used current metre data from the outer Hauraki Gulf to separate wind-driven upwelling and downwelling events in the shelf circulation from forcing dominated by longer-period variability of the East Auckland Current. They suggested that the forcing for shelf circulation is largely from local winds. However, far-field effects associated with the EAUC cause shallow (c. 60 m depth) subtropical water intrusions to extend across the shelf/slope boundary in late summer. Extending this, Zeldis et al. (Citation2005) suggest that stronger winds drive more vertical mixing which is correlated with greater mixed-layer primary biomass and productivity. This ecosystem response to wind mixing may partially explain the correlation of sea temperatures with recruitment, previously observed for the Hauraki Gulf snapper stock (Zeldis et al. Citation2005; Zeldis and Willis Citation2015).
Tides are clearly important in the Hauraki Gulf and have been relatively well studied. Bowman and Chiswell (Citation1982) used a two-dimensional numerical model to conclude that the M2 tide approximates a standing wave within the gulf. Later, Proctor and Greig (Citation1989) used a similar model to conclude that tidal residual circulation is weak over most of the gulf, but that oceanic inflows give rise to water movements which can penetrate to the inner part of the gulf. They also suggested that the response of the gulf to wind-forcing is strongest for north-west/south-east directed winds, with the flow through the gulf being more than three times as large as that observed with winds from other directions. Three-dimensional modelling showed that circulation in the region is strongly baroclinic with the primary dynamical balance being between surface wind stress and pressure gradient setup against land (Black et al. Citation2000). This modelling was used to predict ocean conditions for the 2000 and 2003 Americas Cup defences (Vennell et al. Citation2003). In a study examining near-bed processes, Hume et al. (Citation1997) investigated the role of headlands in sand transport. They identified counter-rotating eddies on either side of Cape Rodney which create pronounced current asymmetry in a zone extending around 4 km from the headland.
At the inner bound of the Gulf, Zeldis and Swaney (Citation2018) describes a decade-long multi-parameter coastal ocean dataset, from the 35 m contour in the outer Firth of Thames (A). This is clearly a RoFI system with a number of freshwater inflows. Measurements include dissolved oxygen, temperature and ‘stratification’ (i.e. the buoyancy frequency) as well as currents, nitrogen and zooplankton-counts (). These data enable exploration of questions such as what are the oceanic implications of land-use change (e.g. Carter et al. Citation2010) and how does the inflowing terrestrially-sourced nutrients compare with ocean supply? From a physical perspective, understanding transport throughout the water column is vital. Over the annual cycle, the inner Firth of Thames system is salinity-stratified for up to 4 months of a year (late winter-early spring) which then has implications for oxygen () and hence biology (Zeldis and Swaney Citation2018). Observation in the region (O’Callaghan and Stevens Citation2017) showed that the water column responds to rainfall events 30 km downstream from the freshwater inflow into the Firth with a substantial upper water column offshore flow in winter (). It was apparent that there is residual circulation in the horizontal too as this offshore flow was not manifest on the western side away from the freshwater sources. This type of behaviour and the development of large RoFI and their inherent timescales of variability are key to understanding impacts of oceanic vs. terrestrial stressors on the shelf sea environment. However, it remains a challenge to monitor timeseries of very-near surface (upper two m) data in exposed waters, despite this being heavily influenced by freshwater inflows and mind mixing.
Figure 5. New Zealand’s longest biophysical timeseries that captures sub-surface data. Measurements from the central Firth of Thames (Figure reused from Zeldis and Swaney Citation2018) include dissolved oxygen, temperature and ‘stratification’ (i.e. the buoyancy frequency). Other parameters such as currents, nitrogen and zooplankton counts were also recorded.
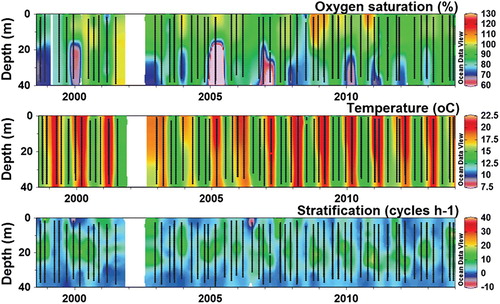
Figure 6. Residual currents from the Hauraki RoFI (O’Callaghan and Stevens Citation2017 – reproduction courtesy of the authors) in the onshore (negative) to offshore (positive) direction for 12-months of ADCP observations (‘y’, thick black line) and for a 38-day period in summer (‘s’, dotted line) and winter (‘w’, thick grey line). Panel (a) is on the eastern margin of the Firth of Thames and closer to the main riverine source, and (b) is on the western side of the region and more exposed to ocean conditions.

Bay of Plenty to Wairarapa
Circulation in the Bay of Plenty (Te Moana a Toi) to Wairarapa region is controlled by the offshore transition of the flows at East Cape (A). East Cape is connected underwater to the Kermadec Ridge and Trough system (). The combination of a sharp turn in the coastline and the bathymetric connection to the ridge forces some of the East Auckland Current to recirculate to the north east and form the East Cape Eddy (Roemmich and Sutton Citation1998). The remainder of the East Auckland Current continues south along the shelf break and becomes known as the East Cape Current.
The attention of the world was focused on the Bay of Plenty in October 2011 when the MV Rena ran aground on the Astrolabe Reef, 22 km from the entrance of Tauranga Harbour, releasing c. 350 tonnes of oil into the marine environment. This was well within the ∼50 km wide continental shelf region in the bay (). There have been few studies of the regional transport in the area, an issue that affected the response to the Rena incident and the ability to describe boundary conditions for any modelling. The outer flows off the shelf are associated with three permanent warm core eddies (Roemmich and Sutton Citation1998). Ridgway and Greig (Citation1986) suggested the mean flow of water through the Bay of Plenty is from west to east, based on six days of drifter sampling, and that it is part of the East Auckland Current. Longdill et al. (Citation2008) considered the circulation in the central Bay of Plenty to be highly responsive to wind events and that, as a consequence, the circulation is quite variable. This is supported by Chiswell and Sutton (Citation2015) who examined ocean drifter trajectories in the region and observed that, of the hundreds of Global Drifter Program drifters to have passed by New Zealand in the last few decades, only one has entered the northern reaches of the bay, and it travelled to the northwest (Stevens et al. Citation2014) – i.e. in the opposite direction to the mean flow identified by Ridgway and Greig (Citation1986), which is entirely possible due to natural variability.
Figure 7. Lagrangian realisations associated with the MV RENA grounding showing observed surface drifter tracks in conjunction with drifter simulations (Mark Hadfield, unpubl.). The observed data run from 24 Oct 2011 to 31 Oct 2011 although one drifter stopped transmitting after only two days. The 1248 simulated drifters were all released at the same location (the Rena wreck site), at an interval of 30 min, for 26 days. The darker symbols are for earlier released drifters.
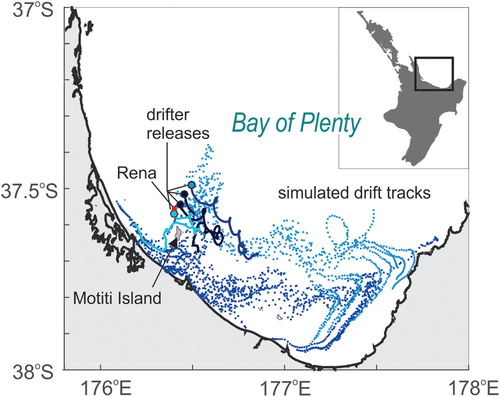
Forecast simulations of the dispersal of oil during the MV Rena grounding (Jones et al. Citation2016) presented numerical estimates of how wind and near-shore processes such as wind, tides and seabed roughness affect the fate of floating material. Their emphasis was on the near-field and identified that the modelling struggled with some of the flow interactions near shore which are heavily influenced by wind. Studies of the impacts of other oils spills, such as the Deep-Water Horizon spill, have identified the need to examine timescales of many months for suspended or dissolved oil settlement or dispersal (Smith et al. Citation2014). The drifter deployments at the time compared favourably with Regional Ocean Modelling System simulations (). In the case of the Rena, one expects material to work its way from the wreck site around East Cape. This transport is controlled by the East Auckland Current and the stationary eddies it sustains.
Flow around the cape itself was explored with a year-long mooring array described in Chiswell and Roemmich (Citation1998). They found the expected southward flow off the shelf, but a mid-water current metre mooring positioned at the 200 m contour found a counter current heading north-east that on occasion reached 0.3 m s−1. They identified substantial volume transport far larger than that observed in the East Auckland current, implying substantial entrainment. Turning south from East Cape, Stephens et al. (Citation2006) calculated dispersal distributions for larvae based on inner shelf (‘inner’ defined here as being where ocean waves begin to shoal) mechanics including wave shoaling and larval behaviour. The results were influenced by the embayment configurations. Stephens et al. (Citation2001), in a study of Poverty Bay/Turanganui a Kiwa (B), showed that despite a wide entrance to the continental shelf, circulation in the Bay was found to be insensitive to shelf currents. Instead, the Waipaoa River freshwater discharge dominates the stratification (despite not being in the top 20 rivers described in ). The associated pressure and density gradients drive an anti-cyclonic gyre in the bay. The hydrodynamic processes influence where sediment ultimately settles from a range of scales from short (event-seasonal, e.g. Moriarty et al. Citation2015) to long (annual and beyond, e.g. Carter et al. Citation2010) times. Bever et al. (Citation2011) attributed consistently shoreward near-bed currents along the 10 m isobath of Poverty Bay to a combination of estuarine circulation, Stokes drift, and wind driven upwelling. The resulting circulation redistributes sediment from the river source, much of it finding its way to submarine canyons running offshore (Alexander et al. Citation2010).
Moving south, circulation in Hawke Bay is very poorly documented. The offshore currents likely to impact the circulation in Hawke Bay are the southward flowing East Cape Current in the northeast, and the mostly northward-flowing Wairarapa Coastal Current (WCC) lying to the south. Ridgway (Citation1960) noted that drift card trajectories indicate strong central flow of water into the bay diverging to move north and south parallel with the shore. Ridgway and Stanton (Citation1969) analysed temperature and salinity observations to suggest water in the bay was cooler and less saline than the shelf water on the open coast to the south. Their hydrological analysis indicates that the main inflow is westward along the approximate centre line of the bay. These results are similar to those of Francis (Citation1985) who described the surface circulation in Hawke Bay as consisting of two cells defined by an inflow along the midline of the bay and outflows at either end. Heath (Citation1985) suggests that this circulation pattern is consistent with the biological distributions detailed by Bradford et al. (Citation1980). However, these results are at odds with the more recent results of Chiswell (Citation2002) who used near-shore temperature data to suggest southern Hawke Bay circulation is likely impacted by the Wairarapa Coastal Current, and that alongshore advection accounts for most of the temperature variability at the Napier shore.
The Wairarapa Coastal Current was historically considered an extension of a so-called Canterbury Current originating locally and flowing along the Canterbury coast of the South Island. However, Chiswell (Citation2000) suggested that the water along the Wairarapa Coast is modified Subtropical Water with sources likely to be the Southland and d’Urville currents, and proposed the current be renamed the Wairarapa Coastal Current. Volume transports within the WCC in February 1998 were about 1.6 Sv off Cape Palliser, diminishing northwards as the current becomes entrained into the East Cape Current. The Wairarapa Coastal Current is consistently found only south of Mahia Peninsula (B; Chiswell Citation2005).
Evidence of the implications of this flow structure is seen in Chang et al. (Citation2001) who documented massive mortality of marine life around central New Zealand during January and March 1998 and attributed this to the toxic dinoflagellate, Karenia brevisulcata. Reports of human respiratory distress attributed to this dinoflagellate progressed northwards along the Wairarapa Coast at about the same speed (0.23 m s−1) as observed for the Wairarapa Coastal Current, suggesting the current advected the bloom along the coast. Such blooms and other non-indigenous marine species are likely to be introduced into harbours by ballast water discharge or hull fouling, and then spread by natural means in the nearshore/shelf circulation. Hence, there is a clear need to understand the connectivity between New Zealand harbours. Chiswell and Rickard (Citation2011) used a numerical model to compute dispersal kernels for New Zealand harbours as a function of the duration larval competence. The simulations provide plausible outcomes, but they also identify the lack of data with which to quantify confidence in the results.
West coast North Island
The shelf seas oceanography on the west coast of the North Island is generally far less well known than for the east coast. Cape Reinga (A) acts as a separating divide between the coasts. South of the cape on the western seaboard, a large tidal range and sequence of large harbours combines with weak and inconsistent currents. The continental shelf along this coast varies from c. 10 km width in the north to c. 100 km width around the Taranaki region (C), with no substantial canyons or other indentations for the whole length of the segment.
While the Tasman Front attaches to the east coast to form the East Auckland Current, it contributes little flow along the west coast, and with strong tides in the region, prevailing wisdom was that the Cape Reinga to Three Kings Islands (60 km offshore, A) region is dominated by these tides, strong horizontal shear, and substantial mixing of different water masses. Stanton’s (Citation1973) exploratory voyage mapped water mass and structure around Cape Reinga and found the region is impacted by prominent upwelling in the 60 km gap between the Three Kings Islands and Cape Reinga, and also identified a predominantly north-westward coastal current off the west coast, opposite in direction to the previously described West Auckland Current (Heath, Citation1982).
After Stanton’s (Citation1973) voyage, the theme of NE Tasman Sea circulation wasn’t returned to until Sutton and Bowen (Citation2011) deployed a cross-shelf array of current metres to the north of Kaipara Harbour (A). While these were all deployed offshore of the 350 m isobath, the data were augmented with a near-shore timeseries. The flow closer to shore was a north-westward flow driven by the wind ‘in a complex manner’. Offshore the flow was in the opposite direction and driven by larger scale pressure gradients.
Circulation on the west coast of the North Island is considered weak and variable. Apart from some early studies conducted as part of the offshore Taranaki gas/oil exploration (Bowman et al. Citation1983a), and internal tide observations off Taranaki by Stanton (Citation1977), very little published work has been focused to the northwest of Cook Strait. A similar situation exists for Challenger Plateau. Whilst strictly not shallow enough to be regarded as a shelf sea, this region is typically influenced by bottom mixing and has direct impact on regional coastal circulation by guiding large-scale ocean currents. Challenger Plateau is around 300,000 km2 and, while smaller than the other two major shoals that form part of the submerged Zealandia (Campbell Plateau and Chatham Rise), it certainly influences dynamics in the region over long timescales and so has downstream implications for climate and ecosystems (Sutton et al. Citation2005).
Further south of the Challenger region, an extensive body of work from the mid-1970s onwards was spawned by natural gas extraction development. A sequence of pioneering campaigns, combining observation and models, considered impacts of development of gas fields in the Taranaki region at the Maui drill area. This work provided the first observations in the region of tidal fronts, stratification and water mass structure (Bowman et al. Citation1983a, Citation1983b, Citation1983c) and showed how this region sustained stratification and frontal structures despite the often strong wind- and tidal forcing.
Central zone
Greater Cook Strait and the d’Urville current
Cook Strait connects the eastern Tasman Sea to the western Pacific Ocean. At its narrowest it is 22 km across, with 210 and 350 m average and maximum depths, respectively (C). Around 15,000 years ago with lower sea levels than present day, a land-bridge blocked the strait to the west of the narrows so that the Taranaki Bight was a large bay (Proctor and Carter Citation1989). Increasing sea levels gradually opened the strait so that the regional circulation formed a complex balance between the d’Urville current flowing from the west, mixing with the southward extension of a ‘Wairarapa Eddy’ (Barnes Citation1985). These combined eddy structures were re-named by Chiswell (Citation2005) so that the Wairapapa Eddy referred to the eddy to the north east which likely spawns the more southerly Hikurangi Eddy ().
Making measurements in fast flows like that of the Cook Strait narrows, and the associated canyons, is difficult. Single-point current metres in deep fast flowing water get ‘knocked down’ making it a challenge to reliably determine currents. Prior to the availability of acoustic Doppler current profilers (ADCP) there had been a number of attempts to quantify the flow dynamics in the Cook Strait narrows region – including cross-strait cable electricity potential, aerial tracking of surface dye, ship measurements and bottom mounted current metres (Olsson Citation1955; Gilmour Citation1960; Heath Citation1971, Citation1986; Harris Citation1990). The most notable conclusion from these early studies was that the semidiurnal tide is around 140° out of phase along the Strait (Heath Citation1978; Vennell Citation1994, Citation1998). This phase difference, along with the constricted nature of the location, contributes to the substantial flows that reach as high as 3.4 m s−1 (Vennell and Collins Citation1991; Stevens et al. Citation2012). As a consequence, regions of the strait have been the focus for marine energy developers (Stevens et al. Citation2012). Importantly, the hydraulic flow regime of the strait is dominated by the temporal acceleration (Vennell Citation1998), whereby the flow responds mainly to the constricted nature of the strait.
By far the fastest flows in Cook Strait are tidal (Walters et al. Citation2010), but there has been some focus on residual currents and net transport in the strait of relevance to nutrient transport and early life stages of many marine taxa (e.g. Forrest et al. Citation2009). This work started with Heath’s (Citation1986) study using rotor-based current metres. While the consensus of many studies is that there is a net flow to the south (Heath Citation1986), a two-year ADCP current metre deployment that commenced in 2010 revealed the estimated net flow through the strait was somewhat less than previous estimates (Stevens Citation2014). Additionally, it identified wind-driven northward residual flows on the western side of the strait. Remarkably, on occasion the Southland Current (see later) penetrates sufficiently far north to contribute to the waters in this region (Shaw and Vennell Citation2000). Sea surface temperature (SST) images from the region show that a variety of transverse SST structures across the narrows are possible, with a general trend of cold water moving northward on the western side of the strait and conversely a warm flow moving south on the eastern side (Stevens, Citation2014). While it has been suggested that the strait is well mixed (Walters et al. Citation2010) there is ample evidence that it is not (Bowman et al. Citation1983a, Citation1983b; Stevens et al. Citation2012; Stevens Citation2014, Citation2018). The stratification is strongest in summer, by as much as 3°C variation in the vertical. However, there has been no systematic study looking at how baroclinic processes manifest themselves in the strait.
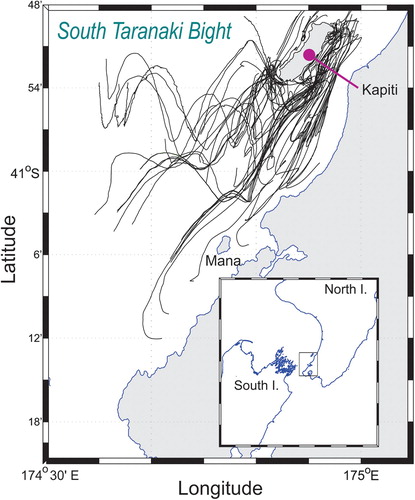
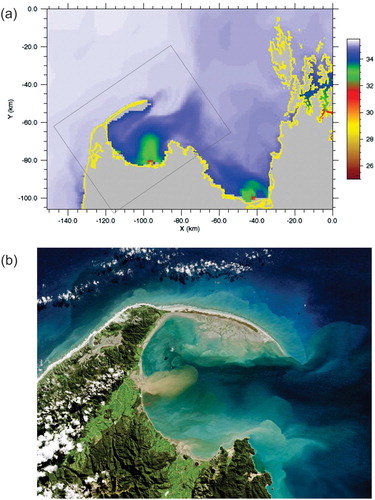
Cool plumes of nutrient-rich upwelled water have been known to originate near the Kahurangi Shoals (C) on the west coast of the South Island (Stanton and Moore Citation1992, see also section below on West Coast South Island). These plumes are then carried by the d’Urville Current into Greater Cook Strait (GCS). Mechanistic understanding of upwelling has evolved, with Bowman et al. (Citation1983c) suggesting that it is caused mainly by bottom Ekman pumping. However, Shirtcliffe et al. (Citation1990) suggested this upwelling depends on the intermittent northern extent of the Westland Current and is intensified by an onshore wind that induces a fall in sea level that accelerates the flow of the deep water inshore of the Kahurangi Shoals. The hydraulic response of the thermocline, coupled with a coastal convergence of the bottom Ekman flow, produce strong upwelling in the region. In a combined numerical and remotely sensed observational study following up from this, Chiswell et al. (Citation2017), determined that the cool water is generated by wind-driven upwelling near the Kahurangi Shoals. This occurs throughout the year, but its surface signature is only visible in summer months (). The d’Urville Current crosses Western Cook Strait and then turns south to flow down the Kapiti Coast (C) and then through the Cook Strait Narrows. This flow of nutrient rich, recently upwelled, water supports increased primary production (Foster and Battaerd Citation1985). However, the passage taken by the upwelled water is complex as it flows across towards the Kapiti Coast. Drifter studies of larval transport the lee of Kapiti Island (Chiswell and Stevens Citation2010) show how the island generates substantial eddy structure that oscillates with the tide ().
Figure 8. MODIS chl-a image for central New Zealand (date acquired 23rd Feb. 2016) with reds and yellows are high chlorophyll estimates. The white areas are cloud-affected.
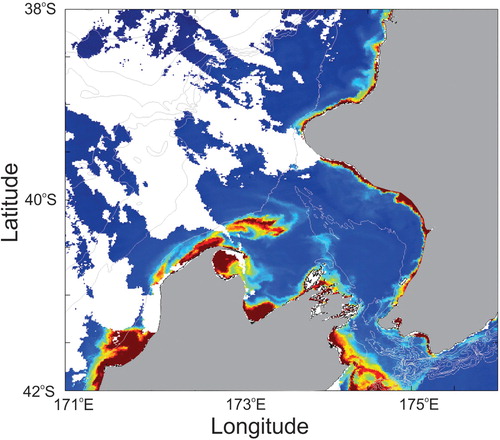
Figure 9. Observed surface drifter tracks in the lee of Kapiti Island compiled from a number of experiments, each lasting around 36 h. (modified from Chiswell and Stevens Citation2010).
To the east of the narrows (C) lies a canyon system containing the Nicholson and Cook Strait Canyons (Mountjoy et al. Citation2014). An unusual feature of these canyons is that, instead of running into a coast-line, they have strong tidal flows and mixing at their head. One of the few comparable systems globally is the Strait of Juan de Fuca off Washington State, which experiences tides sufficiently strong as to influence ocean mixing that then affects how coastal circulation processes influence the canyon running off to the abyss (Allen and Durrieu de Madron Citation2009; Alford and MacCready Citation2014).
Golden/Tasman Bay
Tasman and Golden Bays are a conjoined embayment around 70 × 90 km in scale between Farewell Spit in the north-west and the Marlborough Sounds, French Pass/Te Aumiti and d’Urville Island to the east (D, ). The bays shoal gradually with a mean depth of c. 40 m. The circulation in the region is driven by the regional scale transport associated with the d’Urville Current moving the east north of Farewell Spit, in conjunction with the strongly semidiurnal tides which generate tidal ranges of nearly 3 m peak-peak. Stratification is heavily influenced by several river plumes (Cornelisen et al. Citation2011). As well as the riverine influence on stratification and circulation, there are anthropogenic effects also, whereby the drag and water column mixing induced by large aquaculture installations in the south and west influence circulation (Plew et al. Citation2005).
Figure 10. (A) salinity simulation snapshot from Tasman/Golden Bay (7 June 2010; Mark Hadfield, unpublished) and (B) satellite visual imagery from Golden Bay (12 May 2016, USGS/NASA Landsat) with the domain shown in panel (A). While the timing and primary river flows are different, the similarities in freshwater and sediment dispersal are apparent.
Nutrient supply in the bay is a balance of river-borne and oceanic sources and so strongly influenced by physical processes (Zeldis and Swaney Citation2018). While in a bulk sense this balance is in favour of oceanic supply (in terms of nitrogen), it is crucial to understand the circulation to determine how this supply is distributed (). The general circulation in the bays has been inferred from a number of approaches including observation (Heath Citation1976a) and modelling (Tuckey et al. Citation2006), suggesting a largely clockwise gyre circulation with some coastal counter-currents. However, given the importance of wind in shallow water and the presence of substantial and episodic stratification, this general conclusion should be treated cautiously. Remarkably, despite being small, French Pass/Te Aumiti in the northeast corner of Tasman Bay (D) provides a localised, but potentially important, boundary condition to the east as Tuckey et al. (Citation2006) found they needed to include the transport through the Pass in order to generate reliable numerical flow simulations in the pair of bays.
Marlborough Sounds
The Marlborough Sounds are a pair of South Island drowned river valley systems that open onto Cook Strait, with Pelorus Sound (Te Hoiere) to the west and Queen Charlotte Sound (Tōtaranui) to the east (D). They are of economic and transport importance, sustaining aquaculture and farming activity as well as being the hub for interisland ferry traffic. While both sounds open into Cook Strait they are otherwise separate, and apart from the local topographic complexities, quite different to one another. Queen Charlotte Sound has little fresh water supply, less farming activity, heavy ferry traffic and is closer to the eastern side of Cook Strait. Pelorus Sound is substantially larger, with the Pelorus River at its headwaters, substantial terrestrial farming activity and opens into central Cook Strait to the west of the narrows. The freshwater flux from the Pelorus River generates relatively strong stratification after large rainfall events (Heath Citation1976b; Proctor and Hadfield Citation1998; Stevens and Smith Citation2016). Recently Stevens (Citation2014) suggested that the oceanic source waters for the sounds might at times come from the east rather than from the west (Zeldis et al. Citation2013). Long-term transport in the Sounds is primarily controlled by stratification (Sutton and Hadfield Citation1997). Carter (Citation1976) observed fresh water spreading initially via the tidally-mixed Hikapu Reach (Stevens and Smith Citation2016) through Pelorus Sound at ∼0.9 m s−1. Heath (Citation1974) estimated the flushing time of Pelorus Sound to be 21 days.
The wind fields are very complex due to the mountainous terrain surrounding the Sounds. Contrastingly, the high sediment loading means that in many places the bathymetry is flat-bottomed, being filled with mud. Currents in the main channels are strongly tidal, but this degenerates in the embayments where headland eddies create complex eddy fields. Such eddy fields are a ubiquitous feature of these drowned river valleys with strong tidal flows along a central channel having many embayments on each side. Stevens (Citation2010) described a parameter looking at the spacing of these embayment headlands relative to tidal excursions to determine the relative scale of the eddy structure that results. This proves important for determining sufficient resolution in numerical treatments of circulation (Plew Citation2011).
While tidal elevation range in the region is relatively low, there are several smaller tidal streams of some consequence. French Pass/Te Aumiti is a narrow gap between the mainland South Island and d’Urville Island and while 500 m across, the main navigation channel is only 100 m wide, with a 20 m deep sill. Spring tide currents exceed 4 m s−1, but only in the throat of the pass (Stevens et al. Citation2008). The observations identified surface eddies using drifters, however these were unable to follow the strong vertical velocities of up to 0.6 m s−1 generated downstream of the narrows (measured by vessel-mounted ADCP). As noted earlier, this complex mixing environment has a bearing on a regional scale as it was shown to influence circulation in the neighbouring Tasman Bay (Tuckey et al. Citation2006).
Further east, Tory Channel connects Cook Strait to Queen Charlotte Sound. The channel is 16.8 km in length, has an average width of 1.1 km, and average depth in the channel (excluding side arms) is around 40 m. The tides in Tory Channel are complicated by the northern side of the channel being an island (Arapawa) so that there are two connections for the headwaters of Queen Charlotte Sound to Cook Strait. Velocity surveys revealed the spring tide flow speeds exceeded 2 m s−1 which forms a substantial jet into Cook Strait during the ebb tide (Plew and Stevens Citation2013).
Karori Rip is a local name given to the strong tidal flow on the eastern shores of the narrowest point in Cook Strait (Stevens et al. Citation2012). The region between the southwest tip of the North Island (Cape Terawhiti) and Sinclair Head in the east is characterised by strong flows and associated wave-current interaction whereby wind against tide generates highly localised region of steep, large amplitude waves. The ferry S.S. Penguin sank off the Thoms ridge area in 1909, a victim of a storm and possibly unusual currents (Collins Citation2000). Vennell (Citation1994) reported ADCP measurements recorded offshore of the rip area (180 m water depth) with measured speeds up to 3 m s−1 some 1.5 h after slack water. An ADCP mooring recorded spring tide flows of 3.4 m s−1 in the same region (Stevens et al. Citation2012). For a time, both Tory Channel Entrance (D) and Karori Rip (south of Cape Terawhiti, C) have been of interest to marine renewable energy development although no test deployments have taken place at the time of writing. Several other notable tidal streams or constrictions in the region remain to be surveyed. These include the 3 km wide, 150 m deep, Brothers Islands inside passage and the 300 m wide Allen Strait in the outer Marlborough Sounds (D).
Other than limited work motivated by marine energy exploration, shellfish aquaculture has driven much of the oceanographic research in the region (Gibbs et al. Citation1991; Plew Citation2011). The aquaculture usage in the area is evolving from shellfish to include fish-cage farming activity. This motivates further biophysical questions, particularly around ambient oxygen and temperature levels, waste deposition effects and the pathways for waterborne parasites (e.g. Salama and Rabe Citation2013). A number of studies have examined biological carrying capacity and how it is affected by stratification and mixing which influence vertical diffusion, primarily using Beatrix Bay in Pelorus Sound as a focal region (Sutton and Hadfield Citation1997; Nikora et al. Citation2002; Stevens Citation2003). These studies indicate that, in order to assess long term ecological impacts, both the rate of turbulent transfer of material, and the effect of the internal tides penetrating into the sound, need to be better-defined as these influence nutrient availabilities for the crop.
Southern zone
West coast South Island
The continental shelf width along the west coast of the South Island compresses from around 30 km in the north, to literally a few metres off the fiords south of Jackson Bay (A). Anecdotal information (Heath Citation1973) suggests there is a separation at Jackson Bay whereby flow is northward in the north. with the reverse being true to the south. Recent survey work with underway ADCP suggests this distinction does not always hold (O’Callaghan pers. comm 2017). A sequence of submarine canyon features drains the central shelf region of the South Island including Hokitika and Moeraki canyons (A). From the land-side, the West Coast South Island shelf is influenced by freshwater from large river discharges with impacts observed out to ∼100 km from the coast (Stanton Citation1976). While there is an initial enhancement of primary productivity from these intrusions (so-called ‘squirts’ in the terminology of the day). This is possibly related to the advection of buoyant coastal water offshore which enhances vertical stratification and stability of the water column (Moore and Murdoch Citation1993). Thus, the inner-shelf dynamics in the West Coast South Island region is a balance between upwelling, ‘coastal ejection ephemera’ and along-shelf propagation of Coastal Trapped Waves. The presence of the Moeraki canyon (A) to the south interrupts along-shore advection but provides an onshore pathway for oxygen ventilation and sediment transport (Radford Citation2012). Internal tide contributions investigated by Vennell and Moore (Citation1993) indicated that the semi-diurnal tide barotropic and baroclinic tidal amplitudes were 0.10 and 0.06 m s−1, respectively.
Figure 11. South Island regions as mentioned in the text.
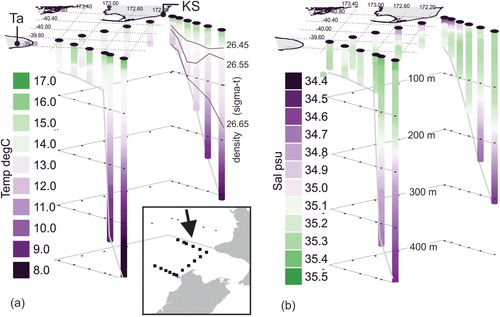
In a 1985 review, Heath discussed the promise of new observations from the West Coast South Island that would identify the mechanisms driving transport in a region of New Zealand that had ‘hopefully less complex circulation’. However, the Tasman Boundary experiment (TASBEX) suggested that the West Coast South Island is an inherently highly variable system and anything but straight-forward. The two TASBEX voyages, separated by a year, saw opposing net transport directions in their geostrophic velocities inferred from scalar structure (). They concluded that Tasman Sea water drifts eastward towards the West Coast South Island region, and bifurcates into the Southland and Westland Currents between 42° and 44°S (Heath Citation1982). The latter current is driven by the prevailing southwest winds and has weak mean flow speeds around 0.05 m s−1. Alongshore variability is dominated by subtidal flows with speeds up to 0.3 m s−1. The TASBEX I voyage in 1986 identified a northward jet close to shore (Stanton and Moore Citation1992) which feeds the biophysical processes seen in the western part of greater Cook Strait (Chiswell et al. Citation2017). Wind is the primary forcing mechanism of this variability and appears to trigger low-mode coastal trapped waves (Cahill et al. Citation1991).
Figure 12. (A) Temperature and (B) salinity structure from the central west coast as captured in November of 1986 during TASBEX I (after Stanton and Moore Citation1992) with a view looking towards the south-east (see lower inset). These are the Wekakura and Maui lines from TASBEX (Stanton and Moore Citation1992). The vertical marker bars are at 100 m intervals and panel (A) shows example density contours for the sigma-t lines at 26.45, 26.55 and 26.55 kg m−3. Location markers are included for Taranaki (Ta, C) and Kahurangi Shoals (KS, C).
Upwelling is spatially and temporally sporadic along the West Coast South Island. It is intensified at Cape Foulwind (A) as shown by higher primary production there (Chang et al. Citation1995). Greig et al. (Citation1988) found that at Farewell Spit, coastal SST was usually cooler than offshore SST, supporting the view that upwelling is persistent in the Cape Farewell region and not solely tied to wind forcing. However, an evaluation of data from 14 cruises to the region north of Jackson Head (A) between 1969 and 1984 showed that upwelling was only present half of the time (Shirtcliffe et al. Citation1990). Heath and Gilmour (Citation1987) suggest that non-tidal flow around Kahurangi Shoals is strongly correlated with local alongshore wind, and that these winds induce an offshore cold saline nutrient-rich plume. This supports the later conclusions of Chiswell et al. (Citation2017) regarding the source of nutrients in Greater Cook Strait (see earlier). Away from Cape Farewell, coastal trapped waves were also identified to play a role in enhancing upwelling and may explain higher biological productivity in the absence of ‘upwelling-favourable winds’ (Chang et al. Citation1992; Moore and Murdoch Citation1993).
Fiordland
The group of fourteen main fjords on the south-west coast of New Zealand constitute Fiordland (A). Curiously, in terms of semantics, most of the fjords are labelled as ‘sounds’ with several considered to be ‘inlets’. Critically, most of the fiords have some form of sill near their entrance. The region is characterised by episodic strong winds from the Tasman Sea and rainfall in excess of 5 m yr−1 (e.g. Haase Citation1990). The northern fjords are exposed to higher freshwater inputs (rainfall of ∼ 7 m yr−1) due their proximity to the Southern Alps. These systems are almost uninhabited and poorly documented in terms of oceanography when compared to their counterparts in Norway, Canada, and Chile (Howe et al. Citation2010). Early descriptions showed that a surface low salinity layer less than 10 m thick is a ubiquitous feature of the fjords, although there is a latitudinal correlation with horizontal stratification, with weaker gradients between the head and mouth of the fjord in the southern fjords (Stanton & Pickard Citation1980; Stanton Citation1984). Four fjords (Milford, George, Thompson and Preservation Inlet) were intensively sampled for winter-time conditions (Stanton Citation1986). Deep water renewal of the fjord basins below sill depths was linked to the arrival of offshore dense water and mixing. Intermittent stagnation was seen in Milford Sound with dissolved oxygen reduced to 37% of saturation during autumn (Stanton Citation1984).
Doubtful Sound/Patea is unusual for a fjord in that it sustains a large, engineered freshwater influx at its head. This is sourced from the Lake Manapouri hydroelectric scheme which has been operating since 1971. Vertical profiles of water column stratification show a low salinity layer typically between 3 and 5 m thick, followed by a strong halocline and then mostly uniform oceanic water to the bottom (Gibbs Citation2001). The low salinity layer in Doubtful Sound is a permanent feature and so controls near-surface mixing and estuarine transport. In addition, the buoyant and highly turbulent (McPherson Citation2018) tailrace inflows in Doubtful Sound represent twice the freshwater input of natural runoff (Bowman et al. Citation1999; Goodwin and Cornelisen Citation2012).
Gibbs et al. (Citation2000) and Gibbs (Citation2001) explored the relative roles of wind and rainfall in Doubtful Sound, and found both forcing mechanisms were necessary to mix the low salinity layer down to depths of 10 m. In the upper reaches of the fjord, surface wind stress not only promotes vertical mixing but also advects surface waters horizontally, resulting in pressure gradient generated setup at the head of the fjord. In the case of winds directed towards the fjord head, when the wind stress weakens, the previously setup large volume of freshwater is released and moves seaward. This can take as much as five days to exit the fjord (Jiang et al. Citation2015).
The hydroelectric generator produces a tailrace flow into Deep Cove, at the head of Doubtful Sound, provides a natural laboratory to understand the role of turbulence and inflow variability in controlling buoyant plume evolution. Idealised numerical simulations found that advection was 30% greater for plumes forced with momentum than by buoyancy alone (O’Callaghan et al. Citation2010). Furthermore, the very initial outflow is highly turbulent with energy dissipation rates well above ‘normal’ coastal ocean levels (McPherson Citation2018). A mode-one baroclinic wave is present at interface at the base of the pycnocline (O’Callaghan and Stevens Citation2015). The substantial freshwater supply finds its way out into the coastal ocean. So much so that, despite the strong wind stirring from southerly storms, remnants of low salinity water persist for up to 50 km offshore from the mouth of Doubtful Sound. Despite the obvious local effect of the Manapouri Tailrace on near-field water properties, near-surface temperature similarities between Doubtful and Milford Sounds indicate a coherence in forcing which is dominated by meteorological processes (wind mixing, frontal activity and seasonality), rather than tailrace input (Goodwin and Cornelisen Citation2012).
Foveaux Strait to Banks Peninsula, South Island
Foveaux Strait (Te Ara a Kewa), the passage between the South Island and Stewart Island/Rakiura, is about 25–30 km wide (C) which is a little wider than Cook Strait. It is relatively shallow, being as little as 20 m deep in some places, and also contains a number of islands. Tidal currents can reach 1.2 m s−1 with faster speeds in the channels between islands (Cullen Citation1967; Cranfield Citation1968). Despite being an early focus for sediment mapping (Bostock et al. Citation2018), and in contrast to Cook Strait, the physical oceanography is essentially un-explored with any physical consideration being primarily on the oceanic influences on oyster fisheries and impact of the associated dredging on the local system. An exception to this was the work of Butler et al. (Citation1992) who recorded an autumn hydrographic transect cutting east–west through the strait which encountered everything from Subantarctic through Subtropical waters, as well as a clear influence of terrestrial runoff.
The continental shelf extends south east from Stewart Island/Rakiura in the form of the Campbell Plateau. Some of the area is <250 m depth so qualifying as a ‘shelf sea’ despite being in the open ocean – a consequence of the Zealandia structure. Several small island groups dot the plateau including Campbell and Auckland Islands and the Bounty Islands to the northeast (). While there has been substantial research emphasis on the Antarctic Circumpolar Current circulating the plateau (Chiswell et al. Citation2015), there has been little oceanographic focus up on the plateau itself. Smith et al. (Citation2013) described hydrographic transects to show how the fronts adjust as they encounter the shallow plateau region. Forcén-Vázquez (Citation2015) determined that the water on the plateau itself is largely isolated from the substantial regional currents moving past (Southland to the north and the Antarctic Circumpolar Current to the south). She then deployed Argo floats (s/n 8436 and 8437) on the plateau which remained largely in place by parking in the muddy seabed in between profiles.
Moving to the north-east along the coast of the South Island, the continental shelf along this coast is mostly less than 30 km wide although it is almost non-existent along the Catlins coast. The headland salients of Otago and Banks Peninsulas (B,C) are the most obvious features, although the shelf is partly incised by a number of small submarine canyons from due east of the Catlins, up to the southern Canterbury zone (around 45°S latitude) known as the Otago fan complex (Orpin Citation1997).
The Southland Current dominates the offshore environment between the mainland and the plateau along most of the east coast of the South Island (). With predominantly south-westerly winds, the east coast of the South Island is regarded as generally a downwelling coast, although during northerly winds there may be a cessation of downwelling, or even upwelling. It is clear that the Otago Peninsula impacts the flow of the Southland Current in the region. To the north of the Otago Harbour entrance, simulations (Murdoch et al. Citation1990) indicate that asymmetric tidal flow around the peninsula induces a counter-clockwise eddy within Blueskin Bay just to the north of Otago Harbour (C). This eddy is enhanced under moderate and steady north-easterly winds but is broken down by strong south-west winds. Southland Current water was observed over the outer shelf at the surface but near the bottom penetrated inshore to at least the middle of the shelf region. There is substantial variability in both high-salinity and low-salinity waters around the peninsula (Hawke Citation1989, Citation1992) through the influence of the Clutha River RoFI (). At a local scale, an ebb tidal jet is formed at the entrance to the Otago Harbour (Old and Vennell Citation2001; Cohen Citation2012). The formation of a propagating eddy observed along the eastern side of the jet suggests that this momentum pulse may be associated with the pair of separation eddies generated by the accelerating ebb tidal flow. To the south, around Cape Saunders on the Otago Peninsula (C), Russell and Vennell (Citation2017) determined that the northeast-ward flowing Southland Current is generally stronger than tidal flows. A highly localised region of secondary flow approximately 1500 m long and 800 m wide is observed downstream of the Cape. This creates coastal eddies that can enhance local upwelling.
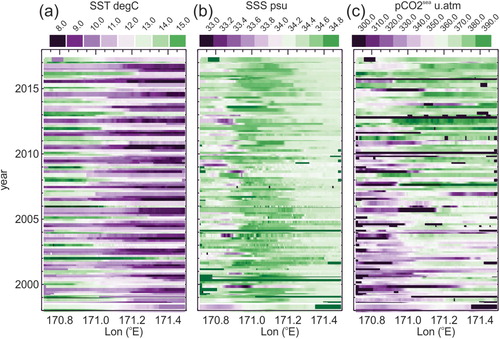
The region is characterised by the most substantial biophysical dataset in New Zealand waters, at least in terms of duration. The ‘Munida transect’, a regular sampling voyage established off Otago Harbour in 1998 (Currie et al. Citation2011) and named after the original vessel used. Designed to extend into subtropical waters, this 60 km long transect measures primarily surface properties such as sea surface temperature, salinity and pCO2 (). It clearly crosses the Southland Current front at around 171.1° E where there is a surface maximum in salinity. While temperature and salinity maintain a reasonable annual cycle, pCO2 exhibits a regime-shift around 2012 with an increase through the transect yet the water mass structure remains unchanged highlighting the need for on-going monitoring in key locations.
Figure 13. Longitude-time Hovmöller diagrams for surface coastal structure recorded on the Munida transect line running offshore from Dunedin showing (A) sea surface temperature (SST), (B) sea surface salinity and (C) partial pressure of CO2 gas in seawater , (see Currie et al. Citation2011, data available from N.Z. Ocean Data Network nzodn.nz).
The Chatham Rise and Banks Peninsula to Cook Strait, South Island
The Chatham Islands lie 800 km east of Banks Peninsula connected by the Chatham Rise (). While mostly >250 m in depth, this topographic feature provides a boundary between subtropical and subantarctic waters which results in high marine productivity and a vigorous fishery (Nodder et al. Citation2016). Stanton (Citation1997) tested the idea that the SST at the Chatham Islands (Wharekauri) is controlled by meridional movements in the subtropical front – but found little evidence to support this, instead suggesting that SST anomalies were correlated with local meridional (north–south) wind stress. The numerical analysis of Hadfield et al. (Citation2007) indicated the connection of flows around the islands with phenomena closer to New Zealand such as the Wairarapa eddy (Chiswell Citation2001) and how the Chatham Rise separates water masses. In addition, analyses of surface drift from the Global Drifter Program showed a net eastward transport on both north and south flanks of the rise (Hadfield et al. Citation2007). Although the surface mixed layer is typically significantly shallower than the water depth over the Rise (∼450 m), it is clear that the topography has an effect on the surface flows with Sutton (Citation2001) identifying intertwining water masses and substantial tilted temperature and salinity structure making up the frontal structure.
At the western end of the Chatham Rise lies Banks Peninsula (B), a headland around a group of extinct volcanic craters. In a demonstration of the power of modest technology, four drift bottles, cast adrift in the mid-Tasman Sea south of the STF in November 1980, all landed within 123 days of release at a short stretch of coast north of Banks Peninsula. Jenks et al. (Citation1982) comment that these show a ‘high degree of coherence’ in the flow, suggesting relatively low horizontal eddy diffusivity in the subtropical front. While interesting, this probably says more about making generalisations based on small amounts of data than the oceanography itself. More recently, Reynolds-Fleming and Fleming (Citation2005) used an ADCP record to demonstrate that low frequency variability in the flow around Banks Peninsula is strongly correlated with wind in the offshore direction and explains 20–40% of the variability.
The wide shelf of Pegasus Bay north of Banks Peninsula (B) supports a submarine canyon running away to the east. The southward flow events of the Southland Current, lasting 10–12 days, reported by Greig and Gilmour (Citation1992) coincide with the influx of warm water at the surface within 5 km of the coast near Kaikoura, and they suggest that this influx of warm water is due to eddies arriving from the south of the Wairarapa Eddy. As above, the nature of the partitioning of Subantarctic and Subtropical waters is important for biological productivity. Shaw and Vennell (Citation2000) suggest that Subantarctic waters extends north through the western edge of the 580 m deep Mernoo Saddle () for most of the year, however in winter and early spring a southward extension of subtropical front appears in the region.
Moving north along the South Island coast, the combined Kaikoura Peninsula and Canyon create a key demarcation point. The canyon starts within a km of shore before running 60 km offshore to a depth of over 1 km (Lewis and Barnes Citation1999). This provides a pathway for productivity-enhancing nutrients in the Kaikoura region (Reid et al. Citation2011). There is at least one documented case of northerly winds inducing upwelling off Kaikoura (Heath Citation1972), and such upwelling is often associated with high productivity in the region (e.g. Childerhouse et al. Citation1995). However, not all instances of cooler inshore temperatures in the region are due to upwelling. Heath (Citation1970) attributed one instance of a rapid decrease in SST to an increase in the strength of the downwelling-favourable Southland Current. Along this coast, wind-driven advection of the coastal current and upwelling have opposite effects on temperature, and Chiswell and Schiel (Citation2001) used this to demonstrate that SST temperature variability is determined by along-shore advection, whereas deeper temperature variability is determined principally by upwelling.
The 2016 M7.8 Kaikoura earthquake had a dramatic effect on the intertidal region along a substantial portion of the coast with uplift of 1–3 m in places (Bai et al. Citation2017). As well as the resulting tsunami and destruction of intertidal populations, it modified the sea floor topography. The vertical displacement, while devastating in the short term, is modest compared to overall water depths in the region and comparable to the tidal elevation. It became apparent however, that there were substantial sedimentary changes, with large turbidity currents draining offshore. Typically, the mechanics of such events can only be studied well after the fact, and so any depositional signature is heavily modified. However, the immediacy of the 2016 Kaikoura event provides greater knowledge of the drivers and more immediate access to the impact of these landslides (Mountjoy and Micallef Citation2018).
Discussion
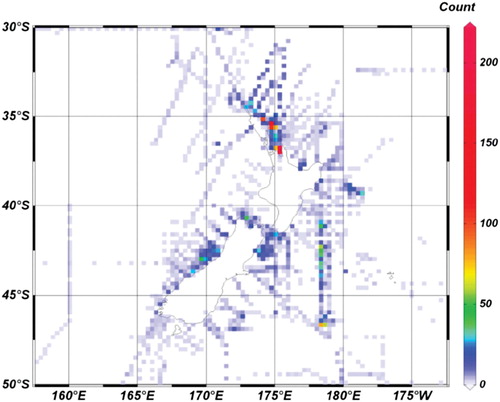
A key point that emerges from a review such as this is the paucity of data in the New Zealand region relative to many other ‘developed’ shelf sea regions. Given the very small tax-payer to EEZ area ratio this is unsurprising. A survey of public-good funded CTD hydrographic profiles sorted into 1/4° bins () reveals the relative sampling dominance of the Hauraki coast and north-east shelf. This survey of CTD profile density is up until the time prior to the start of regular ocean glider missions at which point the numbers change dramatically in the glider transect areas. The Chatham Rise is the next most sampled region, followed by Kaikoura and the West Coast South Island. Socio-economic imperatives tend to influence which aspects of New Zealand’s shelf seas are better known. Thus, proximity to Auckland explains the dominance of the Hauraki region. The Taranaki region is a focal point for maritime fossil fuel extraction and more recently it has been the focus for submarine sand mining. Beyond this, understanding West Coast South Island dynamics is motivated by the need to understand the marine environment (and its variability) of the Hoki fishery (Bradford-Grieve and Livingston Citation2011). The fiords, despite (or rather, because of) their inaccessibility, are a focal point for tourism – as is the submarine canyon extending off shore from Kaikoura. The Marlborough Sounds, Stewart Island and the Firth of Thames support the majority of the nation’s aquaculture activity. Cook Strait experiences substantial marine vessel transport, and is crossed by the nation’s key electricity conduit, as well as having potential for electricity generation (Vennell Citation2012).
Figure 14. Numbers of CTD profiles recorded in the New Zealand EEZ in 0.25° data bins, up until 2015 (courtesy M. Walkington).
Outstanding themes
Often research in a particular region is motivated from a single viewpoint as framed by the socio-economic drivers described above. Hence, while the location might be well-represented in the literature and available data, there may be little diversity in the scales and processes considered. Furthermore, there is an interaction between when an area was studied and what mechanics were at the forefront of oceanography at that time. Consequently, one finds local understanding of coastal trapped waves, tidal idiosyncrasies, upwelling, frontogenesis, vertical mixing and so forth highly connected with particular regions and authors. For example, coastal trapped waves have been explored on the west coast but not the east.
Critically, over the past century, science in general in New Zealand has operated at a scale whereby particular themes would dominate as university groups self-replicated. Physical oceanography, being very expensive, was almost exclusively the domain of (quasi)-government laboratories and so not a great producer of new graduates (Thompson Citation1994). As a consequence, the field evolved in a conservative fashion in terms of human capacity (i.e. not training dramatically more graduate students than it would likely employ). After many academic generations, the field of marine science in New Zealand had evolved into a particular disciplinary configuration (Stevens and O’Callaghan Citation2015). This then informed the structure of the present generation of research programmes which are multi-disciplinary and multi-institutional but framed around disciplines that evolved at the greatest rate within Universities in the 1980s and 1990s – essentially marine ecology.
If we take the archived refereed literature as not only an end in itself, but also a record of what is achieved by science, provides some insight into the demographic distribution of work through time. While this reflects the biases and awareness of the present authors, points that standout are the steady international interest in New Zealand waters, the modest contribution from independent research agencies and the significant contribution from University authors given the distribution of resources and infrastructure. In addition, around one third of the publications are associated with just seven lead authors. While this is a large proportion of the nation’s physical oceanographers, it also suggests a limit to diversity of ideas and viewpoints. Notably also, over 80 of the publications in the reference list come from the New Zealand Journal of Marine and Freshwater Research, highlighting the role played by regional journals in archiving knowledge of regional importance.
Table 1. Chronologic and institutional distribution of lead authors referenced (except where clearly not New Zealand or marine-focused) showing Crown Research Institute/Division of Scientific and Industrial Research authors (Thompson Citation1994), Independent science agencies, Universities and Offshore (combined University and Institutional).
The geographic survey structure of this review makes it clear how relatively poorly we understand the eastern Tasman Sea. It is typically assumed that it either controls, or affects, ‘upstream’ conditions for New Zealand coastal waters with aspects like the Challenger Plateau, the separation point of eastward flow on the South Island West Coast and the mean coastal flow on the west coast north island being poorly defined. The 2017/18 marine heatwave may prove to be a defining example of how the eastern Tasman Sea affects New Zealand climate (Behrens et al. Citation2018; Perkins-Kirkpatrick et al. Citation2018). This focus on responses rather than drivers might be argued to exist because emphasis has been on immediate ‘stakeholder needs’ that have more often been on the east coast. It is not clear that this is true, because for much of the last two decades, climate processes drove most of the oceanographic questions and besides there are substantial fisheries interests off the West Coast. Beyond this clear regional data deficit, there are thematic areas that need more recognition.
Stratification – Historically, physical oceanography was explored off-shelf and, at best, provided a boundary condition for the shelf seas. The inner shelf work was left primarily to marine ecologists (connectivity, stressors) or engineers (sediment transport, hazards). This interest in tidal timescales and short-time transport resulted in research foci that marginalised an essential element of the ocean – water column stratification. Two-dimensional modelling studies inadequately reflect long-time shelf seas processes, whereas, in reality, these are dominated by baroclinicity. This directly connects to understanding the scale and nature of the various river plume/RoFI systems around the country. As illustrated by O’Callaghan and Stevens (Citation2017), these river plume layers, while visible from space, can be constrained to the upper few metres of the water column and modify residual flows for up to a month following high discharges lasting several days.
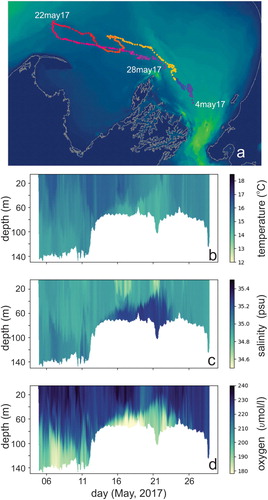
Our ability to observe stratification in shelf sea regions is being expanded as ocean gliders provide relatively inexpensive autonomous biophysical profiling platforms (). The first ocean glider deployments in New Zealand waters commenced in 2015. These tools open new avenues of understanding of what is controlling processes in shelf seas as well as the ability to sample very near the ocean surface (O’Callaghan 2018). This approach complements space-borne instruments whereby the availability of satellite data from the late 1970/80s enabled ready identification of coastal upwelling. Offshore or alongshore winds push surface waters away from the coasts, resulting in replacement by cooler, nutrient rich waters (Zeldis et al. Citation2004). While this general idea is useful, not all cold water appearing at the ocean surface against a coast is driven by direct wind-driven upwelling. Other processes can act to drive this effect also, such as flow-topography interactions, and remote forcing effects such as coastal-trapped waves (Bowen et al. Citation2017).
Figure 15. Ocean glider data from May 2017 in the Western Greater Cook Strait region showing (A) track over 24-day period, (B) temperature, (C) salinity and (D) dissolved oxygen (O'Callaghan, unpublished data).
Connectivity – There is a great deal of immediate utility for end-users in developing descriptions of physical transport connectivity (i.e. ‘drifter tracks’) be they from physical drifter experiments (e.g. ) or numerical simulations (). Use of such results needs to be mindful of several challenges that are not necessarily always recognised. In the real world, surface drifters are exactly that, they are held at the surface and so cannot be sub-ducted, nor can they be ‘mixed down’. Numerical approaches typically provide the most accessible and affordable solution. However, numerical models are often overly-dispersive (Chiswell Citation2009), poorly evaluated (usually due to lack of observational data) and models of the regional scale circulation cannot be made with sufficient resolution to reliably simulate shelf processes, so these problems often require complicated nesting.
Changing climate – This is impacting New Zealand in a number of ways (Stevens and O’Callaghan Citation2015). Being maritime, several of these pathways are via ocean impacts like sea level rise, marine heat waves and modifications to ocean ecosystems driven by changing temperature, currents and acidification (Law et al. Citation2017; Coleman et al. Citation2017). Tropical cyclone activity is another impact with strong oceanic drivers that will change with climate (Godoi et al. Citation2018). Notably however, changing climate was not a focus of the biophysical work conducted in Phase I of the Sustainable Seas National Science Challenge, a government initiative (2014–2025) described as driving marine science and how it affects New Zealanders. This is despite it playing a lead role in social science elements of the initiative (e.g. Davies et al. Citation2018).
Shears and Bowen (Citation2017) indicate that ocean warming in New Zealand will not be a straight-forward ‘tropicalisation’, but instead it will be regional and complicated as winds evolve also. Bell and Goring (Citation1998) investigated seasonal variations in sea level and sea surface temperature (SST) for the north-east coast of the North Island, finding that the annual cycle in sea level is dominated by thermosteric adjustment, and that these thermosteric adjustments almost completely mask the inverted-barometer effect at annual and longer timescales. Goring and Bell (Citation1999) found a significant relationship between sea level and the Southern Oscillation Index. However, the relationship is highly variable, both in magnitude and in the range of time-scales over which it occurs. An interdecadal response in sea level around northern New Zealand appears to coincide with shifts in the Pacific Decadal Oscillation. This slow increase in sea level will interact with higher frequency effects. For example, Goring (Citation1995) found an oceanic response to barometric pressure at higher frequencies 1 to 9 h−1, leading to the conclusion that to a large extent variation in sea level is caused by waves propagating into the area. At slightly longer periods, coastal edge waves with periods of a few hours were seen to be caused by non-linear interaction between semidiurnal tides and meteorological effects along the Canterbury Coast (Goring and Henry Citation1998).
This research thread requires the maintenance of time series infrastructure. However, there has been very little development of this critical data thread in New Zealand – other than shorelines temperatures () there is only the Firth of Thames dataset () which is heavily land-influenced and so not representative of oceanic conditions or change. It is important to understand how this deficit might best be resolved because it is expensive to maintain such facilities as even shore-accessible stations recording sea level rise or temperature can prove to be difficult to resource. Nevertheless, given that satellite observations are primarily surficial, it is vital that sub-surface hydrography be captured, and sampling infrastructure be maintained.
Future prospects
Future perspectives for New Zealand’s shelf seas will involve (i) a changing climate, (ii) advancing technology and (iii) evolving societal demands on the marine space (Stevens and O’Callaghan Citation2015). While many of the points made by Chiswell et al. (Citation2015) in regard of future developments in New Zealand blue-water oceanography hold true for shelf seas, there are some differences. There is a marginally better baseline in-shore for quantifying multi-decadal climate-driven changes in shelf seas as there are a number of multi-decade-long temperature data sets available (Shears and Bowen Citation2017). Furthermore, with the greater presence of economic activity, there will likely be stronger drivers for predictive tools (deBurgh-Day et al. Citation2018) and associated understanding. Of course, these tools need reliable observations in order to gain confidence in their predictions. Furthermore, the required predictions stretch far wider than physical properties – ocean science is moving towards biogeochemical and ecosystem model forecasts that use reliable physics as its basis to have any chance of being useful.
Lane and Walters (Citation2009) document a New Zealand ocean forecasting system that, while not a full ocean model forecast, provides near real-time predictions of storm surge and sea level height from tides. Simulation tools are advancing so rapidly there is little point documenting them in a review other than to make this point. But always the boundary conditions have been a limiting constraint on anything beyond short-term (i.e. longer than say two times the dominant tidal period, so 24 hrs) simulations. The future in shelf seas modelling is developing in five directions simultaneously as they (i) connect to larger, global-scale simulation results, improving regional boundary conditions, (ii) move to incorporate smaller scales to support localised forcing and prediction requirements (i.e. embayment scale e.g. Popinet and Rickard Citation2007), (iii) high-skill forecast periods are being extended (de Burgh-Day et al. Citation2018), (iv) more observations are being assimilated (Edwards et al. Citation2015) and (v) biogeochemical aspects are included with improving confidence.
Improved data availability benefits all interests by providing (i) directly observed information to be utilised in end-user developed ways and (ii) enhancing model predictions. Technology and precedents around coastal and blue water Ocean Observing Systems (OOS; O’Callaghan et al. Citation2019) are expanding internationally with leading examples in Liverpool Bay, the Strait of Georgia, the Australian east coast and the New Jersey coast (Liu et al. Citation2015). Such facilities include the regular deployment of ocean gliders and often merge this with coastal radar which can observe ocean surface currents over a swath up to around 100 km off shore. These data streams are then parsed and redistributed (Proctor et al. Citation2010). However, regular, consistent ocean physics observations are not low-cost, nor is it something that New Zealand has historically invested in to any significant degree. Vessel operations, typically among the larger science expenditure items for any country, is complex in shelf seas. Inner shelf work can be conducted from small vessels whereas the further out onto the shelf a project extends, it essentially becomes open-ocean work requiring significant vessel resources. Increased vessel and compliance costs world-wide are placing more and more emphasis on remote sensed and remote operated data acquisition. Coastal altimetry is one such advance (e.g. Jebri et al. Citation2017) that can provide long-term perspectives on transport and variability. These remote approaches typically do not provide sub-surface information. Mindful that one of the signature advances in marine observation in the last two decades, the Argo programme, does not operate in shelf seas because of depth limitations, alternative approaches need to be found. One approach is to park Argo floats so that instead of drifting during their 10-day duty cycle they sit of the sea floor. Deployments on the Campbell Plateau have demonstrated this (Forcén-Vázquez Citation2017). Alternately, ocean gliders can be deployed in such a way as to provide a virtual mooring. For this expansion in data acquisition to have impact it needs to be accompanied by data openness (New Zealand GOAL Citation2014; Chiswell et al. Citation2015). However, data ownership pressures likely grow in coastal waters with greater diversity of commercial interests – issues that extend beyond the ocean community.
Speaking generally, New Zealand science, has made relative substantial advances in placing science in cultural contexts mainly through its Vision Mātauranga programme (Broughton et al. Citation2015). Thus, while the Sustainable Seas National Science Challenge may not have had a strong focus on climate, it has sought to connect science with a diverse arrangement of stakeholders including marine industries and Māori (Davies et al. Citation2018). One of the key steps in building such steps is a shared language (Whaanga et al. Citation2018). Beyond language, users of the marine domain, be they commercial or recreational, drive demand for enhanced data – if it has some degree of reliability or other demonstrable utility. This will range from real-time data streams from coastal ocean observatories through to asking quite specific and likely demanding questions of forecast tools. Process science is under pressure as expectations increase for results that can be delivered with large spatio-temporal coverage. It will be important to remain mindful that improved prediction timescales will require better sub-grid scale understanding and parametrisation. There can be differences in expectations of peer review science and operational oceanography/data delivery. The tension will remain between easy to access, cheap, generalised information and harder to access, more expensive, but ultimately more instructive data.
This review spans science that used messages in a bottle and hand-calculations through to autonomous robots, satellites and simulations of the entire global ocean at hourly timesteps. Now we have entered the Anthropocene, climate drivers are increasing the level of interest in changing shelf seas and their utilisation. One thing Chiswell et al. (Citation2015) probably overestimated is where it suggested the next review of ocean processes around New Zealand would be 30 years hence. The rate of technological development and demand for information are such that the next watershed in understanding will need to be much sooner.
Acknowledgements
The work is indebted to the technical experts who collected the bulk of the observational data – Brett Grant, Malcolm Greig, Bill Main, Matt Walkington, John Hunt, Fiona Elliot, Mike Brewer, Craig Stewart, Phil Wiles and Andy Falconer. We thank Graham Rickard, Helen MacDonald, Philip Sutton, Helen Bostock, Kim Currie, John Zeldis, Khushboo Jhugroo, Denise Fernandez, Natalie Robinson and Perrine de Leseleuc for their input and assistance. The authors wish to also thank three anonymous reviewers for their comments on a previous version of the manuscript. The review was funded by the New Zealand Ministry for Business, Innovation and Employment (MBIE) supported Sustainable Seas National Science Challenge (4.2.2), and the National Institute of Water and Atmospheric Research (NIWA) Coasts and Oceans Flows and Productivity Programme. Landsat imagery courtesy of NASA Goddard Space Flight Center and U.S. Geological Survey and meteorological data are courtesy of the New Zealand MetService. River flow data come from the N.Z. Ministry for the Environment River Environment Classification Scheme. Aspects of the Discussion were synthesised from the 2017 Physical Oceanography Workshop held in Wellington.
Disclosure statement
No potential conflict of interest was reported by the authors.
Additional information
Funding
References
- Alexander CR, Walsh JP, Orpin AR. 2010. Modern sediment dispersal and accumulation on the outer poverty continental margin. Marine Geology. 270(1):213–226.
- Alford MH, MacCready P. 2014. Flow and mixing in Juan de Fuca canyon, Washington. Geophysical Research Letters. 41(5):1608–1615.
- Allen SE, Durrieu de Madron X. 2009. A review of the role of submarine canyons in deep-ocean exchange with the shelf. Ocean Science. 5(4):607–620.
- Barnes EJ. 1985. Eastern Cook Strait region circulation inferred from satellite-derived, sea-surface, temperature data. New Zealand Journal of Marine and Freshwater Research. 19:405–411.
- Bai Y, Lay T, Cheung KF, Ye L. 2017. Two regions of seafloor deformation generated the tsunami for the 13 November 2016, Kaikoura, New Zealand earthquake. Geophysical Research Letters. 44(13):6597–6606. doi:10.1002/2017GL073717.
- Behrens E, Fernandez D, Sutton P. 2018. Marine heat waves in the Tasman Sea are affected by meridional heat transport on interannual to decadal timescales, in review.
- Bell RG, Goring DG. 1998. Seasonal variability of sea level and sea-surface temperature on the north-east coast of New Zealand. Estuarine, Coastal and Shelf Science. 46(2):307–318.
- Bever AJ, McNinch JE, Harris CK. 2011. Hydrodynamics and sediment-transport in the nearshore of Poverty Bay, New Zealand: observations of nearshore sediment segregation and oceanic storms. Continental Shelf Research. 31(6):507–526.
- Biggs BJ, Duncan MJ, Jowett IG, Quinn JM, Hickey CW, Davies-Colley RJ, Close ME. 1990. Ecological characterisation, classification, and modelling of New Zealand rivers: an introduction and synthesis. New Zealand Journal of Marine and Freshwater Research. 24:277–304. doi:10.1080/00288330.1990.9516426.
- Black KP, Bell RG, Oldman JW, Carter GS, Hume TM. 2000. Features of 3-dimensional barotropic and baroclinic circulation in the Hauraki Gulf, New Zealand. New Zealand Journal of Marine and Freshwater Research. 34(1):1–28.
- Bostock H, Jenkins C, Mackay K, Carter L, Nodder S, Orpin A, Pallentin A, Wysoczanski R. 2018. Distribution of surficial sediments in the ocean around New Zealand/Aotearoa. Part B: continental shelf. New Zealand Journal of Geology and Geophysics. 62:24–45. doi:10.1080/00288306.2018.1523199.
- Bowen M, Markham J, Sutton P, Zhang X, Wu Q, Shears N, Fernandez D. 2017. Interannual variability of sea surface temperature in the southwest Pacific and the role of ocean dynamics. Journal of Climate. 30(18):7481–7492.
- Bowman MJ, Chiswell SM. 1982. Numerical tidal simulations within the Hauraki Gulf, New Zealand. In: Nihoul JCJ, editor. Hydrodynamics of semi-enclosed seas. Amsterdam: Elsevier Scientific; p. 349–384.
- Bowman MJ, Dietrich DE, Mladenov P. 1999. Predictions of circulation and mixing in doubtful sound, arising from variations in runoff and discharge from the Manapouri power station. In: Mooers CNK, editor. Coastal ocean prediction, coastal and estuarine studies. Washington (DC): American Geophysical Union; p. 59–76.
- Bowman MJ, Kibblewhite AC, Chiswell SM, Murtagh R. 1983a. Shelf fronts and tidal stirring in greater Cook Strait, New Zealand. Oceanologica Acta. 6(2):119–129.
- Bowman MJ, Kibblewhite AC, Murtagh R, Chiswell SM, Sanderson BG. 1983b. Circulation and mixing in greater Cook Strait, New Zealand. Oceanologica Acta. 6(4):383–391.
- Bowman MJ, Lapennas PP, Murtagh R, Chiswell SM, Foster B, Battaerd W, Wilkinson V. 1983c. Coastal upwelling, cyclogenesis and squid fishing near Cape Farewell, New Zealand. In: Gade H, editor. Coastal oceanography. New York (NY): Plenum; p. 279–310.
- Bradford JM, Ridgway NM, Robertson DA, Stanton B. 1980. Hydrology, plankton and nutrients in Hawke Bay, September 1976 15. 28 p.
- Bradford-Grieve JM, Livingston M. 2011. Spawing fisheries and the productivity of the marine environment off the west coast of the South Island, New Zealand. New Zealand Aquatic Environment and Biodiversity Report No 84.
- Broughton D, Te Aitanga-a-Hauiti T, Porou N, McBreen K, Waitaha KM, Tahu N. 2015. Mātauranga Māori, tino rangatiratanga and the future of New Zealand science. Journal of the Royal Society of New Zealand. 45(2):83–88.
- Butler ECV, Butt JA, Lindstrom EJ, Teldesley PC, Pickmere S, Vincent WF. 1992. Oceanography of the subtropical convergence zone around southern New Zealand. New Zealand Journal of Marine and Freshwater Research. 26(2):131–154.
- Bye JAT, Heath RA. 1975. The New Zealand semi-diurnal tide. Journal of Marine Research. 33(3):423–442.
- Cahill ML, Middleton JH, Stanton BR. 1991. Coastal-trapped waves on the west coast of South Island, New Zealand. Journal of Physical Oceanography. 21(4):541–557.
- Campbell H. 2013. The Zealandia drowning debate: did New Zealand sink beneath the waves? Wellington (NZ): Bridget Williams Books.
- Carter L. 1976. Seston transport and deposition in Pelorus Sound, South Island, New Zealand. New Zealand Journal of Marine and Freshwater Research. 10(2):263–282.
- Carter L, Orpin AR, Kuehl SA. 2010. From mountain source to ocean sink – the passage of sediment across an active margin, Waipaoa sedimentary system, New Zealand. Marine Geology. 270(1–4):1–10.
- Chang FH, Chiswell SM, Uddstrom MJ. 2001. Occurrence and distribution of Karenia brevisulcata (Dinophyceae) during the 1998 summer toxic outbreaks on the central east coast of New Zealand. Phycologia. 40(3):215–221.
- Chang FH, Bradford-Grieve JM, Vincent WF, Woods PH. 1995. Nitrogen uptake by the summer size-fractionated phytoplankton assemblages in the Westland, New Zealand, upwelling system. New Zealand Journal of Marine and Freshwater Research. 29(2):147–161.
- Chang FH, Vincent WF, Woods PH. 1992. Nitrogen utilisation by size-fractionated phytoplankton assemblages associated with an upwelling event off Westland, New Zealand. New Zealand Journal of Marine and Freshwater Research. 26(3–4):287–301.
- Childerhouse SJ, Dawson SM, Slooten E. 1995. Abundance and seasonal residence of sperm whales at Kaikoura, New Zealand. Canadian Journal of Zoology. 73(4):723–731.
- Chiswell SM. 1996. Variability in the southland current, New Zealand. New Zealand Journal of Marine and Freshwater Research. 30(1):1–17.
- Chiswell SM. 2000. Tidal energetics over the Chatham Rise, New Zealand. Journal of Physical Oceanography. 30(9):2452–2460.
- Chiswell SM. 2001. Eddy energetics in the Subtropical front over the Chatham Rise, New Zealand. New Zealand Journal of Marine and Freshwater Research. 35(1):1–15.
- Chiswell SM. 2002. Wairarapa coastal Current influence on sea surface temperature in Hawke Bay, New Zealand. New Zealand Journal of Marine and Freshwater Research. 36:267–279.
- Chiswell SM. 2005. Mean and variability in the Wairarapa and Hikurangi eddies, New Zealand. New Zealand Journal of Marine and Freshwater Research. 39(1):121–134.
- Chiswell SM. 2009. Colonisation and connectivity by intertidal limpets among New Zealand, Chatham and Sub-Antarctic Islands. II. Oceanographic connections. Marine Ecology Progress Series. 388:121–135.
- Chiswell SM, Bostock HC, Sutton PJ, Williams MJ. 2015. Physical oceanography of the deep seas around New Zealand: a review. New Zealand Journal of Marine and Freshwater Research. 49(2):286–317.
- Chiswell SM, Schiel DR. 2001. Influence of along-shore advection and upwelling on coastal temperature at Kaikoura Peninsula, New Zealand. New Zealand Journal of Marine and Freshwater Research. 35:307–317.
- Chiswell SM, Rickard GJ. 2011. Larval connectivity of harbours via ocean currents: a New Zealand study. Continental Shelf Research. 31(10):1057–1074.
- Chiswell SM, Roemmich D. 1998. The East Cape Current and two eddies: a mechanism for larval retention? New Zealand Journal of Marine and Freshwater Research. 32(3):385–397.
- Chiswell SM, Stevens C. 2010. Lagrangian and Eulerian estimates of circulation in the lee of Kapiti Island, New Zealand. Continental Shelf Research. 30:515–532.
- Chiswell SM, Sutton PJ. 2015. Drifter- and float-derived mean circulation at the surface and 1000 m in the New Zealand region. New Zealand Journal of Marine and Freshwater Research. 49(2):259–277.
- Chiswell SM, Zeldis JR, Hadfield MG, Pinkerton MH. 2017. Wind-driven upwelling and surface chlorophyll blooms in greater Cook Strait. New Zealand Journal of Marine and Freshwater Research. 51(4):465–489.
- Cohen C. 2012. Shallow-water plane and tidal jets [Ph.D. Thesis]. University of Otago. http://hdl.handle.net/10523/2493.
- Coleman MA, Cetina-Heredia P, Roughan M, Feng M, van Sebille E, Kelaher BP. 2017. Anticipating changes to future connectivity within a network of marine protected areas. Global Change Biology. 23:3533–3542.
- Collins B. 2000. The wreck of the Penguin. Wellington (NZ): Steele Roberts.
- Cornelisen CD, Gillespie PA, Kirs M, Young RG, Forrest RW, Barter PJ, Knight BR, Harwood VJ. 2011. Motueka River plume facilitates transport of ruminant faecal contaminants into shellfish growing waters, Tasman Bay, New Zealand. New Zealand Journal of Marine and Freshwater Research. 45(3):477–495.
- Cranfield HJ. 1968. An unexploited population of oysters, Ostrea lutaria Hutton, from Foveaux Strait: part I. Adult stocks and spatfall distribution. New Zealand Journal of Marine and Freshwater Research. 2(1):3–22.
- Cullen DJ. 1967. Submarine evidence from New Zealand of a rapid rise in sea level about 11,000 years B.P.. Palaeogeography, Palaeoclimatology, Palaeoecology. 3:289–298.
- Currie KI, Reid MR, Hunter KA. 2011. Interannual variability of carbon dioxide drawdown by subantarctic surface water near New Zealand. Biogeochemistry. 104(1–3):23–34.
- Davies K, Fisher K, Foley M, Greenaway A, Hewitt J, Le Heron R, Mikaere H, Ratana K, Spiers R, Lundquist C. 2018. Navigating collaborative networks and cumulative effects for sustainable seas. Environmental Science & Policy. 83:22–32.
- de Burgh-Day CO, Spillman CM, Rickard G, Alves A, Stevens CL. 2018. Predicting seasonal ocean variability around New Zealand using a coupled ocean-atmosphere model. New Zealand Journal of Marine and Freshwater Research. 53:201–221. doi:10.1080/00288330.2018.1538052.
- Edwards CA, Moore AM, Hoteit I, Cornuelle BD. 2015. Regional ocean data assimilation. Annual Review of Marine Science. 7:21–42.
- Forcén-Vázquez A. 2017. Oceanography of the New Zealand subantarctic region [Ph.D. thesis]. http://hdl.handle.net/10063/4206.
- Forcén-Vázquez A. 2015. Oceanography of the New Zealand subantarctic region [PhD thesis]. Wellington: Victoria University of Wellington.
- Forrest BM, Gardner J, Taylor MD. 2009. Internal borders for managing invasive marine species. Journal of Applied Ecology. 46(1):46–54.
- Foster BA, Battaerd WR. 1985. Distribution of zooplankton in a coastal upwelling in New Zealand. New Zealand Journal of Marine and Freshwater Research. 19(2):213–226.
- Francis R. 1985. An alternative water circulation pattern for Hawke Bay, New Zealand. New Zealand Journal of Marine and Freshwater Research. 19(3):399–404.
- Gibbs MM, James MR, Pickmere SE, Woods PH, Shakespeare BS, Hickman RW, Illingworth J. 1991. Hydrodynamic and water column properties at six stations associated with mussel farming in Pelorus sound, 1984–85. New Zealand Journal of Marine and Freshwater Research. 25(3):239–254.
- Gibbs MT. 2001. Aspects of the structure and variability of the low-salinity-layer in doubtful sound, a New Zealand fiord. New Zealand Journal of Marine and Freshwater Research. 35(1):59–72.
- Gibbs MT, Bowman MJ, Dietrich DE. 2000. Maintenance of near-surface stratification in doubtful sound, a New Zealand fjord. Estuarine, Coastal and Shelf Science. 51(6):683–704.
- Gilmour AE. 1960. Currents in Cook Strait. New Zealand Journal of Geology and Geophysics. 3:410–431.
- Godoi VA, Bryan KR, Gorman RM. 2018. Storm wave clustering around New Zealand and its connection to climatic patterns. International Journal of Climatology. 38:e401–e417.
- Goodwin E, Cornelisen CD. 2012. Near-surface water temperatures in doubtful sound and response to natural and anthropogenic drivers. New Zealand Journal of Marine and Freshwater Research. 46(3):411–429.
- Goring DG. 1995. Short-term variations in sea level (2–15 days) in the New Zealand region. New Zealand Journal of Marine and Freshwater Research. 29(1):69–82.
- Goring DG, Bell RG. 1999. El Niño and decadal effects on sea-level variability in northern New Zealand: a wavelet analysis. New Zealand Journal of Marine and Freshwater Research. 33(4):587–598.
- Goring DG, Henry RF. 1998. Short period (1–4 h) sea level fluctuations on the Canterbury coast, New Zealand. New Zealand Journal of Marine and Freshwater Research. 32(1):119–134.
- Gorman RM, Bryan KR, Laing AK. 2003. Wave hindcast for the New Zealand region: nearshore validation and coastal wave climate. New Zealand Journal of Marine and Freshwater Research. 37(3):567–588.
- Greig MJ, Gilmour AE. 1992. Flow through the Mernoo Saddle, New Zealand. New Zealand Journal of Marine and Freshwater Research. 26(2):155–165.
- Greig MJ, Ridgway NM, Shakespeare BS. 1988. Sea surface temperature variations at coastal sites around New Zealand. New Zealand Journal of Marine and Freshwater Research. 22(3):391–400.
- Haase P. 1990. Environmental and floristic gradients in Westland, New Zealand, and the discontinuous distribution of Nothofagus. New Zealand Journal of Botany. 28(1):25–40.
- Hadfield MG, Rickard GJ, Uddstrom MJ. 2007. A hydrodynamic model of Chatham Rise, New Zealand. New Zealand Journal of Marine and Freshwater Research. 41(2):239–264.
- Harris PT, Macmillan-Lawler M, Rupp J, Baker EK. 2014. Geomorphology of the oceans. Marine Geology. 352:4–24.
- Harris TFW. 1990. Greater Cook Strait: form and flow, DSIR marine and freshwater. 212 p.
- Hawke DJ. 1989. Hydrology and near-surface nutrient distribution along the south Otago continental shelf, New Zealand, in summer and winter 1986. New Zealand Journal of Marine and Freshwater Research. 23(3):411–420.
- Hawke DJ. 1992. Salinity variability in shelf waters near Otago Peninsula, New Zealand, on a time scale of hours. New Zealand Journal of Marine and Freshwater Research. 26(2):167–173.
- Heath RA. 1976a. Broad classification of New Zealand inlets with emphasis on residence times. New Zealand Journal of Marine and Freshwater Research. 10(3):429–444.
- Heath RA. 1976b. Tidal variability of flow and water properties in Pelorous Sound, South Island, New Zealand. New Zealand Journal of Marine and Freshwater Research. 10(2):283–300.
- Heath RA. 1970. An occurrence of low water temperatures on the North Canterbury coast (note). New Zealand Journal of Marine and Freshwater Research. 4:223–226.
- Heath RA. 1971. Hydrology and circulation in central and southern Cook Strait, New Zealand. New Zealand Journal of Marine and Freshwater Research. 5:178–199.
- Heath RA. 1972. Oceanic upwelling produced by northerly winds on the north Canterbury coast, New Zealand. New Zealand Journal of Marine and Freshwater Research. 6(3):343–351.
- Heath RA. 1973. Direct measurements of coastal currents around southern New Zealand. New Zealand Journal of Marine and Freshwater Research. 7(4):331–367.
- Heath RA. 1974. Physical oceanographic observations in Marlborough Sounds. New Zealand Journal of Marine and Freshwater Research. 8:691–708.
- Heath RA. 1977. Phase distribution of tidal constituents around New Zealand. New Zealand Journal of Marine and Freshwater Research. 11:383–392.
- Heath RA. 1978. Atmospherically induced water motions off the west coast of New Zealand. New Zealand Journal of Marine and Freshwater Research. 12(4):381–390.
- Heath RA. 1982. What drives the mean circulation on the New Zealand west coast continental shelf?. New Zealand Journal of Marine and Freshwater Research. 16:215–226.
- Heath RA. 1985. A review of the physical oceanography of the seas around New Zealand – 1982. New Zealand Journal of Marine and Freshwater Research. 19:79–124.
- Heath RA. 1986. In which direction is the mean flow through Cook Strait, New Zealand – evidence of 1 to 4 week variability? New Zealand Journal of Marine and Freshwater Research. 20:119–137.
- Heath RA, Gilmour AE. 1987. Flow and hydrological variability in the Kahurangi plume off north-west south Island, New Zealand. New Zealand Journal of Marine and Freshwater Research. 21(1):125–139.
- Howe JA, Austin WE, Forwick M, Paetzel M, Harland R, Cage AG. 2010. Fjord systems and archives: a review. London (UK): Geological Society. Special Publications. 344(1):5–15.
- Hume TM, Bell RG, de Lange WP, Healy TR, Hicks DM, Kirk RM. 1992. Coastal oceanography and sedimentology in New Zealand, 1967–91. New Zealand Journal of Marine and Freshwater Research. 26(1):1–36.
- Hume TM, Black KP, Oldman JW, Vennell R. 1997. Signatures of wave and current forcing on the seabed about a large coastal headland [online]. 0908993153. [cited 08 Nov 13]. Christchurch: Pacific Coasts and Ports ‘97.
- Jebri F, Zakardjian B, Birol F, Bouffard J, Jullion L, Sammari C. 2017. Interannual variations of surface currents and transports in the Sicily channel derived from coastal altimetry. Journal of Geophysical Research: Oceans. 122(11):8330–8353.
- Jenks WN, Grindrod J, Peterson JA. 1982. Drift currents in the southern New Zealand region as derived from Lagrangian measurements and the remote sensing of sea-surface temperature distributions. New Zealand Journal of Marine and Freshwater Research. 16(3–4):359–371.
- Jiang W, Cornelisen C, Knight B, Gibbs M. 2015. A pattern-oriented model for assessing effects of weather and freshwater discharge on black coral (Antipathes fiordensis) distribution in a fjord. Ecological Modelling. 304:59–68.
- Jones HFE, Poot MT, Mullarney JC, de Lange WP, Bryan KR. 2016. Oil dispersal modelling: reanalysis of the Rena oil spill using open-source modelling tools. New Zealand Journal of Marine and Freshwater Research. 50(1):10–27.
- Lane EM, Walters RA. 2009. Verification of RiCOM for storm surge forecasting. Marine Geodesy. 32(2):118–132.
- Law CS, Bell JJ, Bostock HC, Cornwall CE, Cummings VJ, Currie K, Davy SK, Gammon M, Hepburn CD, Hurd CL, Lamare M. 2017. Ocean acidification in New Zealand waters: trends and impacts. New Zealand Journal of Marine and Freshwater Research. 52:155–195.
- Lewis KB, Barnes PM. 1999. Kaikoura Canyon, New Zealand: active conduit from near-shore sediment zones to trench-axis channel. Marine Geology. 162(1):39–69.
- Liu Y, Kerkering H, Weisberg RH, editors. 2015. Coastal ocean observing systems. London: Academic Press.
- Longdill PC, Healy TR, Black KP. 2008. Transient wind-driven coastal upwelling on a shelf with varying width and orientation. New Zealand Journal of Marine and Freshwater Research. 42(2):181–196.
- McPherson RA. 2018. Structure, dynamics and mixing processes in a buoyant river plume entering a fjord. [PhD thesis]. University of Auckland.
- Moore MI, Murdoch RC. 1993. Physical and biological observations of coastal squirts under nonupwelling conditions. Journal of Geophysical Research. 98(C11):20043.
- Moriarty JM, Harris CK, Hadfield MG. 2015. Event-to-seasonal sediment dispersal on the Waipaoa river shelf, New Zealand: A numerical modeling study. Continental Shelf Research. 110:108–123.
- Mountjoy J, Micallef A. 2018. Submarine landslides. In: Submarine geomorphology. Cham: Springer; p. 235–250.
- Mountjoy J, Micallef A, Stevens C, Stirling M. 2014. Holocene sedimentary activity in a non-terrestrially coupled submarine canyon: Cook Strait canyon system, New Zealand. Deep Sea Research Part II: Topical Studies in Oceanography. 104:120–133. doi:10.1016/j.dsr2.2013.09.001.
- Murdoch RC, Proctor R, Jillett JB, Zeldis JR. 1990. Evidence for an eddy over the continental shelf in the downstream lee of Otago Peninsula, New Zealand. Estuarine, Coastal and Shelf Science. 30(5):489–507.
- New Zealand GOAL. 2014. New Zealand government open access and licensing framework – version 2, ISBN 978-0-478-10763-0, pp 49.
- Nikora V, Goring D, Ross A. 2002. The structure and dynamics of the thin near-bed layer in a complex marine environment: a case study in Beatrix Bay, New Zealand. Estuarine, Coastal and Shelf Science. 54(5):915–926.
- Nodder SD, Chiswell SM, Northcote LC. 2016. Annual cycles of deep-ocean biogeochemical export fluxes in subtropical and subantarctic waters, southwest Pacific Ocean. Journal of Geophysical Research: Oceans. 121(4):2405–2424.
- O’Callaghan J, Rickard G, Popinet S, Stevens C. 2010. Response of buoyant plumes to transient discharges investigated using an adaptive solver. Journal of Geophysical Research: Oceans. 115(C11025). doi:10.1029/2009JC005645.
- O’Callaghan J, Stevens C. 2015. Transient river flow into a fjord and its control of energy partitioning within the freshwater plume structure. Jour Geophys Res. 120:3444–3461. doi:10.1002/2015JC010721.
- O’Callaghan JM, Stevens CL. 2017. Evaluating the surface response of discharge events in a New Zealand gulf-ROFI, Frontiers in Marine Science. doi:10.3389/fmars.2017.00232.
- O’Callaghan JM, Stevens CL, Cornelison C, Roughnan M, et al. 2019. Developing an integrated ocean observing system for New Zealand, in press at Frontiers in Marine Science, Ocean Observation Section.
- Old CP, Vennell R. 2001. Acoustic Doppler current profiler measurements of the velocity field of an ebb tidal jet. Journal of Geophysical Research: Oceans. 106(C4):7037–7049.
- Olsson BH. 1955. The electrical effects of tidal streams in Cook Strait, New Zealand. Deep-Sea Research I. 2:204–212.
- Orpin AR. 1997. Dolomite chimneys as possible evidence of coastal fluid expulsion, uppermost Otago continental slope, southern New Zealand. Marine Geology. 138(1–2):51–67.
- Paul LJ. 1968. Some seasonal water temperature patterns in the Hauraki Gulf, New Zealand. New Zealand Journal of Marine and Freshwater Research. 2(3):535–558.
- Perkins-Kirkpatrick SE, King AD, Cougnon EA, Grose MR, Oliver ECJ, Holbrook NJ, Lewis SC, Pourasghar F. 2018. The role of natural variability and anthropogenic climate change in the 2017/2018 Tasman Sea marine heatwave. Bulletin of the American Meteorological Society. 100:S105–S110.
- Plew DR. 2011. Shellfish farm-induced changes to tidal circulation in an embayment, and implications for seston depletion. Aquaculture Environment Interactions. 1(3):201–214.
- Plew DR, Stevens CL. 2013. Numerical modelling of the effect of turbines on currents in a tidal channel – Tory Channel, New Zealand. Renewable Energy. 57:269–282.
- Plew DR, Stevens CL, Spigel RH, Hartstein ND. 2005. Hydrodynamic implications of large offshore mussel farms. IEEE Journal of Oceanic Engineering. 30(1):95–108.
- Popinet S, Rickard G. 2007. A tree-based solver for adaptive ocean modelling. Ocean Modelling. 16(3):224–249.
- Power W, Downes G, Stirling M. 2007. Estimation of tsunami hazard in New Zealand due to South American earthquakes. Pure and Applied Geophysics. 164(2–3):547–564.
- Proctor R, Carter L. 1989. Tidal and sedimentary response to the late quaternary closure and opening of Cook Strait, New Zealand: results from numerical modeling. Paleoceanography. 4:167–180.
- Proctor R, Greig MJN. 1989. A numerical model investigation of the residual circulation in Hauraki Gulf, New Zealand. New Zealand Journal of Marine and Freshwater Research. 23(3):421–442.
- Proctor R, Hadfield M. 1998. Numerical investigation into the effect of freshwater inputs on the circulation in Pelorus Sound, New Zealand. New Zealand Journal of Marine and Freshwater Research. 32(3):467–482.
- Proctor R, Roberts K, Ward BJ. 2010. A data delivery system for IMOS, the Australian integrated marine observing system. Advances in Geosciences. 28:11–16.
- Radford J. 2012. Shelf-to-canyon sedimentation on the South Westland continental margin, Westland, New Zealand [MSc Thesis]. U. Cant. http://hdl.handle.net/10092/6991.
- Reid CM, James NP, Bone Y. 2011. Carbonate sediments in a cool-water macroalgal environment, Kaikoura, New Zealand. Sedimentology. 58(7):1935–1952.
- Reynolds-Fleming JV, Fleming JG. 2005. Coastal circulation within the Banks Peninsula region, New Zealand. New Zealand Journal of Marine and Freshwater Research. 39(1):217–225.
- Ridgway NM. 1960. Surface water movements in Hawke Bay, New Zealand. New Zealand Journal of Geology and Geophysics. 3(2):253–261.
- Ridgway NM, Greig MJN. 1986. Water movements in Bay of Plenty, New Zealand. New Zealand Journal of Marine and Freshwater Research. 20(3):447–453.
- Ridgway NM, Stanton BR. 1969. Some hydrological features of Hawke Bay and nearby shelf waters. New Zealand Journal of Marine and Freshwater Research. 3(4):545–559.
- Roemmich D, Sutton P. 1998. The mean and variability of ocean circulation past northern New Zealand: determining the representativeness of hydrographic climatologies. Journal of Geophysical Research: Oceans. 103(C6):13041–13054.
- Russell P, Vennell R. 2017. High-resolution observations of secondary circulation and tidally synchronized upwelling around a coastal headland. Journal of Geophysical Research: Oceans. 122(2):890–913.
- Salama NKG, Rabe B. 2013. Developing models for investigating the environmental transmission of disease-causing agents within open-cage salmon aquaculture. Aquaculture Environment Interactions. 4(2):91–115.
- Sharples J. 1997. Cross-shelf intrusion of subtropical water into the coastal zone of northeast New Zealand. Continental Shelf Research. 17(7):835–857.
- Sharples J, Greig MJN. 1998. Tidal currents, mean flows, and upwelling on the north-east shelf of New Zealand. New Zealand Journal of Marine and Freshwater Research. 32(2):215–231.
- Sharples J, Moore CM, Abraham ER. 2001. Internal tide dissipation, mixing, and vertical nitrate flux at the shelf edge of NE New Zealand. Journal of Geophysical Research: Oceans. 106(C7):14069–14081.
- Shaw AGP, Vennell R. 2000. Variability of water masses through the Mernoo Saddle, South Island, New Zealand. New Zealand Journal of Marine and Freshwater Research. 34(1):103–116.
- Shears NT, Bowen MM. 2017. Half a century of coastal temperature records reveal complex warming trends in western boundary currents. Scientific Reports. 7(1):14527.
- Shirtcliffe TGL, Moore MI, Cole AG, Viner AB, Baldwin R, Chapman B. 1990. Dynamics of the Cape Farewell upwelling plume, New Zealand. New Zealand Journal of Marine and Freshwater Research. 24(4):555–568.
- Smith RH, Johns EM, Goni GJ, Trinanes J, Lumpkin R, Wood AM, Kelble CR, Cummings SR, Lamkin JT, Privoznik S. 2014. Oceanographic conditions in the Gulf of Mexico in July 2010, during the Deepwater Horizon oil spill. Continental Shelf Research. 77:118–131.
- Smith RO, Vennell R, Bostock HC, Williams MJM. 2013. Interaction of the subtropical front with topography around southern New Zealand. Deep Sea Research Part I: Oceanographic Research Papers. 76:13–26.
- Stanton BR. 1973. Hydrological investigations around northern New Zealand. New Zealand Journal of Marine and Freshwater Research. 7(1–2):85–110.
- Stanton BR. 1976. Circulation and hydrology off the west coast of the South Island, New Zealand. New Zealand Journal of Marine and Freshwater Research. 10(3):445–467.
- Stanton BR. 1977. Preliminary observations of the internal tide over the shelf west of New Zealand. New Zealand Journal of Marine and Freshwater Research. 11(4):703–712.
- Stanton BR. 1984. Some oceanographic observations in the New Zealand fjords. Estuarine, Coastal and Shelf Science. 19:89–104.
- Stanton BR. 1986. Winter oceanographic observations in some New Zealand fiords. New Zealand Journal of Marine and Freshwater Research. 20(2):299–314.
- Stanton BR. 1997. Sea level and sea surface temperature variability at the Chatham Islands, New Zealand. New Zealand Journal of Marine and Freshwater Research. 31(4):525–536.
- Stanton BR, Goring DG, Bell RG. 2001. Observed and modelled tidal currents in the New Zealand region. New Zealand Journal of Marine and Freshwater Research. 35:397–415.
- Stanton BR, Moore MI. 1992. Hydrographic observations during the Tasman boundary experiment off the west coast of South Island, New Zealand. New Zealand Journal of Marine and Freshwater Research. 26(3–4):339–358.
- Stanton BR, Pickard GL. 1980. Physical oceanography of the New Zealand fjords. In: Freeland H, Farmer D, Levings C, editors. Fjord oceanography. New York: Springer US; p. 329–332.
- Stephens SA, Bell RG, Black KP. 2001. Complex circulation in a coastal embayment: shelf-current wind and density-driven circulation in Poverty Bay, New Zealand. Journal of Coastal Research Special Issue. 34 (ISSN 0749-0208):45–59.
- Stephens SA, Broekhuizen N, Macdiarmid AB, Lundquist CJ, McLeod L, Haskew R. 2006. Modelling transport of larval New Zealand abalone (Haliotis iris) along an open coast. Marine and Freshwater Research. 57(5):519–532.
- Sterl A, Komen GJ, Cotton PD. 1998. Fifteen years of global wave hindcasts using winds from the European centre for medium-range weather forecasts reanalysis: validating the reanalyzed winds and assessing the wave climate. Journal of Geophysical Research: Oceans. 103(C3):5477–5492.
- Stevens C. 2003. Turbulence in an estuarine embayment: observations from Beatrix Bay, New Zealand. Journal of Geophysical Research: Oceans. 108(C2). doi:10.1029/2001JC001221.
- Stevens C. 2010. Short-term dispersion and turbulence in a complex-shaped estuarine embayment. Continental Shelf Research. 30(5):393–402.
- Stevens C. 2014. Residual flows in Cook Strait, a large tidally dominated Strait. Journal of Physical Oceanography. 44:1654–1670. doi:10.1175/JPO-D-13-041.1.
- Stevens C, O’Callaghan J. 2015. When the holiday is over: being clever in New Zealand’s marine domain. Journal Royal Society New Zealand. 45:89–94. doi:10.1080/03036758.2015.1014377.
- Stevens C, Sutton P, Smith M, Dickson R. 2008. Tidal flows in Te Aumiti (French Pass), South Island, New Zealand. New Zealand Journal of Marine and Freshwater Research. 42(4):451–464.
- Stevens CL. 2018. Turbulent length scales in a fast-flowing, weakly stratified, strait: Cook Strait, New Zealand, Ocean Sci. doi:10.5194/os-2017-30.
- Stevens CL, Abraham ER, Moore CM, Boyd PW, Sharples J. 2005. Observations of small-scale processes associated with the internal tide encountering an island. Journal of Physical Oceanography. 35(9):1553–1567.
- Stevens CL, Consalvey M, Devine JA, Clark MR. 2014. Mixing and transport near the shallow-crested Rumble III seamount and the implications for plankton distribution. New Zealand Journal of Marine and Freshwater Research. 48(2):194–215.
- Stevens CL, Smith MJ. 2016. Turbulent mixing in a stratified estuarine tidal channel: Hikapu reach, Pelorus Sound, New Zealand. New Zealand Journal of Marine and Freshwater Research. 50(4):485–505.
- Stevens CL, Smith MJ, Grant B, Stewart CL, Divett T. 2012. Tidal energy resource complexity in a large strait: The Karori Rip, Cook Strait. Continental Shelf Research. 33:100–109.
- Sturman AP, Tapper NJ. 2006. Weather and climate of Australia and New Zealand. Melbourne (Vic): Oxford University Press.
- Sutton P. 2001. Detailed structure of the subtropical front over Chatham Rise, east of New Zealand. Journal of Geophysical Research: Oceans. 106(C12):31045–31056.
- Sutton PJ. 2003. The Southland Current: a subantarctic current. New Zealand Journal of Marine and Freshwater Research. 37(3):645–652.
- Sutton PJ, Bowen M, Roemmich D. 2005. Decadal temperature changes in the Tasman Sea. New Zealand Journal of Marine and Freshwater Research. 39(6):1321–1329.
- Sutton PJ, Roemmich D. 2001. Ocean temperature climate off north-east New Zealand. New Zealand Journal of Marine and Freshwater Research. 35(3):553–565.
- Sutton PJH, Bowen MM. 2011. Currents off the west coast of Northland, New Zealand. New Zealand Journal of Marine and Freshwater Research. 45(4):609–624.
- Sutton PJH, Hadfield MG. 1997. Aspects of the hydrodynamics of Beatrix Bay and Pelorus Sound, New Zealand. New Zealand Journal of Marine and Freshwater Research. 31(2):271–279.
- Thompson R. 1994. The first fourty years, New Zealand oceanographic institute: lives and times, 1954–1994, 40th Jubilee Committee, Wellington.
- Tuckey BJ, Gibbs MT, Knight BR, Gillespie PA. 2006. Tidal circulation in Tasman and Golden bays: implications for river plume behaviour. New Zealand Journal of Marine and Freshwater Research. 40:305–324.
- Vennell R. 1994. Acoustic Doppler current profiler measurements of tidal phase and amplitude in Cook Strait, New Zealand. Continental Shelf Research. 14(4):353–364.
- Vennell R. 1998. Observations of the phase of tidal currents along a strait. Journal of Physical Oceanography. 28(8):1570–1577.
- Vennell R. 2012. Realizing the potential of tidal currents and the efficiency of turbine farms in a channel. Renewable Energy. 47:95–102.
- Vennell R, Collins NR. 1991. Acoustic Doppler current profiler measurements of tides in Cook Strait, New Zealand. Proceedings of 10th Australasian Conference on Coastal and Ocean Engineering; Auckland: DSIR. p. 6.
- Vennell R, Corney P, France J, Christian C, Barnett A, Schnackenberg T. 2003. Tidal current prediction system for Team New Zealand. Coasts and Ports Australasian Conference 2003. Auckland.
- Vennell R, Moore M. 1993. Acoustic Doppler current profiler measurements of the semi-diurnal internal tide on the west coast of New Zealand. New Zealand Journal of Marine and Freshwater Research. 27(1):31–38.
- Walters RA, Gillibrand PA, Bell RG, Lane EM. 2010. A study of tides and currents in Cook Strait, New Zealand. Ocean Dynamics. 60(6):1559–1580.
- Walters RA, Goring DG, Bell RG. 2001. Ocean tides around New Zealand. New Zealand Journal of Marine and Freshwater Research. 35:567–579.
- Whaanga H, Wehi P, Cox M, Roa T, Kusabs I. 2018. Māori oral traditions record and convey indigenous knowledge of marine and freshwater resources. New Zealand Journal of Marine and Freshwater Research. 52:487–496. doi:10.1080/00288330.2018.1488749.
- Zeldis JR, Hadfield MG, Booker DJ. 2013. Influence of climate on Pelorus sound mussel aquaculture yields: predictive models and underlying mechanisms. Aquaculture Environment Interactions. 4(1):1–15.
- Zeldis JR, Oldman J, Ballara SL, Richards LA. 2005. Physical fluxes, pelagic ecosystem structure, and larval fish survival in Hauraki Gulf, New Zealand. Canadian Journal of Fisheries and Aquatic Sciences. 62(3):593–610.
- Zeldis JR, Swaney DP. 2018. Balance of catchment and offshore nutrient loading and biogeochemical response in four New Zealand coastal systems: implications for resource management. Estuaries and Coasts. 41:2240–2259. doi:10.1007/s12237-018-0432-5, under Open Access licence http://creativecommons.org/licenses/by/4.0/.
- Zeldis JR, Walters RA, Greig MJN, Image K. 2004. Circulation over the northeastern New Zealand continental slope, shelf and adjacent Hauraki Gulf, during spring and summer. Continental Shelf Research. 24(4–5):543–561.
- Zeldis JR, Willis KJ. 2015. Biogeographic and trophic drivers of mesozooplankton distribution on the northeast continental shelf and in Hauraki Gulf, New Zealand. New Zealand Journal of Marine and Freshwater Research. 49(1):69–86.