ABSTRACT
Environmental sustainability and the long-term wellbeing of Māori (the indigenous people of New Zealand) are interdependent and degradation of landscapes risks the progressive degradation of Māori wellbeing. The present study developed an analysis framework based on Ki Uta Ki Tai (holistic-mountains to the sea- management philosophy advocated by Ngāi Tahu) for exploring relationships between landcover and Māori values to enable predictions of cultural values through space and time. We used this framework to predict how two Māori values (Overall Health and Cultural Land Use) have been altered as a result of landcover change between 2001–2012 in three Canterbury catchments. The area of native vegetation declined while exotic pasture increased between 2001–2012, and there were corresponding declines in both cultural health scores. These results suggest that the change in landcover has reduced the ability of the landscape to support Māori values. This framework for assessing changes in Māori values with respect to changing environmental conditions may identify opportunities for Māori to better engage in land use management decisions.
Introduction
Physical and spiritual connections to the landscape are essential to Māori culture (Kawharu Citation2002) and many other indigenous cultures (Stevens Citation1998; Berkes et al. Citation2002). For Māori, survival was dependent upon their knowledge of the natural resources and their ability to sustainably utilise these resources from within their tribal territories (Mihinui Citation2002). These critical connections to the landscape mean that New Zealand is covered with a series of interconnected sites utilised by Māori to sustain their way of life. Historically, the landscape provided economic wellbeing for Māori where the natural resources of their rohe (tribal territory) generated robust economies based on trade and exchange (Williams Citation2004). Resource access was governed by tikanga and kawa (the correct protocols) and the right for Māori to continue resource development is enshrined in the Treaty of Waitangi. The recognition in the Treaty of Waitangi means that Māori remain significant resource users and have widespread commercial interests that include agriculture, horticulture, and forestry. However, the essential relationship of Māori with the landscape remains. The economic, social, environmental and cultural values of Māori are balanced within the context of environmental sustainability and the long-term wellbeing of Māori, which remain one and the same thing (Durie Citation1995). Therefore, any reduction in the ability of the landscape to support natural resources and cultural use, risks the progressive degradation of Māori long-term wellbeing.
Since European settlement in the nineteenth century, the landscape of New Zealand has been continuously changing through space and time. Historical quantitative information on landcover is difficult to find but recent information are available from the Land Cover Database (LCDB) (New Zealand Land Cover Database v4.1 Citation2019). According to the LCDB, the largest increase in landcover type nationally between 2001–2012 was in harvested forest, exotic pastures, and orchards (Appendix 1). Over the same time period, the landcover types that showed the largest decrease in area coverage were exotic forest, low producing grasslands, and several native vegetation categories. Native vegetation cover declined by almost 800 km2 over this 11-year period, a loss roughly equivalent to the area covered by Auckland City. The landcover changes over this 11-year period generally related to increased coverage of modified landscapes and decreased coverage of native/unmodified landscapes. This shift from native to exotic landcover may have impacted on Māori values associated with these areas.
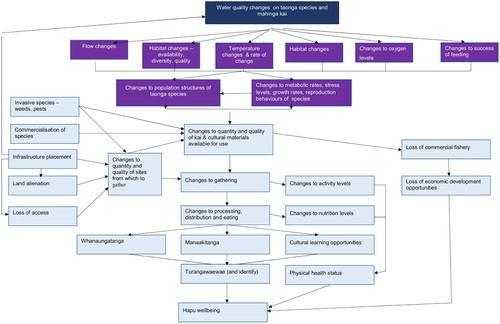
The ongoing loss of native landcover not only directly impacts on the natural resources supporting Māori culture, but it also indirectly impacts on multiple other aspects of Māori health and wellbeing (e.g. knowledge loss about the sites access and linkages to surrounding areas). summarises an example of how resource modification (water quality change) caused by landcover change can directly impact one cultural practice (mahinga kai – the procurement of food and resources) and also indirectly impact multiple other connected Māori values that the practice of gathering foods and resources underpins. The concerns of Māori with respect to different landcovers are also found in the many hapū and iwi management plansFootnote1, which Councils must regard as pursuant to the Resource Management Act 1991.
Figure 1. Multiple direct and indirect impacts of water quality change on hapu wellbeing.
There are limited processes currently available to record and analyse the relationships between land use and cultural interests. However, the availability of such processes would assist Māori to actively engage in land use management discussions. Developing tools that identify how cultural values are impacted by land use is an essential step required to improve the management of New Zealand’s natural resources. This step will incorporate Māori perspectives on how land use changes directly and indirectly impact on their cultural practices, which needs to be recognised and provided for in decision-making processes. Despite being afforded the status of a matter of national importance pursuant to section 6:e of the Resource Management Act 1991 (New Zealand Government Citation1991), disputes over resource ownership, access to management processes, and the effect of other land and water uses on the resources valued and used by Māori, have been sources of long-standing grievances. Māori across New Zealand are committing significant resources to monitor the health of their lands, waters and other taonga (Rainforth and Harmsworth Citation2019). Therefore, the development of decision support tools is urgently required.
When exploring relationships between the environment and cultural values it is important to consider the interacting processes operating across multiple spatial scales. This multi-spatial framework is encapsulated within the Ki Uta Ki Tai – mountains to the sea – management philosophy advocated by Ngāi Tahu. Holistic conceptualizations that emphasise integration, inter-dependencies and inter-relationships are common to indigenous peoples rather than fragmenting and compartmentalizing the environment (Posey Citation1999). For generations Ngāi Tahu have emphasised the necessity of considering the environment in its entirety (Te Rūnanga o Ngai Tahu (TRoNT) Citation2003). Ki Uta Ki Tai refers to the passage of waters from their source, through a network of tributaries onto lower floodplains, to the interface with the coast and out to the sea. This Māori resource management framework reflects that resources are connected, from the mountains to the sea, and must be managed holistically. Within this framework, the overall health of an entire river can be affected by the deterioration at a single location, i.e. what happens at location can affect all parts of the catchment (Kitson Citation2014). Furthermore, this concept reflects that we belong to the environment and are only borrowing the resources from our generations that are yet to come. It is considered the duty of everyone to leave the environment in as good as or even better condition than received from our tūpuna (Ngāi Tahu ki Murihiku Citation2008).
The aim of this paper was to prepare a Land Use Suitability (LUS) dataset based on Māori values and to develop an analysis framework based on Ki Uta Ki Tai for exploring the relationships between landcover and Māori values. We then explored how different catchment landcover impacted on Māori values and used the results to examine how Māori values have been altered as a result of landcover changes from 2001–2012. We finally examined the transferability of the our methods, given that there will be differences in the relationships between whānau (family), hapū (sub-tribe) and iwi (tribe) (Crow et al. Citation2018).
Methods
Cultural dataset
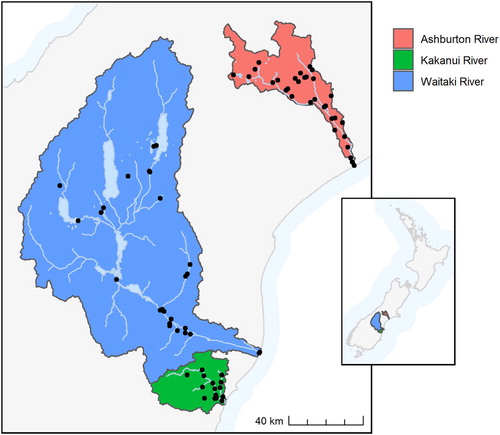
Cultural assessment information was obtained from Cultural Flow Preference Studies (CFPS) (Tipa and Nelson Citation2012; Tipa et al. Citation2016) and assessments using the Cultural Health Index (CHI) (Tipa and Teirney Citation2003; Tipa and Teirney Citation2006) at more than 170 sites collected across the South Island of New Zealand between 2009–2015. Both the CHI and the CFPS are applied by mandated representatives of the hapū or iwi, who have a history of interacting with the wetlands, streams and rivers within their rohe, and thus bring their mātauranga (Māori knowledge and expertise) to the assessment process. The mandated individuals complete a series of scores that reflect how well the surrounding environmental conditions support different cultural values. Within both the CHI and CFPS, there were two shared indicators of relevance to land use suitability that we selected for our analysis: Cultural Land Use and Overall Health (which is an index for sustaining cultural use in the future).Footnote2 We focussed on the Waitaki, Kakanui and Ashburton catchments in Canterbury because these waterbodies had the most available data (). Once a spreadsheet was compiled of cultural scores for the three catchments, data from the national digital river network (REC2.4) system were spatially joined to each site (Snelder and Biggs Citation2002). This connection to the REC2.4 allowed landcover upstream and local landcover information to be obtained for each site. We then obtained two temporal datasets of LCDB information to examine temporal changes in the three catchments; these were LCDB version 2 (spatial landcover assessment of New Zealand for 2001) and LCDB version 4 (spatial landcover assessment of New Zealand for 2012). We could not include landcover assessments from LCDB version 1(1996) because some of the landcover categories had changed. We made the assumption that landcover in 2012 was similar to the conditions in 2009–2014 when the cultural assessments were completed. To reduce pseudo-replication, we randomly selected one cultural assessment from each reach, resulting in a final dataset containing 73 observations from across the three catchments ().
Figure 2. Locations of the 73 sites used to examine relationships between Māori values and landcover in three catchments.
Study catchments
The Waitaki River is a large braided river that drains the Mackenzie Basin and runs 110 kilometres south-east to enter the Pacific Ocean between Timaru and Oamaru on the east coast of the South Island of New Zealand. The catchment covers 96,579 km2 and primarily fed by three large glacial lakes (Pūkaki, Tekapō, and Ōhau). The Waitaki River flows through a series of hydro-electric impoundments – Lake Benmore, Lake Aviemore and Lake Waitaki. The Waitaki River has several tributaries, notably the Ahuriri River and Hakataramea River, and passes the townships of Kurow and Glenavy before entering the Pacific Ocean. The lower river has been intensively farmed since the first irrigation scheme were constructed in the 1930s. The middle catchment (centred on Lakes Benmore, Aviemore and Waitaki) has mixed landcovers, while the Mackenzie Basin is predominantly degraded tussock. The Ōhau and Ahuriri catchments have seen an increase in intensive agriculture since the 1990s (mainly as a result of the Benmore Irrigation Scheme). The headwaters of the Waitaki River remain largely covered in native vegetation and are protected within the conservation estate.
The Ashburton River / Hakatere flows across the region from the Southern Alps to the Pacific Ocean. The catchment area is 1545 km2. The official name of the river was amended to become a dual name by the Ngāi Tahu Claims Settlement Act 1998. The river has two branches which meet 21 kilometres from the coast, just inland of the town of Ashburton. The branches remain parallel and no more than 3 kilometres apart for a further 20 kilometres upstream of their confluence, finally diverging near the small settlement of Ashburton Forks. The rivers’ path southeast across the Canterbury Plains lies in a shallow depression between the higher shingle fans created by the much larger Rakaia and Rangitata rivers. The mid and lower catchments are intensively farmed. The Ashburton River North Branch / Hakatere flows from the slopes of Godley Peak in the Palmer Range. The river flows south then southwest through narrow scree-sided valleys with almost no areas of river flats. The larger Ashburton River South Branch / Hakatere starts as the outflow of the Ashburton Glacier which flows down from Mount Arrowsmith. It initially flows southeast down a narrow valley between the Big Hill Range and the Wild Man's Brother Range. Ten kilometres from source the river trends south, turning southeast again to cross the flat Hakatere Valley where the outflows of several small lakes (collectively known as the Ashburton Lakes) join it. The river exits the valley via the Ashburton Gorge, with the Moorhouse Range to the south and the Clent Hills and Winterslow Range to the north, emerging onto the Canterbury Plains at Mount Somers then flowing east towards Ashburton Forks.
The Kakanui River is a small river in North Otago that covers 539 km2 and is bordered by the Kakanui Mountains to the south, the Maerewhenua Catchment to the west, the Waitaki Catchment to the north, and the Pacific Ocean to the east. The Kakanui has three major tributaries: the Kauru River, Island Stream and Waiareka Creek. Two deep aquifers in the Kakanui Catchment yield significant amounts of water for irrigation and other permitted uses. From its source, the river flows north-east through partially developed tussock grassland before emerging onto plains. It then flows south-eastwards at a gentler gradient through highly developed pastures to the sea. The river can be divided into three sections, each of different character. The lower reach is low gradient and willow-lined on at least one bank, with long pools and short cobble riffles. Many of the pools contain large macrophyte beds. In the middle reach there is generally less willow, macrophytes, and pools than in the lower river, with correspondingly more run and riffle habitat. The upper reach is generally steep, confined by steep hillsides, and contains well-developed pool-riffle sequences.
Analysis of the relationships between Māori values and landcover
We used Generalised Additive Models (GAM) to explore relationships between landcover and cultural scores. We used the Ki Uta Ki Tai – mountains to the sea – management philosophy advocated by Ngāi Tahu to identify landcover covariates for the GAM. We adopted this holistic and integrated approach for our covariate selection by focussing on landcover at the site of the cultural assessments, as well as the cumulative upstream coverage of landcover (). We included Catchment as a grouping factor because Crow et al. (Citation2018) found that relationships between flow and cultural health differed between catchments. The differences in the relationships between catchments were driven by variability in Māori values and different characteristics of the catchments (Crow et al. Citation2018). These differences between catchments were likely to apply to the present study with regards to both Cultural Land Use and Overall Health scores. We also included an interaction term using the site coordinates to help account for any spatial-autocorrelation between the observations (Legendre and Fortin Citation1989; Legendre Citation1990).
Table 1. Covariates used to examine relationships between landcover and Māori values. Vegetation classes are defined in Appendix 1.
Before starting the GAM analysis we examined autocorrelation between our proposed landcover covariates because high collinearity among covariates can lead to spurious inferences (Zuur et al. Citation2009). The autocorrelation analysis resulted in the removal of segNative because this covariate had a series of outliers with very high values that were likely to have a large and misleading influence on the analysis, particularly given the low number of observations in the data (Appendix 2). Therefore, we modelled our two values (Cultural Land Use and Overall Health) as a function of usExoticPasture + segExoticPasture + usNative + catchment + N*E. We used the Gaussian link function for GAM models and completed the analyses using landcover data from 2012 as this was the closest time period to when that the cultural assessments were completed. GAM analyses were completed in R using the mgcv package (Wood Citation2011).
To examine how Māori values may have altered between 2001 and 2012, we then predicted Māori values for the entire spatial extent of the three catchments using landcover information from LCDB 4 (2012). We then repeated this process using landcover information from LCDB2 (2001). We assumed that the relationships developed between Māori values and landcover with LCBD4 data were consistent across the two time periods. This approach allowed us to examine spatiotemporal changes in the cultural values that may have been driven by land use change.
Results
Examples of cultural assessments
We provide examples of the full CHI results for three sites sampled in Tipa and Williams (Citation2015): Willowburn a creek that flows into the Ahuriri River in the mid Waitaki (Box 1), a site in the Hakataramea catchment in the Lower Waitaki (Box 2) and Island Stream, a highly modified tributary in the Kakanui catchment (Box 3).
Model performance
Based on correlations between the observed and predicted values, the models of Overall Health and Cultural Land Use score correctly explained 61% and 88% of the observations respectively. The Overall Health model weighted most heavily on the Catchment factor (p<0.001) followed by usExoticPasture (p=0.237), N*E (p=0.374), segExoticPasture (p=0.395), usNative (p=0.843) (). The poor model performance and high p-values associated with most of the covariates suggest that variation in Overall Health is predominantly associated with catchment characteristics not related to the landcover covariates used in the present study. For example, the covariates do not capture the presence or loss of wahi taonga (treasured sites) such as place names, trails, stories, battles, archaeological sites etc. The Cultural Land Use model performed much better and weighted most heavily on the spatial coordinates (p=0.011) followed by segExoticPasture (p=0.067), usNative (p=0.0847) and Catchment factor (p=0.283), usExotic Pasture (p=0.6285). These results suggest that variation in Cultural Land Use scores are driven by spatial relationships combined with information on the local area covered by exotic pasture and the amount of native vegetation present above the site.
Table 2. Parameter estimates of the models for Overall Health and Cultural Land Use scores.
Spatiotemporal changes in landcover
Both native vegetation and exotic pasture show spatial variability within all three catchments (). Overall, exotic pasture was highest in the bottom of all three catchments, and coverage typically decreases moving up through the catchments, with the exception of the mid Waitaki catchment. The mid Waitaki Catchment showed several areas of high exotic pasture coverage, which is not present in the immediate upstream areas (appears to be Native Vegetation). Native vegetation generally covered most of the upper reaches of all three catchments and was particularly dominant in the Waitaki catchment, which is bordered by the Southern Alps and significant tracts of land are enclosed within the boundaries of Aoraki National Park and the Ahuriri Conservation Park (A).
Figure 3. Percentage of the upstream catchment covered in exotic pasture (usExoticPasture) and native vegetation (usNative) in 2012 (A) and change in land cover between 2001–2012 (B).
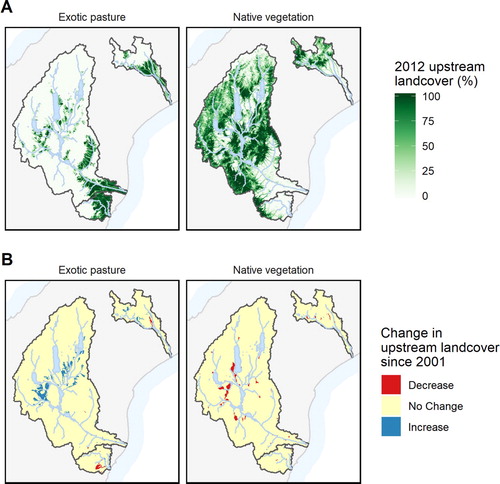
Analysis of landcover changes between 2001 and 2012 showed an increase in the area of exotic pasture and a decline in native vegetation. However, these patterns varied both between and within catchments. Most areas within the three catchments showed no change in native vegetation between 2001 and 2012, although native vegetation declined in several areas in the mid Waitaki catchment over that period. Conversely, exotic pasture increased in the mid Waitaki catchment increased in Exotic Pasture, while the rest of the catchment remained unchanged (B). This area corresponds with the MacKenzie Basin which has been the focus on media attention given the potential for large-scale dairying.Footnote3 It also includes lands within the command area of the Benmore Irrigation Scheme which draws water from the Ōhau Weir and irrigates the flats between Twizel and Omarama. Exotic pasture decreased in the Kakanui catchment and a small area around the middle of the Ashburton catchment between 2001 and 2012.
Spatiotemporal changes in Māori values
Cultural Land Use scores predicted using 2012 landcover data (LCDB4) showed spatial variation within each of the three catchments (A). The Kakanui catchment generally had low Cultural Land Use scores throughout. In contrast, the Waitaki catchment had isolated areas of low scores, particularly around the Hakataramea River and mainstem of the Waitaki River. In contrast, the headwaters of the Waitaki catchment (in the national park and conservation estate) and a small area of the middle Ashburton catchment all showed the highest Cultural Land Use scores.
Figure 4. Predicted Māori values across the three study catchments. The Ahuriri catchment located at the top-left of the Waitaki catchment is outlined with a small grey line for each map. This catchment is used in the Discussion as an example of how the model outputs could be used by Māori.
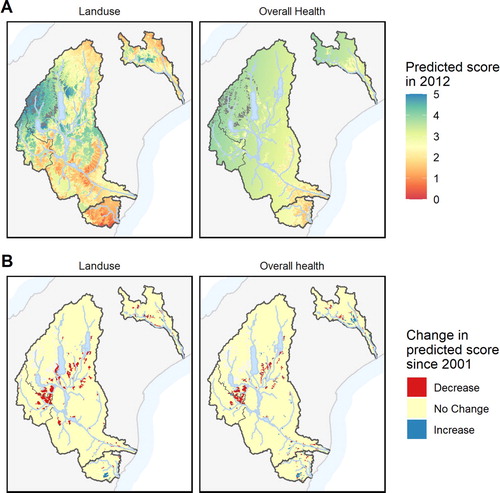
Overall Health Scores predicted using 2012 landcover data (LCDB4) showed a lower degree of spatial variation compared to Cultural Land Use scores (A). The Kakanui catchment had the lowest scores overall scores, while all three catchments showed a gradual increase in overall health scores moving upstream through the catchments towards the headwaters.
Modelled Cultural Land use and Overall health scores showed temporal changes between 2001 and 2012, although these changes were limited to the mid Waitaki catchment, upper Kakanui and some small areas in the middle-upper Ashburton catchment (B). The middle of the Kakanui and Ashburton catchments were the only areas were both Māori values increased, while all the other areas where temporal changes occurred showed decreases in both scores. The mid Waitaki catchment was the area where the biggest change in Māori values is predicted to have occurred. Cultural Land Use scores have been degraded over a larger spatial extent in this area compared to Overall Health Scores, but the areas of temporal change were broadly consistent in mid Waitaki catchment.
Discussion
Our study found strong relationships between landcover and the Cultural Land Use score, but relationships between landcover and Overall Health were weaker. The increased cover of exotic pasture and reduction in native landcover led to a reduction in the Cultural Land Use scores between 2001–2012. The temporal changes the Cultural Land Use score suggests that there has been a reduction in the ability of the landscape to support Māori values from 2001–2012. The dependence of Māori values on changing environmental resources has previously been outlined by Crow et al. (Citation2018), who showed that temporal changes in flow magnitude drove scores for Overall Cultural Health. The relationship between environmental conditions and cultural values in the present paper and in Crow et al. (Citation2018) both identify how temporal changes in the environment can impact on cultural values. The connections between the environment and Māori values, beliefs and practices is well established (Kawharu Citation2002; Williams et al. Citation2018). However, the present study and Crow et al. (Citation2018) are the only examples we are aware of that outline empirical spatiotemporal changes of cultural values in response to varying environmental resources.
The present study outlines a process for developing numerical relationships between cultural values and landcover based on the Ki Uta Ki Tai framework. We believe that this analysis framework will help generate results that reflect Māori relationships with the environment and also help communicate the cultural impacts of landcover changes to other resource managers. It is important to note that appropriately generating the CFPS and CHI scores (Tipa and Nelson Citation2012) is a critical pre-cursory step and that the present analysis cannot proceed without it.
There are multiple cultural values associated with any given area, which all may interact with the environmental conditions differently. The different responses of cultural values to the environment was evident in the present study that found Cultural Land Use was primarily driven by changes in exotic and native landcover, but variation in Overall Health was primarily driven by differences between catchment (i.e. catchment factor provided to the model). This suggests that Cultural Land Use scores are more sensitive to landcover change than Overall Health. Therefore, changing environmental conditions will impact on cultural values in different ways. Further work is required to develop the best decision support tool to help visualise and communicate how multiple cultural values respond to changing environmental conditions, such as Bayesian Belief networks (Stewart-Koster and coauthors Citation2010).
There are two questions that need to be answered for Māori given the spatial and temporal changes identified in the present analyses:
Having assessed a selection of sites using cultural tools, do Māori need to undertake the additional modelling and analyses?
What are the constraints on the future application of the modelling we describe?
In response to the first question, Ngāi Tahu has repeatedly advocated their management philosophy – Ki Uta Ki Tai – mountains to the sea. However, the challenge for Ngāi Tahu as kaitiaki (guardian) is that, without access to all parts of a catchment, it is difficult to know how they would assess the overall condition of a catchment, let alone identify and defend management priorities. This is a situation common to many whānau and hapū. Land alienation following the arrival of settlers in the mid nineteenth century saw whānau and hapū lose access to valued lands and waters. Nevertheless, the responsibility to care for these taonga (treasures) remains. The methods described in this paper represent one tool that is now available to Māori to understand the impacts of landcover changes through space and time.
If we refer to Box 1, the site adjacent to the Willowburn is a nohoanga that Ngāi Tahu secured through the Ngāi Tahu claims settlement process. It is located at the confluence of the Ahuriri River and the Willowburn. This site is significant because Ngāi Tahu successfully advocated to have the Ahuriri Arm of Lake Benmore and the Ahuriri catchment designated as a customary fisheries management area. Having completed an assessment of the nohoanga site, Ngāi Tahu were concerned that this area was still being used by whānau despite health fears associated with the degradation of the landcover surrounding the waterway. But whānau do not have access to any other large tracts of adjacent land in either the Willowburn or the Ahuriri catchment. An option available to visualise the extent of change in this area is aerial imagery sourced from internet sources such as Google Maps. But this visual approach does not tell us how we may assess values in other sites that are inaccessible. B produces insights into the Cultural Land Use score for the Ahuriri catchment and shows that there has been a decline in Cultural Land Use score in the lower catchment where the Willowburn joins the Ahuriri River. The decline in Cultural Land Use score confirms the concerns of Ngāi Tahu relating to The Ahuriri-Willowburn confluence who have witnessed the changing landcover in this area and the associated decline in the cultural values.
The second example (Box 2) is found in the lower Waitaki catchment. The Hakataramea River is known to experience large periphyton growth and algal blooms (Environment Canterbury Citation2015). The site that was assessed by a team of RūnangaFootnote4 members and it received average scores for both cultural use and stream health. However, Rūnanga assessors noted their concern at the threat of an increase in irrigated area and potential land use intensification. Based on the scores awarded by the team of assessors, the modelling confirmed that the environmental conditions in the catchment are causing a reduction in cultural values and that appropriate management efforts should focus on this area (B).
The third site (Box 3) will be interesting for whānau to observe in the future. This site is on a lowland stream (Island Stream) that is a tributary of the Kakanui. The site is located just upstream of the confluence of Island Stream and the Kakanui. It is severely degraded. However, B suggests that upstream scores could increase. Whānau will be keen to observe if this change in upstream condition is reflected at the downstream site. Similarly, the modelling confirmed that the Kakanui catchment, in particular Island Stream, is another hotspot in need of attention by resource managers.
Finally, to answer the question of why Māori would undertake the additional modelling and analyses, it is necessary to identify how whānau, hapū and iwi might utilise the results of the modelling. From an iwi planning perspective, and are useful in identifying or confirming areas of most concern in a catchment. However, the figures are also valuable for Māori to identify areas in a catchment that score highly in terms of native vegetation and Cultural Land Use scores. This information can be used by whānau and hapū to identify ‘the good bits’ that are worthy of immediate protection. Protecting the remaining ‘good bits’ is likely to be a more cost effective first step than restoring degraded sites.
We believe that the tool outlined in the present paper has the potential to help Māori engage in management discussions relating to areas where access is restricted. This is a contemporary issue confronting Māori with access to valued parts of many catchments being increasingly diminished with the privatisation and sales of land. The restricted access makes it difficult for Māori to engage in resource management decisions relating to these areas because it is very challenging to assess any impacts associated with landscape modification. Restricted access has not impacted on the cultural significance of these inaccessible areas and the inherited responsibility of Māori to uphold the values and care for their taonga remains the same to the present day. The methods described in this paper represent one tool that is now available to help Māori overcome the loss of access, by providing estimated impacts of landcover changes through space and time in areas they are unable to access. These spatiotemporal impacts can then be assessed by Māori and used to identify management actions. Having developed a modelling approach that Māori can use to understand how they might evaluate adjacent areas in a catchment that have not been assessed, the temptation is to extrapolate model results up to the largest possible spatial scale: for example, at a regional or national scale. We caution against this temptation because our results are consistent with Crow et al. (Citation2018) and suggest relationships will change between catchments, hapū and iwi groups.
Conclusions
The results show that changes in landcover influence the ability of the landscape to support Māori values, and in turn the health and wellbeing of Māori. We note that this is the first attempt to examine quantitative relationship between Māori values and landcover. Having established a modelling approach, the next stage would be to explore inter-relationships between other land use cover categories and Māori values. The research could progress in three areas. Firstly, there may be stronger relationships for specific native vegetation categories. However, this would require further cultural assessments, with a greater discrimination of land use/landscape categories. Secondly, having these results for the Waitaki, Kakaunui and the Hakatere catchments enables whānau to refine their iwi management plans to target specific management interventions across the catchments. Thirdly, tools could be developed that identify how multiple cultural values are simultaneously impacted by changing environmental conditions.
Acknowledgements
We thank two anonymous referees and Dr Clive Howard-Williams who provided us with constructive feedback that helped improve this manuscript.
Disclosure statement
No potential conflict of interest was reported by the author(s).
Additional information
Funding
Notes
1 Please note that we have focused on plans prepared by papatipu Rūnanga within the rohe of Ngāi Tahu as the data that were analysed were all collected by Ngāi Tahu whānau (see www.ngaitahu.iwi.nz).
2 The descriptions that Māori use to score this indicator specifically refer to the extent of native landcover and the degree of modification that whanau have observed / experienced.
3 For example see https://www.stuff.co.nz/business/farming/108903320/controversial-simons-pass-dairy-development-done-well
4 The Rūnanga is a local group that represents those who hold the inherited rights and responsibilities to care for the lands, waters, resources and people within a defined area.
References
- Berkes F, Colding J, Folke C. eds. 2002. Navigating social-ecological systems: building resilience for complexity and change. Cambridge: Cambridge University Press.
- Crow SK, Tipa GT, Booker DJ, Nelson KD. 2018. Relationships between Māori values and streamflow: tools for incorporating cultural values into freshwater management decisions. New Zealand Journal of Marine and Freshwater Research. 52:626–642. doi: 10.1080/00288330.2018.1499538
- Durie M. 1995. Ngā Matatini Māori: Diverse Māori Realities presented at the Wānanga Pūrongo Kōrerorero: Māori Health Framework Seminar. Turangawaewae Marae, Ngaruawahia.
- Environment Canterbury. 2015. Waitaki limit setting process: technical overview. Environment Canterbury Report No. R15/99 122 p.
- Kawharu M. 2002. Whenua: managing our resources. Auckland: Reed.
- Kitson J. 2014. Te Ao Marama Inc, Murihiku Rūnanga Advisory Group. 2014. Ngāi Tahu ki Murihiku Freshwater Management Context. Client Report Prepared by Kitson Consulting Ltd 64.
- Legendre P. 1990. Quantitative methods and biogeographic analysis. In: D. J. Garbary, R. R. South, editor. Evolutionary biogeography of the marine algae of the north NATO ASI series, Volume G 22. Berlin, Germany: Springer-Verlag; p. 9–34.
- Legendre P, Fortin MJ. 1989. Spatial pattern and ecological analysis. Vegetatio. 80:107–138. doi: 10.1007/BF00048036
- Mihinui H. 2002. Hutia te rito o te harakeke: a flaxroot understanding of resource management. In: M. Kawharu, editor. Whenua: managing our resources. Auckland: Reed; p. 21–34.
- New Zealand Government. 1991. Resource management act. New Zealand Government. http://www.legislation.govt.nz/act/public/1991/0069/latest/whole.html.
- New Zealand Land Cover Database v4.1. 2019. https://lris.scinfo.org.nz/layer/48423-lcdb-v41-land-cover-database-version-41-mainland-new-zealand/.
- Ngāi Tahu ki Murihiku. 2008. Te Tangi a Tauira: the Cry of the People.
- Posey D. 1999. Cultural and Spiritual Values of Biodiversity: United Nations Environment Programme Intermediate Technology Publications/UNEP, London.
- Rainforth HJ, Harmsworth GR. 2019. Kaupapa Māori Freshwater Assessments: A summary of iwi and hapū-based tools, frameworks and methods for assessing freshwater environments.
- Snelder TH, Biggs BJF. 2002. Multiscale river environmental classification for water resources management. Journal of the American Water Resources Association. 38:1225–1239. doi: 10.1111/j.1752-1688.2002.tb04344.x
- Stevens S. 1998. Conservation through cultural survival. Washington, DC: Island Press; p. 678.
- Stewart-Koster B, coauthors N. 2010. The use of Bayesian networks to guide investments in flow and catchment restoration for impaired river ecosystems. Freshwater Biology. 55:243–260. doi: 10.1111/j.1365-2427.2009.02219.x
- Te Rūnanga o Ngai Tahu (TRoNT). 2003. Ki Uta ki Tai – Mountains to the sea natural resource management: a scoping document for developing mountains to the sea natural resource management tools for Ngäi Tahu. Christchurch (New Zealand): Te Rūnanga o Ngai Tahu.
- Tipa GT, Nelson KD. 2012. Identifying cultural flow preferences: The kakaunui river Case study where Manawhenua identified their flow preferences. Journal of Water Resources Planning and Management. 138:660–670. doi: 10.1061/(ASCE)WR.1943-5452.0000211
- Tipa GT, Nelson KD, Home M, Tipa M. 2016. Policy responses to the identification by Maori of flows necessary to maintain their cultural values.
- Tipa GT, Teirney L. 2003. A Cultural Health Index for Steams and Waterways: indicators for recognising and expressing cultural values Ministry for Environment Technical Paper 75 83 pp.
- Tipa GT, Teirney L. 2006. Using the Cultural Health Index: How the assess the Health of Streams and Waterways. Ministry for Environment Reference ME711 62.
- Tipa GT, Williams EK. 2015. The Cultural Health of the Waitaki Catchment DRAFT,unpublished report for Environment Canterbury.
- Williams J. 2004. ‘E PÄKIHI HAKINGA A KAI': An examination of pre-contact resource management practice in Southern Te Wäi Pounamu A thesis submitted for the degree of Doctor of Philosophy of the University of Otago (Te Whare Wänanga o Otägo), Dunedin, New Zealand. July 2004.
- Williams EK, Watene-Rawiri EM, Tipa GT. 2018. Empowering indigenous community engagement and approaches in lake restoration: an Aotearoa-New Zealand perspective. In: D. P. Hamilton, K. J. Collier, J. M. Quinn, C. Howard-Williams, editor. Lake Restoration Handbook. New York, USA: Springer; p. 599.
- Wood SN. 2011. Fast stable restricted maximum likelihood and marginal likelihood estimation of semiparametric generalized linear models. Journal of the Royal Statistical Society. 73:3–36. doi: 10.1111/j.1467-9868.2010.00749.x
- Zuur AF, Ieno EN, Walker NJ, Saveliev AA, Smith GM. 2009. Mixed effects models and extensions in Ecology with R. New York, USA: Springer.
Appendices
Appendix 1. Landcover Database classes and coverage in 2001 and in 2012. Categories are sorted from the largest increase in coverage (top) to the largest decrease in coverage
Appendix 2. Correlations between land use covariates and distribution of data observations