
 ?Mathematical formulae have been encoded as MathML and are displayed in this HTML version using MathJax in order to improve their display. Uncheck the box to turn MathJax off. This feature requires Javascript. Click on a formula to zoom.
ABSTRACT
Īnanga (Galaxias maculatus) is a widespread freshwater fish, found around coastal New Zealand, Chatham Islands, southern Australia and southern South America, exhibiting both diadromous and land-locked life history patterns. We assessed population size structure, size at maturity, timing of reproduction, and post-reproductive survival in the Waikouaiti and Kakanui rivers, two regionally important G. maculatus populations in southern New Zealand. Size at maturity varied between rivers and sexes, with males generally maturing at smaller sizes than females. The timing of reproduction and recruitment was observed to vary across a relatively small spatial scale. Population length-frequencies indicated that both populations exhibited annual population dynamics, with most individuals spawning in their first year, then apparently dying soon afterwards (as indicated by a marked drop in post-spawning abundance). However, a few individuals with recently spent or resting gonads were present over the winter months, indicating some post-spawning survival. There was a lower frequency of exceptionally large (putatively 1+) individuals than reported for other populations around New Zealand and elsewhere, suggesting over-winter survival following spawning varies. Based on the variation in life history characters over small spatial scales, we suggest that management of regionally important G. maculatus populations should be based on catchment level information.
Introduction
Within species, life history traits may vary due to phenotypic plasticity or genetic variation (Stearns and Koella Citation1986). Where species occupy broad geographic ranges, environmental heterogeneity has been shown to influence a wide variety of life history traits including size at maturity (Rijnsdorp Citation1989), timing of reproduction (Taylor Citation2002), and mode of parity (Leggett and Carscadden Citation1978). This variation may drive changes to population demography, reproductive output, and resilience to disturbance (Schaffer Citation1974).
Galaxias maculatus (Jenyns 1842) is one of the world’s most widely distributed freshwater fishes, occurring across southern Australia, New Zealand, southern South America and various offshore islands including the Chatham and Falkland Islands, between 28 and 55 °S (Berra et al. Citation1996; Waters et al. Citation2000). Galaxias maculatus is most commonly amphidromous, occurring in slow flowing coastal rivers with a migratory marine larval stage (Stevens et al. Citation2016). Typically, fish in amphidromous populations migrate downstream to spawn close to estuaries on autumn high tides, with larval and early-juvenile fish developing in marine waters over winter, followed by a juvenile ‘whitebait’ migration into fresh water during spring (McDowall Citation1968; Stevens et al. Citation2016). However, G. maculatus exhibit considerable variation in life history patterns across its broad range, with non-diadromous land-locked and potadromous populations being recorded from Australia (Pollard Citation1971; Chapman et al. Citation2006; Morgan and Beatty Citation2006; Barbee et al. Citation2011; Laurenson et al. Citation2012), South America (Barriga et al. Citation2007; Boy et al. Citation2007; Rojo et al. Citation2018) and New Zealand (McDowall Citation1968; David et al. Citation2019). There is currently no published information on the life history of southern South Island, New Zealand inanga populations. Knowledge of life history variation across populations of New Zealand G. maculatus is based mainly on McDowall (Citation1968) and Stevens et al. (Citation2016) who researched G. maculatus in the North Island (Waikanae River) and northern South Island (populations around Christchurch and Westport), respectively. There is currently only one published study on southern South Island populations (Stuart et al. Citation2023) that focussed on diet and growth, rather than life history.
Galaxias maculatus life histories are known to differ on a variety of spatial scales. At large scales, a latitudinal gradient in the timing of reproduction was suggested by Taylor (Citation2002) with reproduction commencing around one month earlier in the South Island of New Zealand than in the North Island. In South America, maximum size also varies with latitude, with an increase in the mean maximum size of G. maculatus as latitude increases (Rojo et al. Citation2018). Additional environmental factors may influence G. maculatus life history – in the northern South Island, spawning occurs one month later on the west coast than the east, which is likely driven by variation in water temperatures between the two coasts (Stevens et al. Citation2016). On finer spatial scales, the date of hatching and inward migration to fresh water may also influence adult reproductive characteristics within regions (Egan et al. Citation2019). Catchment and coastal landscapes may influence dispersal, growth rate and size at inward migration, with fish recruiting to rivers with gradual transitions to the sea (large estuaries) tending to be smaller and older at migration than those from populations recruiting to rivers with abrupt transitions to the sea (Kaemingk et al. Citation2019).
Following McDowall (Citation1968), the management of G. maculatus in New Zealand is generally based on the assumption that the species is semelparous, with individuals dying after spawning in their first year, forming essentially annual populations. As with other aspects of their life history, however, there is increasing evidence that parity in G. maculatus is a plastic trait. Populations in south-western Australia and southern South America have been aged via otolith growth rings and range from entirely annual populations to populations with individuals up to 3+ (Chapman et al. Citation2006; Rojo et al. Citation2018). In New Zealand, otolith ageing of G. maculatus is complicated by the presence of many check marks that have no clear seasonal basis (McDowall Citation1968). However, Stevens et al. (Citation2016) recently demonstrated post-spawning survival across northern South Island populations, which suggests that iteroparous individuals may be present in New Zealand G. maculatus populations.
Life history differences across G. maculatus populations may have important implications for optimising population management. Goodman (Citation2018) identified lack of data on the variation in timing of spawning as a key knowledge gap for the management of New Zealand G. maculatus. Variation in the frequency of post-spawning survival may have substantial implications for population reproductive output. Stevens et al. (Citation2016) suggested that the largest 5% of G. maculatus likely represented fish that had survived spawning in the previous year, and that these large individuals could disproportionately contribute to 18% of total population egg production.
In this study we aim to broaden the spatial coverage of detailed examinations of the life history of New Zealand G. maculatus. We examine population dynamics, growth, and size at maturity, in addition to seasonal trends in gonad development, and relative condition, of Otago G. maculatus. Based on life history patterns seen across broad latitudinal gradients in South America (Barriga et al. Citation2007; Boy et al. Citation2007; Rojo et al. Citation2020), we expected that the studied populations in southern New Zealand would be primarily diadromous, with most fish spawning in their first year of life and displaying semelparity (see also Stevens et al. Citation2016). Given the higher latitude of this population compared to that in Stevens et al. (Citation2016), a relatively higher proportion of older fish (>1 year) might be expected, resulting in an increased average size (see Rojo et al. Citation2020). This study provides further information on the life history variation of New Zealand G. maculatus. Detailed understanding of the life history of two southern populations forms an important baseline for effective national management of G. maculatus, enabling refinement of timing of seasons and other management strategies for whitebaiting (capture of juvenile fish for consumption) (see Goodman Citation2018).
Materials and methods
Study site
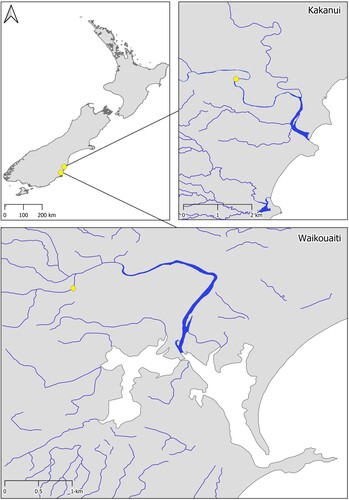
Galaxias maculatus were sampled from the Kakanui (45°09′58.3″S 170°52′19.8″E) and Waikouaiti Rivers (45°36′28.8″S 170°37′22.8″E) in Otago, New Zealand (). These populations were selected as both rivers contain important spawning sites for the species, contributing approximately 63% to the total identified major G. maculatus spawning areas within Otago (Taylor Citation2002). Sample sites were located ∼ 2 km, and 600 m upstream of the spawning areas, which occur at the limit of saltwater intrusion, for the Kakanui and Waikouaiti Rivers, respectively. Sample sites were 50 m long and selected to target likely G. maculatus habitat, being fringed with riparian vegetation (exotic rank grasses) and with similar hydrology (slow flowing pools, backwaters and eddies).
Figure 1. Location of sampling areas in southern New Zealand, in the Kakanui and Waikouaiti Rivers.
Fish collection and processing
Galaxias maculatus were sampled monthly from the Kakanui and Waikouaiti Rivers between October 2018 and September 2019. Fish were collected using a beach seine (10 mm stretched mesh size) with a smaller seine (1 mm mesh size) as a secondary net, encircling the pocket of the large seine, to prevent smaller individuals from escaping during landing. A random subsample of 40 individuals from each sampling date and river were returned to the laboratory and euthanised upon arrival with 1 ml/L 2-phenoxyethanol. Sampling effort was variable, continuing as long as it took to collect 40 individuals, with the exception of the August sample in the Kakanui River where intensive sampling resulted in the capture of only four fish. Individuals were weighed (whole body wet weight (M)) to the nearest 0.001 g, and total length was measured to the nearest 1 mm. They were then dissected, and the gonads retrieved and weighed to the nearest 0.001 g (MG). The gonads were macroscopically staged according to a modified version of the criteria presented in Stevens et al. (Citation2016) (Table S1). A subsample of gonads from macroscopically identified post-spawning fish was fixed in 10% neutral buffered formalin for histological confirmation. Tissue was dehydrated in a series of ethanol baths, cleared in xylene, and vacuum embedded in Surgipath Paraplast (Leica Biosystems www.leicabiosystems.com). Tissue was sectioned at 5 µm and stained with haematoxylin and eosin (Figure S1).
All fish were collected under University of Otago Animal Ethics approval AUP-18-197.
Condition indices
Reproductive investment was expressed as the gonadosomatic index (GSI), that is the ratio of gonadal to somatic tissue and was calculated as:
(1)
(1) Body condition was assessed using Le Cren’s (Citation1951) relative condition index, modified as suggested by Froese (Citation2006).
(2)
(2) An individual’s relative condition (WR) is expressed as a ratio of their body weight (M) to their expected body weight based on the length–weight relationship for the species. Le Cren’s original formulation included the length–weight relationship for the population, which precluded comparison between populations. Here, the length–weight coefficients (a, b) represent the geometric mean of all available length–weight relationships for New Zealand G. maculatus allowing comparison between populations. Population length–weight relationships are derived for both rivers in this study and an additional 8 populations from the northern South Island (summarised as west and east coast length weight relationships in Stevens et al. (Citation2016)) (Table S2).
Statistical analysis
All statistical analyses were performed in the R Statistical Computing Environment (R Core Team Citation2021). Differences in gross morphology (length, weight) between rivers were assessed with linear models. Model residuals were assessed to ensure they met assumptions of heterogeneity of residual variance and residual normality. Data were log transformed where necessary. The length–weight relationship for each population was quantified using linear regression on log-transformed length–weight data (Figure S2). Only individuals that could be sexed were included, as strong differences in allometric growth patterns between life stages can bias the length–weight coefficients. Variation in relative condition across months, rivers, and sexes was assessed using ANOVA, the final model included month (12 levels), sex (2 levels), and river (2 fixed levels) as explanatory factors with an interaction term between month and river. Tukey’s HSD was used to test for differences between individual sampling dates. The GSI model had unfixable heteroscedasticity in the residual variance, so the Kruskal–Wallis test was used to test for differences between months and sexes. Sex ratios were assessed using χ2 tests.
Growth of the first cohort was modelled by fitting a von Bertalanffy growth model to length at date of capture data for each river. The growth model was fitted using non-linear least squares implemented with the R function nls. Plausible starting values were generated with the vbStarts function of the FSA package (Ogle et al. Citation2021). We compared the growth of males and females within rivers by fitting a general model where parameters differed with sex and a constrained model where sexes shared growth parameters. We did not include models that constrained only some of the parameters as this can lead to biased parameter estimates (Pardo et al. Citation2013). Model performance was compared using ANOVA.
Length-at-maturity ogives were constructed separately for males and females from each river through logistic regression (See Table S1 – Modifed from Stevens et al. (Citation2016) and Pollard (Citation1972) using the glm function in R). We included fish captured in the extended spawning period between January and May (see Results). Fish were classified as immature (macroscopic stages 1–3) or mature (stages 4–8) (See Table S1 – Modified from Stevens et al. (Citation2016) and Pollard (Citation1972)). Stage 1 fish, which were unsexed juveniles, formed a small proportion of the sample in January and were included in both male and female regressions. Differences in length at maturity between males and females, and between rivers were examined using likelihood ratio tests. 95% confidence intervals for predicted lengths at maturity were constructed using bootstrap resampling (n = 10,000) for all maturity ogives except the male Waikouaiti River curve. Due to a sharp delineation in mature and immature fish sizes in this sample, a proportion of the bootstrap replicates (∼ 25%) experienced separation issues resulting in a breakdown of the maximum likelihood estimator, and biased parameter estimates. As such, confidence intervals for this sample were constructed on the link scale and back-transformed using the inverse link function.
Results
General morphology
Overall, 924 G. maculatus were captured during the October 2018–September 2019 study period. This comprised 130 females (29.3%), 170 males (38.3%), and 144 unsexed individuals (32.4%) in the Kakanui River, and 118 females (24.6%), 142 males (29.6%), and 220 unsexed individuals (45.8%) in the Waikouaiti River. Males were generally smaller than females, with mean lengths of 69.9 mm (range 51–102 mm) for males, and 76.1 mm (51–111 mm) for females (F1,556 = 64.1, P < 0.001), and weights of 1.7 g (0.5–4.5 g) and 2.1 g (0.5–7.3 g), respectively (F1,556 = 40.2, P < 0.001). There was no difference in mean length or weight between rivers for males or females. However, unsexed individuals were shorter (F1,362 = 11, P = 0.001) and lighter (F1,362 = 14.3, P < 0.001) in the Waikouaiti River than in the Kakanui River. We observed a decline in length of stage 6 (ripe) individuals as the breeding season progressed in the Waikouaiti River (F1,71 = 9.8, P = 0.003) but not in the Kakanui River.
Over the entire sample period, the sex ratio was significantly male biased in the Kakanui River (χ2 (1) = 5.3, P = 0.02), but not in the Waikouaiti River (χ2 (1) = 2.2, P = 0.14). Within months, we detected a significant male bias in February (χ2 (1) = 8.1, P = 0.004), and June (χ2 (1) = 4.6, P = 0.03) in the Kakanui River, and in February (χ2 (1) = 16.9, P < 0.001), and August (χ2 (1) = 6.4, P = 0.01) in the Waikouaiti River.
Cohorts and growth
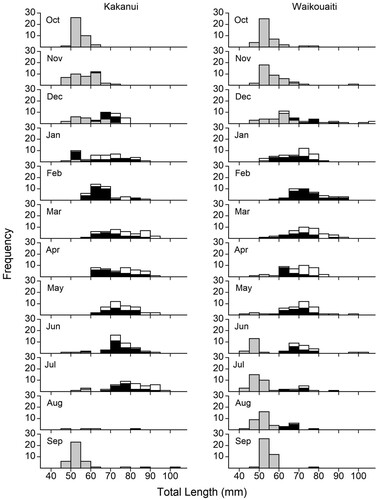
The length-frequency histograms for both rivers revealed the presence of two major cohorts during the sample year (). The initial October 2018 sample was dominated by a cohort of unsexed juveniles in both rivers. This cohort formed the major proportion of the G. maculatus population in both rivers between October 2018 and June 2019. The timing of the recruitment of the second observed cohort varied between the rivers. In the Kakanui River, the second cohort recruited relatively late in the year and there was little overlap between the two cohorts. A few post-settlement juveniles were observed from June 2019, but they did not form a distinct cohort until September 2019 (modal length 50 mm cf. 85 mm). Fish densities were exceptionally low in the Kakanui River in August and intensive sampling resulted in the capture of only four individuals (A). In the Waikouaiti River, post-settlement juveniles began recruiting earlier and were observed in low numbers from April–May 2019. They formed a distinct cohort from June 2019 (modal length 45 mm cf. 65 mm). The two cohorts overlapped in time between June and August 2019, and by September, the second cohort was dominant (modal length 55 mm) with only one fish from the first cohort observed (modal length 75 mm) (B). In both rivers we observed rare instances of comparatively large individuals (95–111 mm) that did not appear to be members of the smaller (length) cohorts. These large fish formed a very small component of both populations, with 11 individuals greater than 95 mm observed (1.2%) and 6 individuals greater than 100 mm (0.6%) in both rivers combined. Only one of the fish greater than 95 mm was male (102 mm).
Figure 2. Length percentage frequency histograms for Galaxias maculatus in A, Kakanui River, and B, Waikouaiti River across the 2018–2019 sampling period. Grey bars indicate unsexed juveniles, black bars males, and white bars females.
Total length at date of capture of the first cohort was fitted to the von Bertalanffy growth model for each population and sex (). Males and females had significantly different growth curves in both rivers (Kakanui River: F3,488 = 13.3, P < 0.001, Waikouaiti River: F3,450 = 7.8, P < 0.001). In both rivers females were predicted to be larger than males on the same sampling occasion. The first cohort in the Kakanui River was clearly delineated and the growth model fitted well (A). Estimated growth parameters in the Kakanui River were, for males: L∞ = 95.1 ± 15.9 mm, K = 0.08 ± 0.05, t0 = −8.4 ± 2.9, and for females: L∞ = 100.4 ± 13.9 mm, K = 0.11 ± 0.05, t0 = −5.7 ± 1.9.
Figure 3. Length at date of capture for Galaxias maculatus in A, the Kakanui River, and B, Waikouaiti River. Lines represent von Bertalanffy growth predictions for the 1st cohort, for females (dotted line) and males (solid line). Grey circles represent unsexed juveniles, closed circles represent males, and open circles represent females.
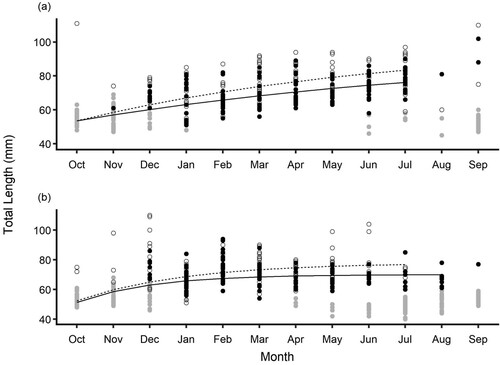
The first cohort was less clearly delineated in the Waikouaiti River, and the model residuals indicated there was a substantial variation in length not adequately captured by the models for both males and females. Analysis of the residuals indicated high variance in the December sample which contained many larger-than-predicted individuals. A clear trend was also evident in the residuals that corresponded to the decrease in mean length of the first cohort between March and April 2019 (B). Estimated growth parameters were, for males: L∞ = 70.1 ± 1.1 mm, K = 0.49 ± 0.1, t0 = −1.66 ± 0.5, and for females: L∞ = 78 ± 2.7 mm, K = 0.34 ± 0.1, t0 = −2.3 ± 0.8. An additional growth model using only data from October 2018–March 2019 was fitted for the Waikouaiti River cohort before the observed reduction in the length of the first cohort. Using this restricted data set, there was insufficient evidence to determine if male and female growth patterns were different, and sexes were combined. Growth parameters for the Waikouaiti River G. maculatus using the truncated data were L∞ = 99.9 ± 24.4 mm, K = 0.13 ± 0.09, t0 = −4.8 ± 2.
Relative condition
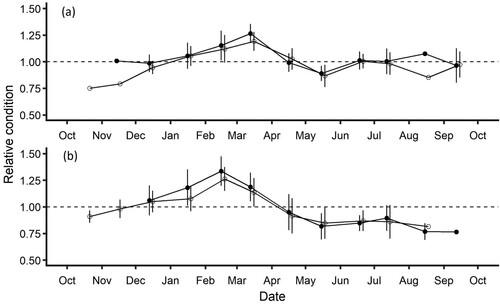
Overall, the relative condition of G. maculatus displayed similar temporal patterns across both rivers and sexes (). There was significant variation in relative condition between months, with peak condition occurring in late summer just prior to the beginning of the peak spawning period (F11, 547 = 52.48, P < 0.001). While there was no overall difference in relative condition between rivers (F1, 546 = 0.59, P = 0.44), relative condition peaked one month earlier in Waikouaiti River (February) than in the Kakanui River (March) with relative condition significantly higher in the Waikouaiti River than the Kakanui River in February (Tukey’s HSD, P < 0.001). Males had a significantly higher relative condition than females across the sampling period, however the magnitude of this effect was minimal () (F1, 547 = 7.12, P = 0.007). After the cessation of the spawning period, fish did not recover relative condition in the Waikouaiti River, but there was significant increase in relative condition between May and June in the Kakanui River (Tukey’s HSD P < 0.001: Sexes pooled due to unequal sample size).
Figure 4. Temporal variation in Galaxias maculatus relative condition between October 2018 and September 2019, for A, Kakanui River, and B, Waikouaiti River. Males are shown as closed circles, and females as open circles, points offset for clarity. The dotted line indicates the expected weight at length from the equation K = M(0.0023 TL3.3297)−1.
Reproduction
The spawning period was broader and less-sharply delineated in the Waikouaiti River than in the Kakanui River. In the Kakanui River, GSI began increasing in January and was essentially zero by May. In contrast, GSI began increasing in December and some individuals displayed high GSIs until May in the Waikouaiti River (). For males, peak median GSIs were observed in March in both rivers, peaking at 32% and 28% for the Kakanui River and Waikouaiti River respectively. In females, GSIs peaked at 24% in the Kakanui River in April, and at 23% in February in the Waikouaiti River (). Across the December – May period when GSI was elevated, males had significantly higher GSIs than females in the Kakanui River (H (1) = 4.35, P = 0.04), and the Waikouaiti River (H (1) = 22.73, P < 0.001).
Figure 5. Box and whisker plots of seasonal variation in GSI for Galaxias maculatus collected between October 2018 and September 2019, for A, Kakanui River males, B, Kakanui River females, C, Waikouaiti River males, and (d) Waikouaiti River females.
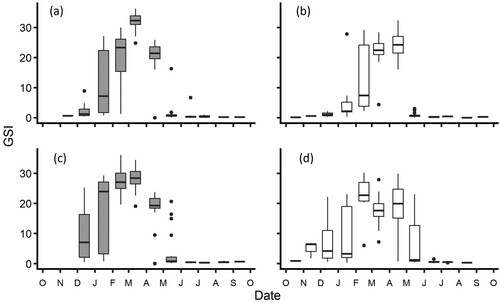
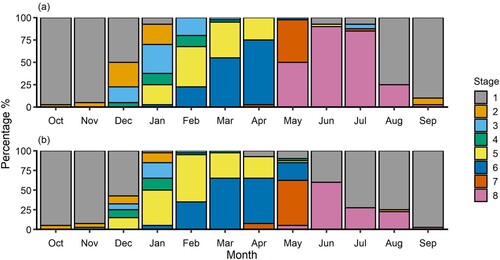
Fish in spawning condition (macroscopic stage 6) formed a large proportion of the population between February and April in the Kakanui River, and between February and May in the Waikouaiti River (). The proportion of spawning individuals (macroscopic stage 6) peaked in April in the Kakanui River (72%) and in March in the Waikouaiti River (65%). Post-spawning fish (macroscopic stages 7 and 8) were first observed in April in both rivers and formed substantial proportions of the populations between May and August (). By September, post-spawning fish comprised only 2% of the sample in both rivers and the population was dominated by the second cohort of juveniles that had recently returned to freshwater ( and ).
Figure 6. Proportion of Galaxias maculatus gonads in each macroscopic maturity stage from October 2018–September 2019 for A, Kakanui River, and B, Waikouaiti River. Macroscopic maturity stages defined in Table S1 and modified from Stevens et al. (Citation2016) and Pollard (Citation1972). Stages: 1 – immature; 2 – immature developing; 3 – Developing; 4 – maturing; 5 – mature; 6 – spawning; 7 – recently spent; 8 – recovering spent. For further detail refer to the supplementary material, Table S1.
Size at maturity
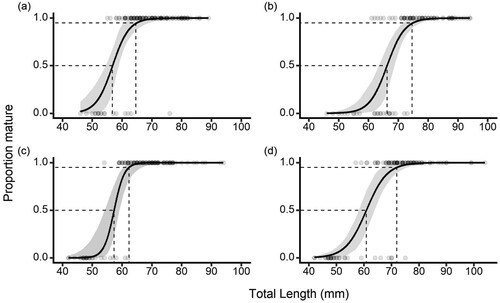
The smallest sexually mature fish (Stage 4+) were found in the Waikouaiti River; the smallest male was 54 mm and the smallest female was 57 mm. There were significant differences in the length at maturity between males and females in the Kakanui River (χ2 (4) = 34.52, p < 0.001) and Waikouaiti River (χ2 (4) = 17.16, p = 0.02) populations, with males maturing at smaller sizes than females. There was no significant difference between rivers for the regressions for males (χ2 (2) = 2.33, p = 0.3), but females in the Waikouaiti River matured at a smaller size than females in the Kakanui River (χ2 (2) = 7.12, p = 0.03). The lengths at 50% and 95% maturity (L50 and L95, (95% CI)) were; Kakanui River males L50 = 56.9 (54.6–58.9), L95 = 64.6 (60.4–68.9) mm, Kakanui River females L50 = 66.2 (63.5–68.6), L95 = 74.6 (71.4–77.7) mm, Waikouaiti River males L50 = 57.3 (54.1–59.1), L95 = 62.3 (60.4–66.8) mm, and Waikouaiti River females L50 = 61.1 (58.3–64.0), L95 = 71.9 (66.6–75.6) mm ().
Figure 7. Length at maturity curves for Galaxias maculatus for A, Kakanui River males, B, Kakanui River females, C, Waikouaiti River males, and D, Waikouaiti River females. Dashed lines indicate the lengths at 50% and 95% maturity, shaded bands represent 95% confidence intervals. Points represent the individual fish length and maturity data used in each logistic regression. Curves fitted as (a) , (b)
, (c)
, (d)
.
Discussion
As in most other populations of G. maculatus in New Zealand (McDowall Citation1968; Stevens et al. Citation2016), Australia (Pollard Citation1971; Chapman et al. Citation2006; Barbee et al. Citation2011; Laurenson et al. Citation2012) and South America (Barriga et al. Citation2007; Boy et al. Citation2007; Rojo et al. Citation2018), the two Otago populations appear to display essentially annual population dynamics. The length-frequency analysis indicated the presence of two main cohorts across the sampled year. The first cohort was observed as post-settlement juveniles in October 2018, which subsequently matured and spawned by May 2019. The second cohort was formed from the following years post-settlement juveniles and began appearing in June and September in the Waikouaiti and Kakanui rivers respectively. The length-frequency data indicated that only a few individuals lived for more than 1 year. In both rivers, there was a small number of very large individuals (> 95 mm) that were not part of the identified major cohorts, similar to patterns elsewhere in New Zealand (McDowall Citation1968; Stevens et al. Citation2016). However, in land-locked populations in Western Australia (Chapman et al. Citation2006) and diadromous populations in southern South America (Rojo et al. Citation2018), individuals may live for up to 3 years or longer, possibly due to slow growth in low productivity environments (Chapman et al. Citation2006; Rojo et al. Citation2018).
The age and reproductive status of these very large individuals remains unclear. Stevens et al. (Citation2016) found that many G. maculatus survive the period immediately following spawning and suggested that the largest individuals (5% of the population) may have been those which spawned the previous year. In contrast, Burnet (Citation1965) suggested that large fish were those that did not mature in their first year, given around 3% of fish did not mature in their first year. In this study, we observed a high proportion of spent fish in both populations in the early winter period, indicating some individuals survive the immediate post-spawning period, consistent with Stevens et al. (Citation2016). While we did not quantify it directly, population density was observed to fall dramatically after the main spawning period in April, suggesting that the surviving post-spawning individuals accounted for only a fraction of total spawners. By September, individuals from the first cohort were rare, comprising only 2% of the population.
Despite observing post-spawning survival similar to Stevens et al. (Citation2016), we observed substantially fewer fish in the largest size classes. Stevens et al. (Citation2016) observed that females over 100 mm comprised 5.5% of the sampled populations, whereas only 0.01% of individuals sampled were >95 mm in the Otago populations. This may indicate that over-winter survival following spawning differs between regions. We found no evidence that the largest fish were those that had delayed maturation, as suggested by Burnet (Citation1965). All fish captured (except for several early returning juveniles) were mature or had spawned by April. Alternatively, large individuals may be faster growing rather than older fish. While New Zealand G. maculatus cannot be aged by whole otolith translucent zones, ageing of individuals < 100 mm is possible by otolith daily increment counts. The relationship between size and age of G. maculatus in Golden Bay at the north of the South Island indicates that some larger individuals are faster growing rather than older (Egan et al. Citation2019).
Size at date of capture of fish in the Kakanui River population matched the von Bertalanffy growth model. Predicted growth and model residuals were consistent with a single age cohort growing steadily between October 2018 and July 2019. The growth parameters were significantly different between sexes, indicating that females grew faster and attained a larger asymptotic size than males. This is in contrast to Rojo et al. (Citation2018) who found no difference in growth parameters between sexes in Argentinian G. maculatus. In New Zealand, the largest G. maculatus are almost exclusively female (Current study; McDowall Citation1968; Stevens et al. Citation2016). McDowall (Citation1968) found that while most fish in the largest size classes were female, there were no consistent differences in mean size, suggesting that growth rates across sexes were similar, and the largest females were those that had either survived spawning in previous years or delayed maturity, indicating sexual differences in post-spawning survival or delayed maturity. In contrast, the faster growth rate and larger asymptotic size of females observed here indicates that large sizes may be achieved without sexual differences in post-spawning survival. Additionally, we found no evidence of female survival bias in post-spawning fish.
The poor fit of the fish in the Waikouaiti River population to the von Bertalanffy growth model indicates that more complex demographic patterns may be occurring. When fitted to the whole period the first cohort was present, we observed substantially lower L∞ values for both sexes in the Waikouaiti River than in the Kakanui River. Underestimation of L∞ may occur when population mortality is high, and the majority of the fish do not reach the asymptotic size (Francis Citation1988). In this case, the low L∞ estimates are likely due to the reduced mean size of the cohort as the season progressed. Reduction of the mean size of a cohort as the breeding season progresses has also been observed in Patagonian G. maculatus (Boy et al. Citation2007). Possible explanations include post-spawning mortality and migration.
The observed decline in total length during the spawning season in the Waikouaiti River but not in the Kakanui River indicates that local environmental factors may be driving variation in outmigration or post-spawning mortality. The Kakanui River population was able to successfully recover body condition after spawning, whereas relative condition remained low throughout the winter in the Waikouaiti River population, suggesting food limitation may be occurring. It is possible that the earlier recruitment of juveniles in the Waikouaiti River may have led to inter-cohort competition and reduced food availability for the adults. Due to relatively limited differences in size and behaviour between post-settlement juveniles and adults (relative to many other larger fish species), there is substantial dietary overlap (McDowall Citation1968; Catlin et al. Citation2019; Manosalva et al. Citation2021). Semelparity driven by inter-cohort competition has been observed in medaka Oryzias latipes, in which juvenile recruitment negatively impacts adult survival (Edeline et al. Citation2016).
In addition to the likely underestimation of L∞, there were more large individuals in the Waikouaiti River populations early in the year compared to model predictions for the Waikouaiti River or the observed Kakanui River data. This variation in size may reflect the earlier settlement of juveniles in the Waikouaiti River. The marine – freshwater transition is a stressful period for juveniles, as they face osmotic stress, reduced feeding, and substantial morphological changes to the structure of the digestive tract and reductions in total length (McDowall Citation1968). The impact of this period is seen in reduced growth for at least 3 weeks immediately following freshwater entry (Jung et al. Citation2009). As such, while growth of the second cohort over the winter period was relatively slow, early recruitment during the winter may allow for faster growth during the spring compared to fish recruiting during the main spring recruitment period.
The maximum total length found here (111 mm Kakanui River: 110 mm Waikouaiti River) was smaller than what has been reported for other New Zealand populations with the exception of the Mokihinui River where the largest individual was 105 mm (summarised in McDowall Citation1968; Stevens et al. Citation2016). There is no evidence that G. maculatus maximum size increases with latitude in New Zealand, as observed for South American populations (Rojo et al. Citation2018). Mean size at maturity curves have not been constructed previously for New Zealand G. maculatus, however, mature fish have been reported to span all length classes, indicating there is substantial within-population variation (McDowall Citation1968; Stevens et al. Citation2016). Such variation in size at maturity has also been observed in diadromous and non-diadromous G. maculatus populations from Australia (Chapman et al. Citation2006; Laurenson et al. Citation2012), suggesting that varying combinations of site-specific factors influence maximum size in New Zealand (McDowall Citation1968; Stevens et al. Citation2016) and Australia (Chapman et al. Citation2006; Laurenson et al. Citation2012) where G. maculatus range across a narrower latitudinal range compared to South America (Rojo et al. Citation2018).
Alternatively, the small maximum size observed in the Kakanui River and Waikouaiti River populations may be due to density-dependent effects on growth. Strong density-dependent growth has recently been demonstrated to occur in West Coast New Zealand – populations closed to whitebait fishing had adult densities 10 times higher than populations open to fishing, with correspondingly slower growth and a higher proportion of smaller individuals (Watson et al. Citation2021, Citation2022). However, while density-dependent effects may lower average size, the effect on maximum size remains unclear. Many of the largest fish (up to 152 mm) observed by Watson et al. (Citation2021) were from high density populations closed to fishing, and substantially larger than the maximum size recorded in this study. Further study is needed to assess how density-dependent growth may influence maximum size in G. maculatus and the impact this may have on population life history and reproductive output.
In this study we assessed the life histories of two populations of G. maculatus in Otago, New Zealand. The populations were chosen as the catchments in which they occurred are known to be two of the most important whitebaiting streams in Otago, with high abundances of adults and extensive spawning habitat. We confirmed that a proportion of Otago G. maculatus survive the period immediately post-spawning, as had been recently documented in populations from the northern South Island (Stevens et al. Citation2016). It remains unclear what influences post-reproductive survival in the species and whether many fish are able to survive winter to spawn again. Despite the geographical proximity and similar environmental conditions of the two rivers studied, we identified substantial variation in a variety of key life history parameters. Between rivers we observed differences in the timing of reproduction and recruitment, and the size at maturity. The increasing evidence for plasticity in G. maculatus life histories suggests that management of regionally important G. maculatus populations should be underpinned by specific understanding of the population’s life history at a catchment scale, for example, through perhaps varying the timing of whitebait fishing season to reflect variation of the timing of peak recruitment of juveniles migrating from the sea and into the freshwater population.
Supplemental material
Download MS Word (2.9 MB)Disclosure statement
No potential conflict of interest was reported by the author(s).
Additional information
Funding
References
- Barbee NC, Hale R, Morrongiello J, Hicks A, Semmens D, Downes BJ, Swearer SE. 2011. Large-scale variation in life history traits of the widespread diadromous fish, Galaxias maculatus, reflects geographic differences in local environmental conditions. Marine and Freshwater Research. 62:790–800.
- Barriga J, Battini M, Cussac V. 2007. Annual dynamics variation of a landlocked Galaxias maculatus (Jenyns 1842) population in a Northern Patagonian river: occurrence of juvenile upstream migration. Journal of Applied Ichthyology. 23:128–135.
- Berra TM, Crowley L, Ivantsoff W, Fuerst PA. 1996. Galaxias maculatus: an explanation of its biogeography. Marine and Freshwater Research. 47:845–849.
- Boy C, Morriconi E, Calvo J. 2007. Reproduction in puyen, Galaxias maculatus (Pisces: Galaxiidae), in the southernmost extreme of distribution. Journal of Applied Ichthyology. 23:547–554.
- Burnet AMR. 1965. Observations on the spawning migrations of Galaxias attenuatus (Jenyns): Fisheries Laboratory, Marine Department.
- Catlin A, Collier K, Duggan I. 2019. Diet of juvenile Galaxias maculatus (Galaxiidae) during the upstream migration period in the lower Waikato River, New Zealand. Marine and Freshwater Research. 70:816–823.
- Chapman A, Morgan DL, Beatty SJ, Gill HS. 2006. Variation in life history of land-locked lacustrine and riverine populations of Galaxias maculatus (Jenyns 1842) in Western Australia. Environmental Biology of Fishes. 77:21–37.
- David BO, Jarvis M, Özkundakci D, Collier KJ, Hicks AS, Reid M. 2019. To sea or not to sea? Multiple lines of evidence reveal the contribution of non-diadromous recruitment for supporting endemic fish populations within New Zealand's longest river. Aquatic Conservation. 29:1409–1423.
- Edeline E, Terao O, Naruse K. 2016. Empirical evidence for competition-driven semelparity in wild medaka. Population Ecology. 58:371–383.
- Egan EM, Hickford MJ, Schiel DR. 2019. Understanding the life histories of amphidromous fish by integrating otolith-derived growth reconstructions, post-larval migrations and reproductive traits. Aquatic Conservation: Marine and Freshwater Ecosystems. 29:1391–1402.
- Francis R. 1988. Are growth parameters estimated from tagging and age–length data comparable? Canadian Journal of Fisheries and Aquatic Sciences. 45:936–942.
- Froese R. 2006. Cube law, condition factor and weight–length relationships: history, meta-analysis and recommendations. Journal of Applied Ichthyology. 22:241–253.
- Goodman J. 2018. Conservation, ecology and management of migratory galaxiids and the whitebait fishery. Department of Conservation.
- Jung C, Barbee N, Swearer S. 2009. Post-settlement migratory behaviour and growth-related costs in two diadromous fish species, Galaxias maculatus and Galaxias brevipinnis. Journal of Fish Biology. 75:503–515.
- Kaemingk M, Swearer S, Bury S, Shima J. 2019. Landscape edges shape dispersal and population structure of a migratory fish. Oecologia. 190:579–588.
- Laurenson L, French R, Jones P, Ierodiaconou D, Gray S, Versace V, Rattray A, Brown S, Monk J. 2012. Aspects of the biology of Galaxias maculatus. Journal of Fish Biology. 81:1085–1100.
- Le Cren ED. 1951. The length-weight relationship and seasonal cycle in gonad weight and condition in the perch (Perca fluviatilis). The Journal of Animal Ecology. 20:201–219.
- Leggett WC, Carscadden JE. 1978. Latitudinal variation in reproductive characteristics of American shad (Alosa sapidissima): evidence for population specific life history strategies in fish. Journal of the Fisheries Board of Canada. 35:1469–1478.
- Manosalva AJ, Pérez S, Toledo B, Colin N, Habit EM, Górski K. 2021. Variation of stomach content and isotopic niche of puye Galaxias maculatus (Jenyns, 1842) in large river systems of southern Chile. Freshwater Biology. 66:1110–1122.
- McDowall R. 1968. Galaxias maculatus (Jenyns), the New Zealand whitebait: Fisheries Research Division, Marine Department.
- Morgan DL, Beatty SJ. 2006. Use of a vertical-slot fishway by galaxiids in Western Australia. Ecology of Freshwater Fish. 15:500–509.
- Ogle DH, Doll JC, Wheeler P, Dinno A. 2021. FSA: Fisheries Stock Analysis. R package version 0.9.1. https://github.com/droglenc/FSA.
- Pardo SA, Cooper AB, Dulvy NK. 2013. Avoiding fishy growth curves. Methods in Ecology and Evolution. 4:353–360.
- Pollard D. 1971. The biology of a landlocked form of the normally catadromous salmoniform fish Galaxias maculatus (Jenyns). I. Life cycle and origin. Marine and Freshwater Research. 22:91–124.
- Pollard D. 1972. The biology of a landlocked form of the normally catadromous salmoniform fish Galaxias maculatus (Jenyns). III. Structure of the gonads. Marine and Freshwater Research. 23:17–38.
- R Core Team. 2021. A language and environment for statistical computing. R Foundation for Statistical Computing. Vienne: R Foundation for Statistical Computing. https://www.R-project.org/.
- Rijnsdorp A. 1989. Maturation of male and female North Sea plaice (Pleuronectes platessa L.). ICES Journal of Marine Science. 46:35–51.
- Rojo JH, Fernández DA, Figueroa DE, Boy CC. 2020. Phenotypic and genetic differentiation between diadromous and landlocked puyen Galaxias maculatus. Journal of Fish Biology. 96:956–967.
- Rojo JH, Figueroa DE, Boy CC. 2018. Age and growth of diadromous Galaxias maculatus (Jenyns, 1842) in southernmost South America (54° S) including contribution of age classes to reproduction. Environmental Biology of Fishes. 101:1149–1160.
- Schaffer WM. 1974. Optimal reproductive effort in fluctuating environments. The American Naturalist. 108:783–790.
- Stearns SC, Koella JC. 1986. The evolution of phenotypic plasticity in life-history traits: predictions of reaction norms for age and size at maturity. Evolution. 40:893–913.
- Stevens JCB, Hickford MJH, Schiel DR. 2016. Evidence of iteroparity in the widely distributed diadromous fish inanga Galaxias maculatus and potential implications for reproductive output. Journal of Fish Biology. 89:1931–1946.
- Stuart RE, Ingram T, Closs GP. 2023. Growth and diet of inanga (Galaxias maculatus) within a small New Zealand coastal pond system. New Zealand Journal of Marine and Freshwater Research. 57:88–103.
- Taylor MJ. 2002. The National Inanga Spawning Database: trends and implications for spawning site management: Department of Conservation Wellington.
- Waters JM, Dijkstra LH, Wallis GP. 2000. Biogeography of a southern hemisphere freshwater fish: how important is marine dispersal? Molecular Ecology. 9:1815–1821.
- Watson AS, Hickford MJ, Schiel DR. 2021. Freshwater reserves for fisheries conservation and enhancement of a widespread migratory fish. Journal of Applied Ecology. 58:2135–2145.
- Watson AS, Hickford MJH, Schiel DR. 2022. Interacting effects of density and temperature on fish growth rates in freshwater populations. Proceedings of the Royal Society B: Biological Sciences. 289:20211982.