
ABSTRACT
Marine heatwaves (MHWs) have increased worldwide in intensity, frequency, and duration, often with severe impacts on ecologically and socio-economically important coastal habitats. Most MHW studies have focused on summer events in specific regions or global open-water analyses with little consideration to seasonality or spatial biogeography of the nearshore zone. We address this research gap by analysing changes to MHWs across seasons and ecoregions, within 12 nautical miles (NM) of New Zealand’s coastline, an area with high biodiversity and endemism. We used season-specific linear trend analysis with temporal breakpoints between 1982 and 2021 to identify the number of MHW events and MHW days, and mean, maximum, and cumulative intensity of MHWs for New Zealand coastal ecoregions. Across ecoregions, 69.5% of 200 trend analyses increased significantly whereas the remaining 30.5% were unaffected. For the significant increases, temporal breakpoints occurred between 1994 and 2012. We conclude that MHWs have become stronger, longer and more frequent across coastal New Zealand, but with some variability within and between regions. Our trend-analyses could enable retrospective analyses of biological tipping-points and inform management practices that may enhance the resilience of ecoregions yet to face MHW breakpoints or those in the initial stages of major climatic changes.
Introduction
Across the globe, discrete and prolonged, anomalously warm-water events (‘marine heatwaves’, MHWs) have increased in their intensity, frequency, and duration (Frölicher et al. Citation2018; Holbrook et al. Citation2019; Oliver et al. Citation2019; Smale et al. Citation2019; Smith et al. Citation2022). These extreme temperature events can have severe effects on coastal marine ecosystems, which are among the most biodiverse and productive habitats worldwide, compromising community resilience and exceeding species thermal tolerances (Smale et al. Citation2019). For example, dramatic changes have been reported in seaweed beds (Wernberg et al. Citation2013; Wernberg et al. Citation2016; Thomsen et al. Citation2019), seagrass meadows (Strydom et al. Citation2020), and coral reefs (Leggat et al. Citation2019) – habitats that form the base of coastal marine food webs and provide critical ecosystem and socio-economic services (Smith et al. Citation2021). To better understand how these MHWs affect coastal areas inhabited by critical foundation species and with high biodiversity, trend and break point analyses were recently applied to detect seasonal differences in MHW metrics within and between biogeographical regions (Thoral et al. Citation2022). This approach expanded on studies that analysed changes to MHWs either along coastlines (Marin et al. Citation2021) or across seasons (La Sorte et al. Citation2021), and highlighted bioregions (i.e. regions inhabited by communities with shared adaptations to local stressors) vulnerable to MHWs. Understanding seasonality of MHW trends is critical since biological processes like survival, growth, reproduction, and species interactions are seasonally conditioned, and species-specific thermal tolerance often vary seasonally and with ontogeny (Atkinson et al. Citation2020; La Sorte et al. Citation2021). For example, increased temperature during winter can affect spawning events for marine invertebrates like abalone (Schiel et al. Citation2019; Shanks et al. Citation2020), whereas increased summer temperatures can push critical foundation species, such as seaweeds, beyond their thermal optima (Thomsen et al. Citation2019; Tait et al. Citation2021).
Here we used an approach analogous to La Sorte et al. (Citation2021) analysing trends in MHW metrics within and between biogeographical coastal regions of New Zealand using daily Optimum Interpolation Sea Surface Temperature (OISST) data. New Zealand is an ideal case study for this type of analysis because (a) it is biogeographically isolated, (b) has a long north–south coastline covering a wide range of temperatures and ocean current systems, with variable environments such as rocky reefs, sandy beaches, estuaries, exposed bays, cliffs and deep ocean trenches, (c) has high biodiversity with many endemic species (Costello et al. Citation2010), (d) has been exposed to recent extreme MHWs (Salinger et al. Citation2019; Thomsen et al. Citation2019; Thomsen et al. Citation2021a), (e) encompasses 10 globally recognised ecoregions (Spalding et al. Citation2007) with latitudes approaching the sub-tropics and sub-Antarctic, based on species distributional patterns and regional physical, geographic, and hydrographic characteristics, and (f) has a national biogeographical classification system (Department of Conservation Citation2011) that aligns with regional management agencies allowing for relatively clear interpretations and responses.
In the southwest Pacific there has been a general warming of the upper ocean over the poleward edges of western boundary currents, including around New Zealand, since at least 1981 (Coggins et al. Citation2016; Schiel et al. Citation2016; Shears and Bowen Citation2017; Sutton and Bowen Citation2019; Behrens et al. Citation2022; Stevens et al. Citation2022). The shelf and coastal waters adjacent to New Zealand have also warmed but display high variability in magnitude and seasonality, with the strongest warming occurring east of Wairarapa and in the eastern Tasman Sea, and with no evidence of annual warming in northeast New Zealand (Shears and Bowen Citation2017; Sutton and Bowen Citation2019). These different trends are consistent with changes in circulation of the South Pacific gyre under increased South Pacific winds, which modifies warm water flows around New Zealand (Shears and Bowen Citation2017). Although long-term warming increases the likelihood of a MHW developing (Oliver et al. Citation2018; Oliver Citation2019), little is known about the spatial and seasonal variability of MHW trends across near-coastal waters (i.e. within 12 NM) or shelf seas surrounding New Zealand. New Zealand experienced several extreme summer MHWs between 2017 and 2022 (Salinger et al. Citation2019, Citation2020; Bell et al. Citation2022) that resulted in high glacial melting, temporary southern migrations of warm-water fish, and localised extinctions of the iconic fucoid, the southern ‘bull kelp’ in southeastern New Zealand (Thomsen et al. Citation2019; Salinger et al. Citation2020; Thomsen et al. Citation2021a). Recent analyses (Cook et al. Citation2022) of two > 50-year time series of in situ coastal temperatures showed long-term seasonal trends in MHWs that are consistent with broad-scale seasonal warming around New Zealand (Shears and Bowen Citation2017). However, work by Cook et al. (Citation2022) was limited to examining SST data from two long-term coastal stations, leaving substantial gaps in understanding of MHW trends across the wider Exclusive Economic Zone (EEZ, 167,650 km2 territorial sea) surrounding New Zealand. Given the influence of long-term warming on MHW metrics (Oliver et al. Citation2019), it is expected that regional and seasonal variability of MHW trends across New Zealand will reflect the complex pattern of upper ocean warming (Shears and Bowen Citation2017; Sutton and Bowen Citation2019; Cook et al. Citation2022). Projections of New Zealand MHWs under different scenarios have already revealed the largest increases in annual MHW days will occur along the subtropical frontal region (Behrens et al. Citation2022). However, little is known about ecological impacts from MHWs in some regions in New Zealand (Tait et al. Citation2021) and it remains critical to identify whether different ecoregions of New Zealand have been, or are likely to be, affected by MHWs to ensure effective nation-wide management of human activity in these ecoregions and their nearshore resources.
The objective of this study was to quantify seasonal and biogeographical trends in severity (with significance tests and regression slopes) and timing (with temporal change points) of MHW metrics across the 12 NM coastal zone and 200 NM shelf sea region (see https://doi.org/10.6084/m9.figshare.22872902.v1 for the latter) of New Zealand over the 1981–2021 satellite period using robust linear regressions (Hipel and McLeod Citation1994; Pohlert Citation2020; Thoral et al. Citation2022). Finally, we discuss the physical and ecological significances of the highlighted trends in a global, regional, and seasonal context.
Materials and methods
Satellite sea surface temperature product and detection of marine heatwaves
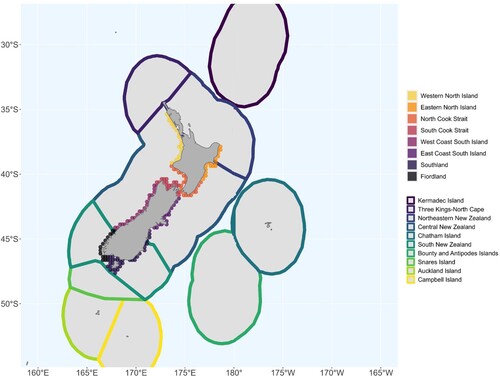
Daily Optimum Interpolation Sea Surface Temperature data (OISST v2.1, Huang et al. (Citation2021)) were obtained between 1st January 1982 to 31st December 2021 for the 5,921 OISST v2.1 grid cells that cover the 10 coastal marine ecoregions (Spalding et al. Citation2007) and eight coastal sub-regions (DOC, Citation2011) of New Zealand and its surrounding islands, out to 12 NM, from 29°S (Northern boundary, Rangitāhua, Kermadec Islands) to 53°S (Southern boundary, Motu Ihupuku, Campbell Island) and 165°E (Western boundary, Maungahuka, Auckland Island) to 175°W (Eastern boundary, Wharekauri, Chatham Island). This data set is constructed from a combination of observations from satellites, ships, buoys and Argo floats, and is interpolated to a 1/4° degree regular grid, allowing continuous estimates of sea surface temperature, including temperatures close to the coastline (Huang et al. Citation2021). To select the coastal grid cells, every OISST grid cell was kept that intersected the 12 NM-from-the-coastline band. Following this masking procedure, only the most coastal 1/4° degree grid cells were kept along the coastline (n = 300 grid cells). Two sets of similar analyses were done: on coastal grid cells to 12 NM and on grid cells to 200 NM to see if there was any difference between the most coastal and further offshore trends (see https://doi.org/10.6084/m9.figshare.22872902.v1 for the latter). From the daily OISST time series, MHWs were detected with the ‘heatwaveR’ R package (version v0.4.6), Schlegel and Smit (Citation2018). The 30-year climatology period from January 1982 to December 2012 was used to calculate the sea surface temperature mean and daily MHW intensity. From these timeseries five standard metrics were calculated: (a) number of MHW days, (b) number of MHW events, (c) MHW mean intensity (°C), (d) MHW maximum intensity (°C), and (e) MHW cumulative intensity (°C days) as in Thoral et al. (Citation2022). These analyses were run for every grid cell OISST time series within the coastal ecoregions, giving an output of the history of MHWs in each grid cell. The metrics were then summed (number of MHW days, events, and cumulative intensity) or averaged (mean and max intensities) per year, season and/or ecoregion. To match regional council managerial and biological boundaries more closely, we also divided the two ecoregions of ‘Central New Zealand’ and ‘South New Zealand’ (sensu Spalding et al. Citation2007) into eight smaller coastal sub-regions. Following the New Zealand Department of Conservation coastal classification (DOC Citation2011) the eight sub-regions include the ‘Western North Island’, ‘Eastern North Island’, ‘North Cook Strait’, ‘South Cook Strait’, ‘West Coast South Island’, ‘East Coast South Island’, ‘Southland’, and ‘Fiordland’ (). This additional step provides greater spatial resolution that is relevant to the management of marine ecosystems.
Figure 1. Map showing the 10 coastal Marine Ecoregions of the World (MEOW) ecoregions (bottom, solid borders) and eight coastal Department of Conservation (DOC) sub-regions nested within ‘Central’ and ‘South’ New Zealand (top, solid fill).
Trend and change-point detection across New Zealand ecoregional and seasonal scales
Daily MHW metrics were summarised by year and season. Seasons were classified as traditional 3-month time windows: June-August (winter), September-November (spring), December-February (summer), and March-May (autumn). Mann-Kendall and Theil-Sen slope (hereafter Sen’s slope) analyses were done on the time series for each MHW metric. The Mann-Kendall trend test is a non-parametric, distribution-free trend analysis often used in environmental and climate studies. The Mann-Kendall test can be sensitive to autocorrelation (Yue and Wang Citation2004); therefore, prior to analysis the autocorrelation function was plotted across all scales at different lag times in the time series. There was evidence of significant autocorrelation for several metrics so a modified Mann-Kendall trend test was used to account for this using the variance correction approach (Patakamuri and O’Brien Citation2020). To determine the direction and intensity of the trends, the non-parametric Sen’s slope was determined, a method that is robust to outliers as compared to parametric linear regression (Pohlert Citation2020). For each MHW metric we also added non-parametric Pettitt tests to detect significant shifts in central tendency, and to highlight important changes in temporal dynamics indicated by change point year (breakpoint year). The test diagnostic for Pettitt tests sometimes approximates p-values above 1 (Pohlert Citation2020), for simplicity these are listed as 1 in the online tables. The R package ‘trend’ (version 1.1.4, available on CRAN) was used to calculate the Mann-Kendall, Sen’s slope, and Pettitt tests (Pohlert Citation2020) and the package ‘modifiedmk’ (version 1.6, available on CRAN) was used for running modified Mann-Kendall tests (Patakamuri and O’Brien Citation2020). Change point year was used to re-calculate all trends pre- and post-change point year. These analyses were run by combining grid cells over (a) the entire New Zealand coastline including surrounding islands, (b) for each of the 10 MEOW coastal ecoregions and the eight DOC sub-regions, (c) for each of the four seasons, and (d) for each combination of coastal ecoregion and season. We accounted for the varying number of grid cells between different ecoregions by dividing the number of MHW days, number of events, and cumulative intensity by the number of grid cells within each ecoregion. The grid cell-averaged yearly value of the metrics could then be compared between regions, as done in Thoral et al. (Citation2022). R version 4.1.0 was used for the analyses.
Suitability of OISST data for analysing coastal SSTs and MHWs
The NOAA 0.25° daily OISST product has been widely used to study the interannual variability and long-term trends of SST and MHWs at both the basin (e.g. Oliver et al. Citation2018) and coastal scales (e.g. Marin et al. Citation2021; Thoral et al. Citation2022). The OISST v2.1 product shows strong coherence with coastal in situ temperature (T) records around New Zealand on timescales longer than a month and has been highlighted as a useful proxy for examining large-scale trends in coastal SST (Shears and Bowen Citation2017). For example, monthly anomalies in three multi-decadal daily in situ coastal datasets were consistent with satellite-derived SST (OISST v2) from adjacent offshore locations (R2 = 0.66–0.81; Shears and Bowen Citation2017). The satellite-derived SST also exhibited analogous spatial and seasonal variation in warming trends to those in coastal in situ temperature records between 1982 and 2016. A similar analysis also found good agreement between offshore OISST and in situ temperature records collected on open coastlines around New Zealand on interannual timescales (Chiswell and Grant Citation2018). However, the growth and decay of coastal MHWs typically occurs within synoptic timescales (e.g. 9–13 days) (Schlegel et al. Citation2017; Cook et al. Citation2022), which are considerably shorter than those examined in previous intercomparisons between in situ and satellite-derived SST around New Zealand. Recent work also illustrates a marked drop in coherence between blended SST analyses, including OISST, and in situ SST measurements for timescales of SST variability shorter than 64 days (Woo and Park Citation2020). This raises a question about how successfully the OISST product resolves relatively short-lived coastal MHWs and as a consequence, their resulting long-term trends.
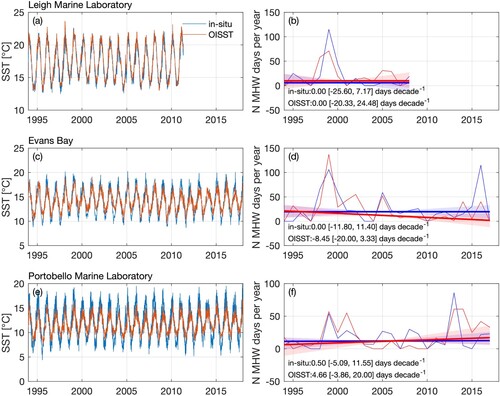
To provide additional support for the use of OISST in investigating spatial and seasonal long-term trends of coastal MHWs, we compared long-term trends in the number of MHW days per year from three coastal daily in situ temperature records spanning the latitudinal extent of New Zealand, with those from daily satellite-derived SST from adjacent offshore (∼25 km) locations (A, C, E). Temporal trends in MHW metrics were estimated at each site using the Theil-Sen analyses described above. There was general good coherence between OISST and in situ SST in northern (A) and central (C) New Zealand. In southern New Zealand (E) in situ SST had more extreme high and low temperatures than OISST. This is attributable to the in situ SST measurements in southern New Zealand being collected in a relatively shallow (< 15 m depth) and well-mixed harbour, which is more easily heated and cooled relative to the surrounding coastal ocean over the seasonal cycle (Cook et al. Citation2022). It is also notable that the long-term trend in the number of MHW days per year computed from OISST agree within the uncertainties of the corresponding trend from adjacent coastal in situ temperature records (B, D, F), providing further justification for the use of OISST to analyse spatial and seasonal trends in coastal MHWs.
Figure 2. Time series of daily in situ T (blue) and adjacent offshore satellite-derived SST (red) for (a) Leigh Marine Laboratory, (c) Evans Bay and (e) Portobello Marine Laboratory. Time series of the annual number of marine heatwave days per year for (b) Leigh Marine Laboratory, (d) Evans Bay and (f) Portobello Marine Laboratory. Also shown are the Sen Slopes of the in situ and satellite-derived time series together (bold lines) together with their 95% confidence intervals (shading).
Results
General trends across seasons and ecoregions
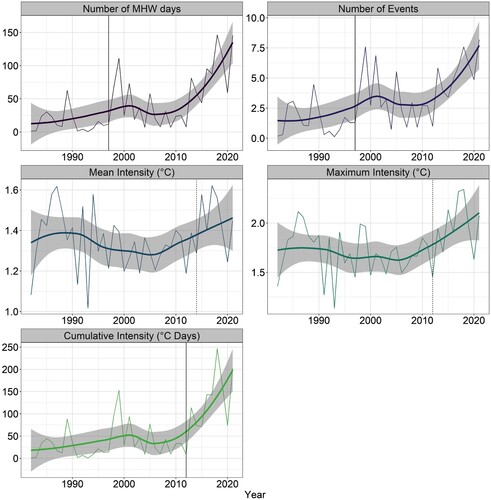
Analyses of the OISST data set spanning 4 decades showed significant positive trends across the New Zealand coastline for number of MHW days, events, and maximum and cumulative intensity (i.e. here pooling data across ecoregions and seasons, , Table S2). MHW days increased by 575% from 20 to 135 days on average per year per grid cell, and MHW events increased by 275% from 2 to 7.5 events on average per year per grid cell. The mean and maximum intensity increased from 1.35 °C to 1.45 and 1.75 °C to 2.2°C per year per grid cell, respectively. As a result, cumulative intensity increased 700% from 25°C to 200°C days (). Significant change point years were detected for MHW days and number of events since 1997, and cumulative intensity since 2012 (Table S1). When the trend analyses were separated into before and after change point detection, even more severe intensification was found for MHW days (41.9 times higher) and MHW events (12.7 times higher) after 1997, and cumulative intensity (50.3 times higher) after 2012.
Figure 3. Seasonal trend analyses on number of MHW days, number of MHW events, mean intensity, maximum intensity, and cumulative intensity (bars from left to right, respectively; 4 seasonal analyses per metric [Winter, Spring, Summer, Autumn]; orange positive, purple negative trend) for all New Zealand (All NZ Region) and for 10 coastal (12 NM) ecoregions. Of the 200 analyses (10 regions x 5 metrics x 4 seasons, see ), 69.5% of cases increased and 30.5% were unaffected.
![Figure 3. Seasonal trend analyses on number of MHW days, number of MHW events, mean intensity, maximum intensity, and cumulative intensity (bars from left to right, respectively; 4 seasonal analyses per metric [Winter, Spring, Summer, Autumn]; orange positive, purple negative trend) for all New Zealand (All NZ Region) and for 10 coastal (12 NM) ecoregions. Of the 200 analyses (10 regions x 5 metrics x 4 seasons, see Figures 6–10), 69.5% of cases increased and 30.5% were unaffected.](/cms/asset/b3cdc16e-40af-43a2-9e90-9a896bce8875/tnzm_a_2218102_f0003_oc.jpg)
Figure 4. New Zealand general trends from January 1982 to December 2021 in the yearly-and-grid cell-averaged number of MHW days, number of MHW events, mean intensity (°C), maximum intensity (°C), and cumulative intensity (°C days) of MHWs within coastal (12 NM) ecoregions. The thick lines show loess smoothing (shading represents ±95% confidence interval around smoothing). Vertical lines indicate break-point year (thick = significant, dashed = non-significant).
Seasonal MHW trends
Similar patterns were found between different seasons (i.e. here pooling data across ecoregions) with significant positive trends for all MHW metrics in spring, summer, and winter (, Table S2). However, in autumn, significant positive trends were detected only for the number of MHW days, events, and cumulative intensity (Table S2). Detections of significant change points showed that since 1995, MHWs during autumn and winter were more frequent (number of MHW days and events) and had a higher cumulative intensity (Table S2). Significant change points were also detected for the maximum intensity of MHWs in winter (since 1995) and summer (since 2008).
Ecoregion trends
MHWs also affected the coastal ecoregions differently (pooling data across seasons) in terms of the number of significant positive and negative trends. Importantly, from 1982 to 2021, the Kermadec Islands and Northeastern New Zealand had significant positive trends for all five MHW metrics. The remaining eight ecoregions had significant positive trends for the number of MHW days, events, and cumulative intensity, and all ecoregions (excluding Southern New Zealand, Bounty and Antipodes Islands, and Campbell Island) had significant positive trends for MHW maximum intensity (Table S3). Significant change points across ecoregions were detected between 1997 and 2012. Our re-analysis of trend lines after break point detection showed that Chatham Island had the largest increase in number of MHW days (47.41 more days per decade per grid cell after 1997) whereas Bounty and Antipodes Islands had the highest increase in number of events (6.8 more events per decade per grid cell = 15.8 times higher after 2009). Finally, Northeastern New Zealand showed the highest increase in cumulative intensity, with 166.18°C days more per decade per grid cell, 76.4 times higher after 2012 (Table S3).
Seasonal SST and MHW trends within ecoregions
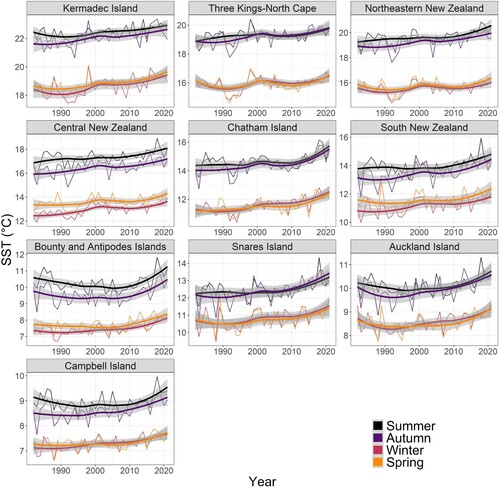
From 1982 to 2021, trends in satellite-derived mean SST showed seasonal and geographical variation across MEOW ecoregion and DOC subregional analyses (, S1). Since 1982, mean SST in summer and autumn has increased by 1–1.5°C at the Three Kings – North-Cape ecoregion, Northeastern New Zealand, Central New Zealand, the Chatham Islands and Snares Island; at the Kermadec Islands, the mean SST has increased by 1°C in autumn. Finally, during winter and spring mean SST increased 1°C for the Kermadec Islands and Chatham Islands ().
Figure 5. Seasonal trends in satellite derived mean SST from 1982 to 2021 by coastal (12 NM) ecoregion. The thick lines show loess smoothing (shading is ±95% confidence interval around smoothing).
Regarding MHW trends, across 200 test cases (10 ecoregions × 5 metrics × 4 seasons), 69.5% (139 cases) increased significantly, 30.5% (61) were non-significant, and 0% (0) decreased ( and ; Table S4). MHW metrics increased by different magnitudes across ecoregions, seasons, and time periods, with the Kermadec and Snares Islands being most and least affected by MHWs, with 20 and 5 significant positive trends, respectively (20 maximum; ). Over the past four decades, the number of MHW days, MHW events and cumulative intensity of MHWs within all ecoregions (minus the Snares Islands) had a significant positive trend over two to four seasons, with a total of 28, 30 and 28 significant positive cases, respectively, for these metrics. Maximum intensity had 29 significant positive cases and mean intensity had 24 significant positive cases ( and ; Table S4). We found similar results when the same analyses were applied to OISST grid cells 200 NM from the coastline, with 59% of cases increasing and 41% being non-significant. However, results varied between MHW metrics across ecoregions, seasons, and time periods.
Figure 6. Seasonal trends from 1982 to 2021 in the year-and-grid cell-averaged MHW days per 12 NM coastal ecoregions and season (thin lines). Thick lines (significant trend) and dashed lines (non-significant trend) show loess smoothing (±95% confidence interval around smoothing) by season. Vertical lines indicate break-point year (thick = significant, dashed = non-significant).
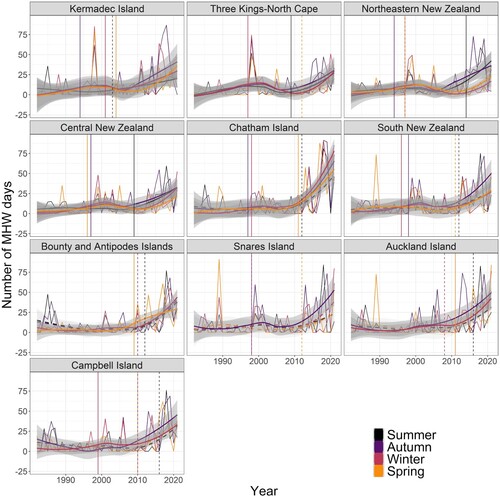
Figure 7. Seasonal trends from 1982 to 2021 in the year-and-grid cell-averaged MHW events per 12 NM coastal ecoregions and season (thin lines). Thick lines (significant trend) and dashed lines (non-significant trend) show loess smoothing (±95% confidence interval around smoothing) by season. Vertical lines indicate break-point year (thick = significant, dashed = non-significant).
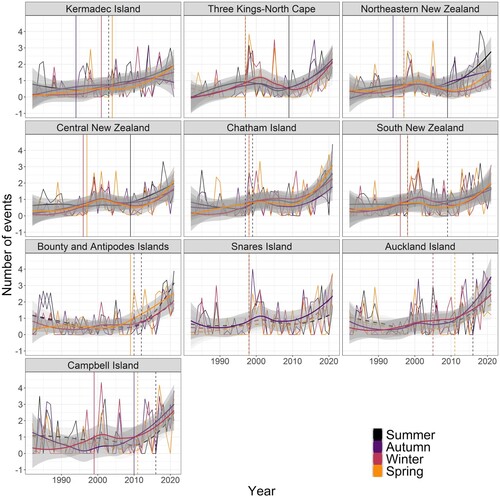
Figure 8. Seasonal trends from 1982 to 2021 in the year-and-grid cell-averaged MHW mean intensity (°C) per 12 NM coastal ecoregions and season (thin lines). Thick lines (significant trend) and dashed lines (non-significant trend) show loess smoothing (±95% confidence interval around smoothing) by season. Vertical lines indicate break-point year (thick = significant, dashed = non-significant).
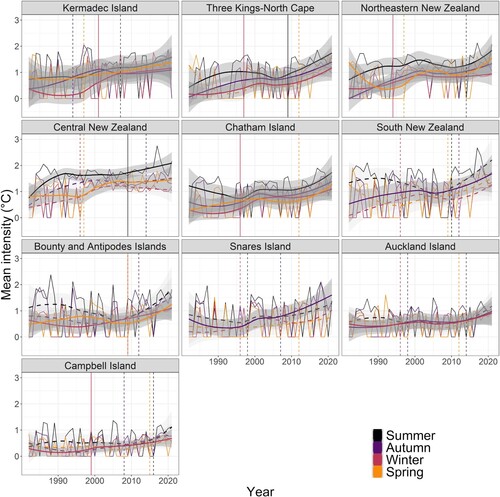
Figure 9. Seasonal trends from 1982 to 2021 in the year-and-grid cell-averaged MHW maximum intensity (°C) per 12 NM coastal ecoregions and season (thin lines). Thick lines (significant trend) and dashed lines (non-significant trend) show loess smoothing (±95% confidence interval around smoothing) by season. Vertical lines indicate break-point year (thick = significant, dashed = non-significant).
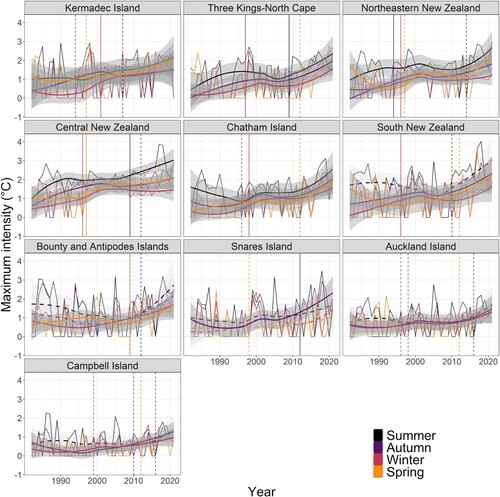
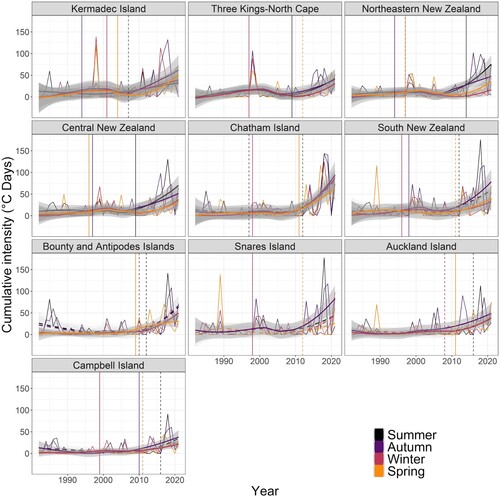
Figure 10. Seasonal trends from 1982 to 2021 in the year-and-grid cell-averaged MHW cumulative intensity (°C days) per 12 NM coastal ecoregions and season (thin lines). Thick lines (significant trend) and dashed lines (non-significant trend) show loess smoothing (±95% confidence interval around smoothing) by season. Vertical lines indicate break-point year (thick = significant, dashed = non-significant).
Number of MHW days
The number of MHW days increased significantly across all four seasons in the Kermadec Islands, Northeastern and Central New Zealand ecoregions. Significant increases occurred in the Three Kings – North-Cape in summer, autumn, and winter, and the Chatham Islands and Southern New Zealand in autumn, winter, and spring. In the New Zealand Subantarctic Zone, significant increases in number of MHW days were found at the Bounty and Antipodes Islands in winter and spring, Auckland Island and Campbell Island in autumn and winter, and the Snares Islands in autumn. Of the 28 significant positive slopes for number of MHW days, the five greatest increases (the largest decadal increase is shown in parentheses, followed by change point year) were the Chatham Islands in winter (6.09 more MHW days per decade, 1998), Central New Zealand in autumn (4.36, 1997), Northeastern New Zealand in summer (3.29, 2014) and autumn (3.26, 1994), and Bounty and Antipodes Islands in spring (3.04, 2009). However, these rankings changed after the break point year re-analysis with the five greatest increases being the Bounty and Antipodes Islands in winter (31.11, 2009), Central New Zealand in summer (19.58, 2009), Chatham Islands in winter (18.48, 1998), Three Kings – North-Cape in summer (18.4, 2009), and Kermadec Islands in spring (11.85, 2004) (; Table S4).
Number of MHW events
The number of MHW events increased significantly across all seasons for the Kermadec Islands, Northeastern New Zealand, Central New Zealand, the Chatham Islands and Southern New Zealand regions. Increases were also detected for three seasons (summer, autumn, winter) for the Three Kings – North-Cape region and two seasons for the Bounty and Antipodes Islands (winter, spring), Auckland Island (autumn, winter), and Campbell Island (autumn winter). Finally, increases were only apparent for the Snares Islands during autumn. Of the 30 significant positive slopes, the five greatest increases were for the Chatham Islands in winter (0.46 more events per decade, 1998), Bounty and Antipodes Islands in spring (0.37, 2009), Northeastern New Zealand in summer (0.31, 2009), Three Kings – North-Cape in summer (0.30, 2009) and Auckland Island in spring (0.29, 2005), although this later change point year was not significant (; Table S4). After re-analysis following break point year, the only significant increase for the number of MHW events was the Kermadec Islands in spring (0.75, 2004) (Table S4).
MHW mean intensity
The mean MHW intensity increased significantly in the Kermadec Islands, Northeastern New Zealand, and Chatham Islands across all four seasons. Of the remaining ecoregions, significant increases occurred across three seasons (summer, autumn, winter) for Three Kings – North-Cape, two seasons for Central New Zealand (summer, spring), the Bounty and Antipodes Islands (winter, spring), and Auckland Island (autumn, winter), and one season in Southern New Zealand (autumn), the Snares Islands (autumn), and Campbell Island (winter). The most extreme increases in MHW mean intensity were the Snares Islands in autumn (0.14°C, 2007), Chatham Islands in winter and autumn (both 0.13°C, 1996), Northeastern New Zealand in autumn (0.13 °C, 1994) and Three Kings – North-Cape in summer (0.10°C, 2009). After re-analysis following break point year, the only significant increase was mean intensity at the Snares Islands (0.43°C, 2007) (; Table S4).
MHW maximum intensity
The maximum intensity of MHWs increased significantly across all four seasons in the Kermadec Islands, Northeastern New Zealand, Central New Zealand, and the Chatham Islands. Significant increases were found for the Three Kings – North-Cape in summer, autumn and winter, and for Southern New Zealand in autumn, winter, and spring. More seasonally complex patterns occurred in the New Zealand Subantarctic Zone, with significant increases at the Bounty and Antipodes Islands in winter and spring, Auckland Island and Campbell Island in autumn and winter, and the Snares Islands in autumn. Of the 29 increasing trends the most extreme increase in maximum MHW intensity occurred at Snares Island (0.35°C, 2012) and Northeastern New Zealand (0.3°C, 1994) in autumn, Chatham Island in winter (0.28°C, 1998), and Three Kings – North-Cape (0.27°C, 1997) and Chatham Island (0.27°C, 1997) in autumn (; Table S4).
MHW cumulative intensity
Significant increases in cumulative MHW intensity, again, occurred at the Kermadec Islands, Northeastern and Central New Zealand ecoregions across all four seasons, and seasonal results for the remaining ecoregions tracked those described above (section ‘Number of MHW days’). Of the 28 significant positive slopes for cumulative MHW intensity, the five greatest increases were Central New Zealand in autumn (5.84°C days more per decade, 1997), Chatham Islands in winter (5.78°C days, 1998), Southern New Zealand in autumn (5.01°C days, 1998), Northeastern New Zealand in summer (4.9°C days, 2014), and Central New Zealand in summer (4.88°C days, 2009) (; Table S4). Again, these rankings changed after break point year re-analysis with the greatest increase for Central New Zealand in summer (47.27°C days, 2009) followed by the Chatham Islands in winter (19.58°C days, 1998) and the Kermadec Islands in spring (14.31°C days, 2004) (Table S4).
General trends within central and south New Zealand ecoregions
MHW trends within the six sub-regions of ‘Central’ and two sub-regions of ‘South’ revealed smaller scale patterns not detected in the broader ecoregion analysis. All sub-regions had significant positive trends for number of MHW days, number of MHW events, and MHW intensity (maximum and cumulative), and Eastern North Island and South Cook Strait had significant positive trends for mean intensity (). Significant change points across all sub-regions were detected between 1997 and 2012 (Table S5). Following re-analysis of trend lines after break point detection showed that the Western North Island had the largest increase in number of MHW days (23.99 more days per decade per grid cell after 1997) and East Coast South Island had the largest increase in number of MHW events (1.81 more events per decade per grid cell = 28.9 times higher after 1998) (Table S5).
Figure 11. Seasonal trend analyses on number of MHW days, number of MHW events, mean intensity, maximum intensity, and cumulative intensity (bars from left to right; 4 seasonal analyses per metric [Winter, Spring, Summer, Autumn]; orange positive, purple negative trend). Eight 12 NM coastal sub-regions nested within ‘Central’ (n = 6) and ‘South’ (n = 2) New Zealand ecoregions. Of the 120 (6 sub-regions × 5 metrics × 4 seasons) and 40 (2 sub-regions × 5 metrics × 4 seasons) trend analyses for ‘Central’ and ‘South’ New Zealand (Figs. S2-S7), 76% (60%) increased significantly and 24% (40%) were unaffected, respectively.
![Figure 11. Seasonal trend analyses on number of MHW days, number of MHW events, mean intensity, maximum intensity, and cumulative intensity (bars from left to right; 4 seasonal analyses per metric [Winter, Spring, Summer, Autumn]; orange positive, purple negative trend). Eight 12 NM coastal sub-regions nested within ‘Central’ (n = 6) and ‘South’ (n = 2) New Zealand ecoregions. Of the 120 (6 sub-regions × 5 metrics × 4 seasons) and 40 (2 sub-regions × 5 metrics × 4 seasons) trend analyses for ‘Central’ and ‘South’ New Zealand (Figs. S2-S7), 76% (60%) increased significantly and 24% (40%) were unaffected, respectively.](/cms/asset/5201c4ce-d1ee-4b71-b413-5ed3e861f54b/tnzm_a_2218102_f0011_oc.jpg)
Seasonal trends within central and south New Zealand sub-regions
Across sub-regions, seasons, and metrics, 78 cases within Central and 20 cases within South New Zealand significantly increased and 42 (20) were non-significant, respectively (; Table S5). The North Cook Strait and the East Coast South Island were most affected, whereas Fiordland was least affected. All eight sub-regions showed significant positive increases, for all MHW metrics, from at least one to all four seasons. There were 25 significant increases for number of MHW days, 24 for number of MHW events, 23 for maximum and cumulative intensity, and 19 for mean intensity (). Across all four seasons, Western North Island, North Cook Strait, South Cook Strait, East Coast South Island and Southland significantly increased in number of MHW days and MHW events (, S2, S3). Furthermore, North Cook Strait, East Coast South Island and Southland significantly increased in intensity (maximum and cumulative) of MHWs across all four seasons (, S5, S6). Finally, Western North Island increased significantly across all four seasons for cumulative intensity (, S6).
Regarding number of MHW days, the greatest increase (largest decadal trend shown in brackets, followed by change point year) was Western North Island in autumn (3.95 days, 2012) which, after break point analysis, changed to Western North Island in summer (27.81 days = 111.24 times higher since 2009). The East Coast South Island had the largest significant increase in winter in number of MHW events (0.41, 1998), but the change point year analysis was not significant. For maximum and cumulative intensity, the greatest increase was the East Coast South Island in spring (0.39°C, 1998) and summer (6.89°C days per decade since 2009), respectively. Following break point analysis, these results changed to Western North Island in summer for both maximum intensity (1.47°C, 33.36 times higher since 2009) and cumulative intensity (73.34°C days, 226.63 times higher since 2009). Finally, Western North Island in spring saw the greatest increase in mean intensity (0.23°C, 1997), but this changed after break point year re-analysis, to the Eastern North Island in summer (0.2°C, 2001) (Table S5).
In summary, for the 120 Central New Zealand trend analyses, 76% increased significantly and 24% were unaffected, whereas for the 40 South New Zealand analyses, 60% increased significantly and 40% were unaffected (, S2-S6). Again, similar results were found when the same set of analyses were applied to OISST grid cells 200 NM from the coastline, whereby 73% (53%) increased significantly and 27% (47%) were unaffected in Central and South New Zealand, respectively.
Summary of trends within and across New Zealand
Overall, compared to 1982, and across coastal New Zealand, the number of MHW events increased by 2.75 year−1 grid cell−1, the number of MHW days is 5.75 times higher, the mean and maximum intensity of MHWs increased by 0.1°C and 0.45 °C, respectively, and MHW cumulative intensity was 7 times higher (). Furthermore, across the 10 ecoregions, ca. 70% of 200 season-specific MHW trend analyses increased significantly, with most temporal breakpoints observed between 1994 and 2012 ( and ). Additional seasonal trend analyses of the eight DOC sub-regions within the Central and South New Zealand ecoregions showed that 76% of 120 test cases and 60% of the 40 test cases increased significantly (). In 50% of the sub-regional analyses, the number of MHW days and events, and cumulative intensity increased significantly across all seasons, and these trends intensified after breakpoint detection in 2012. For example, between 2011 and 2021, cumulative intensity was 50 times, MHW days 42 times, and MHW events 13 times higher on average year−1 grid cell−1.
Discussion
New Zealand MHW trends
Long-term trends in SST have been examined around New Zealand (e.g. Schiel et al. Citation2016; Shears and Bowen Citation2017; Sutton and Bowen Citation2019), but trends in MHWs are inadequately described, except for a few site-specific case studies (Thomsen et al. Citation2019; Thomsen et al. Citation2021a; Cook et al. Citation2022) and trends encapsulated in Salinger et al. (Citation2019) and Behrens et al. (Citation2022). However, these studies did not test for seasonal patterns, temporal breakpoints, or biogeographical differences. Here we demonstrate that MHWs generally have become stronger, longer and more frequent across coastal New Zealand, although with some variability within and between seasons, regions, and metrics.
New Zealand’s most intense coupled ocean-atmosphere heatwaves occurred during the austral summers of 2017/18 and 2018/19 (Salinger et al. Citation2019; Salinger et al. Citation2020). For these MHWs, SSTs were 2.1°C and 1.2°C higher on average, respectively, where maximum SST anomalies were observed on the west coast of the South Island (Salinger et al. Citation2020). More recent real-time monitoring of MHWs has documented more hot summers, where summer SSTs on the west coast of the North Island and Fiordland, for example, were 4–5°C higher than average (Moana Project Citation2022a). Recent MHWs have also been unusually long, MHW events in northeast and southwest New Zealand were recorded as the longest in the satellite-era (Bell et al. Citation2022) and recent MHW events in the Bay of Plenty (Northeastern New Zealand ecoregion) lasted 12 months (Moana Project Citation2022b). These recent MHWs have altered New Zealand’s coastal marine ecosystems and critical foundation species (Thomsen et al. Citation2019; Thomsen and South Citation2019; Tait et al. Citation2021; Thomsen et al. Citation2021b) but lack of consistent nationwide long-term ecological monitoring programmes hinders a greater understanding of their impacts. This is particularly important for the most vulnerable ecoregions outlined above, as well as for ecoregions where ecologically important species, like habitat forming seaweeds, have narrow temperature and/or distributional ranges. Our analyses suggest that satellite-based MHW trend analyses can be combined with long term in situ SST data () (Thoral et al. Citation2022) to identify ecologically sensitive regions and species, which may help develop mitigation strategies for New Zealand and encourage research and monitoring efforts (e.g. Stevens et al. Citation2022).
Global context
It is well-documented that MHWs are becoming longer, more frequent, and more intense on global scales, and that these trends are predicted to accelerate under future climate change (Frölicher et al. Citation2018; Holbrook et al. Citation2019; Oliver et al. Citation2019; Smale et al. Citation2019; Thoral et al. Citation2022). For example, globally there has been a 54% increase in annual MHW days from 1925 to 2016 (Oliver et al. Citation2018) and a 20% increase in MHW intensity since 1982 (Oliver et al. Citation2018). Between 1982 and 2017, severe or extreme MHWs have been recorded across 70% of the ocean with some events lasting longer than 250 days (Sen Gupta et al. Citation2020). Future projections suggest that many parts of the ocean will reach a near-permanent MHW state by 2100 (Oliver et al. Citation2019), resulting in scientific discussions about whether climatic baseline periods should be fixed or moving (Oliver et al. Citation2021; Chiswell Citation2022). For example, a fixed baseline may be better to understand ecological impacts (assuming relatively fixed species traits on decadal time scales) whereas moving baseline periods could be more useful when studying physical climate characteristics with a focus on short term temperature variability (Oliver et al. Citation2021).
Past MHW research has largely focused on expansive oceanic regions dominated by deep-water pelagic systems with low biodiversity and productivity. Recently, Thoral et al. (Citation2022) expanded on the few older coastal-oriented MHW studies (where diversity and productivity are higher and effects from MHWs may be more severe) (Smit et al. Citation2013; Schlegel et al. Citation2017; Marin et al. Citation2021) by analysing biogeographical and seasonal effects. Results showed that coastal MHWs were also longer, more frequent, and stronger globally but that trends varied widely between seasons and biogeographical realms. Our new analyses highlight that results from coastal New Zealand were consistent with global trends showing increases in MHW metrics over the last four decades, as shown by Thoral et al. (Citation2022) on a global scale, however, there was wide variability in MHW metrics between ecoregions and seasons. This variability, superimposed on a general warming trend, will likely result in future changes to coastal communities and in particular, changes to the distribution of cold-adapted species (Martínez et al. Citation2018; Sutton and Bowen Citation2019 Cook et al. Citation2022).
Regional context
The number of studies on MHWs in New Zealand have recently increased, partly because standardised terminology and free computer software to analyse these events have been developed (Hobday et al. Citation2016; Hobday et al. Citation2018), longer and better global satellite-derived SST data are now freely available (Banzon et al. Citation2016), and because considerable ecological impacts have been documented (Salinger et al. Citation2019; Thomsen et al. Citation2019; Salinger et al. Citation2020; Tait et al. Citation2021). Still, there are few analyses of long-term MHW trends around New Zealand, except for a local study that compared satellite-derived and long-term in situ measurements of daily SST records from the Leigh and Portobello marine laboratories (Cook et al. Citation2022). However, more common analyses of SST trends around New Zealand have documented broad scale warming of shelf and coastal waters (Schiel et al. Citation2016; Shears and Bowen Citation2017; Sutton and Bowen Citation2019). For example, Sutton and Bowen (Citation2019) used OISSTv2 data to show surface warming of 0.1–0.3°C decade−1 of the ocean adjacent to New Zealand from 1981 to 2018. Our analyses of trends in both SST and MHW metrics from 1982 to 2021 are consistent with these warming trends, with coastal seas warming by ca. 0.5–1°C since 1982 (, S1) and significant increases in all MHW metrics for all seasons across the entire New Zealand (). However, like the MHW trend results, the long-term SST trends also had high regional and seasonal variability. Understanding SST trends and fluctuations are important because changes in mean SST is a dominant driver of global increases in frequency and intensity of MHWs (Oliver Citation2019) and because high SST (and with superimposed strong MHWs) can have dramatic impacts on marine organisms, community structures, and ecosystem functioning. For example, stronger MHWs typically inhibit cold-water species with narrow physiological temperature thresholds (Wernberg et al. Citation2016; Smale et al. Citation2019; Thomsen et al. Citation2019; Smith et al. Citation2022), recently causing dramatic losses of foundation species on the South Island of New Zealand, like for giant kelp (Macrocystis pyrifera) (Tait et al. Citation2021) and Southern Bull Kelp (Durvillaea spp.) (Thomsen et al. Citation2019; Thomsen and South Citation2019; Thomsen et al. Citation2021a). Sutton and Bowen (Citation2019) documented particularly strong annual surface warming along the Wairarapa coast (>0.3°C decade−1) and the east coast of the South Island (0.2–0.3°C decade−1), but weak trends in the New Zealand Subantarctic Zone (<0.1°C decade−1) ( in Sutton and Bowen Citation2019). Here the Wairarapa coastline and east coast of the South Island are situated within North Cook Strait and East Coast South Island DOC sub-regions, respectively (), where we generally found significant positive increases across MHW metrics and seasons (but with no significant winter trends for MHW mean intensity). By contrast, the MHW trends from the Subantarctic Islands, i.e. the regions with the weakest long-term warming signal, were only significant in 1–2 seasons. These analyses suggest regional consistencies between MHWs and mean SST trends around New Zealand, as highlighted by Cook et al. (Citation2022) based on trend analysis from two coastal sites.
Recent work by Oliver (Citation2019) has also highlighted that mean ocean surface warming, rather than increased variability, is driving global trends in MHW metrics as well as around New Zealand (e.g. in Oliver Citation2019). Therefore, consistency between MHW trends and the complex pattern of upper ocean warming around New Zealand was anticipated (Shears and Bowen Citation2017; Sutton and Bowen Citation2019). The weakest SST trends occur around the Subantarctic Zone (Sutton and Bowen Citation2019) but we still found significant and consistent positive MHW trends during cooler seasons (). Importantly, of the 50 MHW trends we analysed for each of the four seasons, 86% were significant in both winter and autumn, compared to 58% and 48% in summer and spring, respectively. Until recently, MHWs occurring during cold seasons in New Zealand (and other places around the world) have been overlooked, even though winter events are likely to affect spawning and recruitment of fish and other marine organisms, which in turn may affect aquaculture and fisheries (de Souza et al. Citation2021; de Burgh-Day et al. Citation2022). Shears and Bowen (Citation2017) also noted strong seasonal variation in surface warming in coastal and offshore waters in southern New Zealand, and recorded warming in autumn and winter that was not apparent during summer, partly attributed to deep water warming that is masked during summer (e.g. by the seasonally variable surface layer). However, more work is needed to better understand the mechanisms that drive changes in seasonality trends for both SST and MHW metrics in New Zealand (Shears and Bowen Citation2017).
There are a few differences between our new satellite-based analysis and previous work on SST and MHW trends around New Zealand. For example, Sutton and Bowen (Citation2019) indicated relatively weak warming (∼0.14°C/decade) along the northeast coast of the North Island (from OISST data between 1981 and 2018) and this SST trend was consistent with the Leigh coastal in situ SST time series (Shears and Bowen Citation2017). Similarly, Cook et al. (Citation2022) found no evidence of long-term increases in MHW metrics from the Leigh coastal station from 1967 to 2020. In contrast, our results suggest that the Northeastern ecoregion has experienced significant increases across all MHW metrics and seasons between 1982 and 2021 (). These differences are likely attributable to the large inter-annual variability in SST along the northeast coastline of New Zealand (Bowen et al. Citation2017; Shears and Bowen Citation2017; Cook et al. Citation2022) and because our analyses included breakpoint analysis and the newest satellite data (2018–2021) with strong warming signals (Moana Project Citation2022a, Citation2022b).
Conclusion
Here we analysed trends in MHWs within and between seasons and ecoregions within 12 nautical miles from the coastline of New Zealand. The season-specific analyses demonstrated increases in the number of MHW days, MHW events, and MHW cumulative intensity, especially in northern and central ecoregions, but with some variability between metrics, ecoregions, and seasons. For example, in southern and sub-Antarctic ecoregions the MHW metrics were mainly affected in colder seasons. Results were largely consistent with the spatial and seasonal variability of the long-term SST previously documented around New Zealand. Furthermore, break-point analyses demonstrated an acceleration in these trends over the last decade, providing mechanistic underpinning to research that have reported ecological impacts from MHWs on marine ecosystems, such as local extinctions of endemic foundation species on rocky reefs. Our analyses demonstrate that coastal communities in New Zealand, over the last few decades, have experienced increasingly stronger, longer and more frequent MHWs that should have implications for conservation and provide an incentive to initiate effective, adequate, and standardised monitoring of coastal habitats (currently almost non-existing).
Supplemental material
Download MS Word (4.4 MB)Author contributions
SM, FT, and MT devised the study. FT performed the analyses and generated the results. RS and FC undertook comparison of OISST and in situ data, supported oceanographic interpretation and refinement of results, and contributed to relevant sections in the discussion. SM, MT, and FT wrote the manuscript. All authors contributed to the analyses and revisions of the manuscript.
Disclosure statement
No potential conflict of interest was reported by the author(s).
Data availability statement
NOAA Optimum Interpolation (OI) SST V2 data provided by the NOAA PSL, Boulder, Colorado, USA, from their website at https://www.ncei.noaa.gov/products/optimum-interpolation-sst (last accessed 31/08/2022). The daily in situ SST time series for Leigh Marine Laboratory, Evans Bay, and Portobello Marine Laboratory are available from https://zenodo.org/record/6399921#.Y6EFN-xBzmF. The R package ‘heatwaveR’ is available on CRAN. The code and method related to this analysis is available at https://robwschlegel.github.io/heatwaveR/articles/MHW_metric_trends.html (last accessed 30/01/2023). A web-based application summarising the study results’ is available at https://frantoto.shinyapps.io/Coastal_Seasonal_MHWs_NZ (last accessed 30/01/2023) and the supporting code at https://github.com/FranToto/NZ-Seasonal-MHWs (last accessed 30/01/2023). The accompanying 200 NM analysis and results is available at https://doi.org/10.6084/m9.figshare.22872902.v1
(last accessed 17/05/2023).Additional information
Funding
References
- Atkinson J, King NG, Wilmes SB, PJ M. 2020. Summer and winter marine heatwaves favor an invasive over native seaweeds. Journal of Phycology. 56:1591–1600.
- Banzon V, Smith VTM, Chin TM, Liu C, Hankins W. 2016. A long-term record of blended satellite and in situ sea-surface temperature for climate monitoring, modeling and environmental studies. Earth System Science Data. 8:165–176.
- Behrens E, Rickard G, Rosier S, Williams J, Morgenstern O, Stone D. 2022. Projections of future marine heatwaves for the oceans around New Zealand using New Zealand's earth system model. Frontiers in Climate. 4:19.
- Bell JJ, Smith RO, Micaroni V, Strano F, Balemi CA, Caiger PE, Miller KI, Spyksma AJ, Shears NT. 2022. Marine heat waves drive bleaching and necrosis of temperate sponges. Current Biology. 33(1):158–163.
- Bowen M, Markham J, Sutton P, Zhang X, Wu Q, Shears NT, Fernandez D. 2017. Interannual variability of sea surface temperature in the southwest Pacific and the role of ocean dynamics. Journal of Climate. 30:7481–7492.
- Chiswell SM. 2022. Global trends in marine heatwaves and cold spells: the impacts of fixed versus changing baselines. Journal of Geophysical Research: Oceans. 127(10). doi:10.1029/2022JC018757.
- Chiswell SM, BS Grant. 2018. New Zealand coastal sea surface temperature. Prepared for the Ministry for the Environment. NIWA Client Report No: 2018295WN.
- Coggins JH, Parsons S, Schiel DR. 2016. An assessment of the ocean wave climate of New Zealand as represented in Kidson's synoptic types. International Journal of Climatology. 36(6):2481–2496.
- Cook F, Smith RO, Roughan M, Cullen NJ, Shears NT, Bowen M. 2022. Marine heatwaves in shallow coastal ecosystems are coupled with the atmosphere: insights from half a century of daily in situ temperature records. Frontiers in Climate. 4:207.
- Costello MJ, Coll M, Danovaro R, Halpin P, Ojaveer H, Miloslavich P. 2010. A census of marine biodiversity knowledge, resources, and future challenges. PLOS one. 5:e12110.
- de Burgh-Day CO, Spillman CM, Smith G, Stevens CL. 2022. Forecasting extreme marine heat events in key aquaculture regions around New Zealand. Journal of Southern Hemisphere Earth Systems Science. 72(1):58–72.
- Department of Conservation and Ministry of Fisheries. 2011. Coastal marine habitats and marine protected areas in the New Zealand Territorial Sea: a broad scale gap analysis. https://www.doc.govt.nz/documents/conservation/marine-and-coastal/marine-protected-areas/coastal-marine-habitats-marine-protected-areas.pdf.
- de Souza JMAC, Schaeffer A, Smith GJ, O R. 2021. Marine heatwaves during winter could have dire impacts on New Zealand fisheries and hearld more summer storms. The Conversation. https://theconversation.com/marine-heatwaves-during-winter-could-have-dire-impacts-on-new-zealand-fisheries-and-herald-more-summer-storms-167967.
- Frölicher TL, Fischer EM, Gruber N. 2018. Marine heatwaves under global warming. Nature. 560:360–364.
- Hipel KW, McLeod AI. 1994. Time series modelling of water resources and environmental systems. Amsterdam, The Netherlands: Elsevier.
- Hobday AJ, Alexander LV, Perkins SE, Smale DA, Straub SC, Oliver ECJ, Benthuysen JA, Burrows MT, Donat MG, Feng M, et al. 2016. A hierarchical approach to defining marine heatwaves. Progress in Oceanography. 141:227–238.
- Hobday AJ, Oliver ECJ, Sen Gupta A, Benthuysen JA, Burrows MT, Donat MG, Holbrook NJ, Moore PJ, Thomsen MS, Wernberg T, Smale DA. 2018. Categorizing and naming marine heatwaves. Oceanography. 31:162–173.
- Holbrook NJ, Scannell HA, Sen Gupta A, Benthuysen JA, Feng M, Oliver EC, Alexander LV, Burrows MT, Donat MG, Hobday JA. 2019. A global assessment of marine heatwaves and their drivers. Nature Communications. 10:1–13.
- Huang B, Liu C, Banzon V, Freeman E, Graham G, Hankins B, Smith T, Zhang HM. 2021. Improvements of the daily optimum interpolation sea surface temperature (DOISST) version 2.1. Journal of Climate. 34:2923–2939.
- La Sorte F, Johnston A, Ault TR. 2021. Global trends in the frequency and duration of temperature extremes. Climatic Change. 166:1.
- Leggat WP, Camp EF, Suggett DJ, Heron SF, Fordyce AJ, Gardner S, Deakin L, Turner M, Beeching LM, Kuzhiumparambil U, et al. 2019. Rapid coral decay is associated with marine heatwave mortality events on reefs. Current Biology. 29:2723–2730. e2724.
- Marin M, Feng M, Phillips HE, Bindoff NL. 2021. A global, multiproduct analysis of coastal marine heatwaves: distribution, characteristics, and long-term trends. Journal of Geophysical Research: Oceans. 126. doi:10.1029/2020JC016708.
- Martínez B, Radford B, Thomsen MS, Connell SD, Carreño F. 2018. Distribution models predict large contractions of habitat-forming seaweeds in response to ocean warming. Diversity and Distributions. 24(10):1350–1366.
- Moana Project. 2022a. Where was the warmest water? Marine heatwave records this summer. https://www.moanaproject.org/news/where-was-the-warmest-water-marine-heatwave-records-this-summer.
- Moana Project. 2022b. New Zealand recorded most impactful marine heatwave in history in 2022 - and this is just the beginning. https://www.moanaproject.org/news/new-zealand-recorded-most-impactful-marine-heatwave-in-history-in-2022-and-this-is-just-the-beginning.
- Oliver EC. 2019. Mean warming not variability drives marine heatwave trends. Climate Dynamics. 53(3-4):1653–1659.
- Oliver EC, Benthuysen JA, Darmaraki S, Donat MG, Hobday AJ, Holbrook NJ, Schlegel RW, Sen Gupta A. 2021. Marine heatwaves. Annual Review of Marine Science. 13:313–342.
- Oliver EC, Burrows MT, Donat MG, Sen Gupta A, Alexander LV, Perkins-Kirkpatrick SE, Benthuysen JA, Hobday AJ, Holbrook NJ, Moore PJ, et al. 2019. Projected marine heatwaves in the 21st century and the potential for ecological impact. Frontiers in Marine Science. 6:734.
- Oliver EC, Donat MG, Burrows MT, Moore PJ, Smale DA, Alexander LV, Benthuysen JA, Feng M, Sen Gupta A, Hobday AJ, et al. 2018. Longer and more frequent marine heatwaves over the past century. Nature Communications. 9(1):1–12.
- Patakamuri S, O’Brien N. 2020. modifiedmk: modified versions of Mann Kendall and Spearman’s Rho trend tests version 1.6.
- Pohlert T. 2020. Trend: non-parametric trend tests and change-point detection. R package version 1.1.4. https://CRAN.R-project.org/package = trend.
- Salinger H, Diamond J, Behrens E, Fernandez D, Fitzharris BB, Herold N, Johnstone P, Kerckhoffs H, Mullan AB, Parker AK, et al. 2020. Unparalleled coupled ocean-atmosphere summer heatwaves in the New Zealand region: drivers, mechanisms and impacts. Climatic Change. 162:485–506.
- Salinger H, Renwick J, Behrens E, Mullan AB, Diamond HJ, Sirguey P, Smith RO, Trought MC, Cullen NJ, Fitzharris BB. 2019. The unprecedented coupled ocean-atmosphere summer heatwave in the New Zealand region 2017/18: drivers, mechanisms and impacts. Environmental Research Letters. 14:0044023.
- Schiel DR, Alestra T, Gerrity S, Orchard S, Dunmore R, Pirker J, Lilley S, Tait L, Hickford M, Thomsen MS. 2019. The Kaikōura earthquake in southern New Zealand: loss of connectivity of marine communities and the necessity of a cross-ecosystem perspective. Aquatic Conservation: Marine and Freshwater Ecosystems. 29:1520–1534.
- Schiel DR, Lilley SA, South PM, Coggins JH. 2016. Decadal changes in sea surface temperature, wave forces and intertidal structure in New Zealand. Marine Ecology Progress Series. 548:77–95.
- Schlegel RW, Oliver ECJ, Wernberg T, Smit AJ. 2017. Nearshore and offshore co-occurrence of marine heatwaves and cold-spells. Progress in Oceanography. 151:189–205.
- Schlegel RW, Smit AJ. 2018. Heatwaver: A central algorithm for the detection of heatwaves and cold-spells. Journal of Open Source Software. 3(27):821.
- Sen Gupta A, Thomsen M, Benthuysen JA, Hobday AJ, Oliver E, Alexander LV, Burrows MT, Donat MG, Feng M, Holbrook NJ, et al. 2020. Drivers and impacts of the most extreme marine heatwave events. Scientific Reports. 10:19359.
- Shanks RL, Valley JR, Jarvis MA, Salant C, Sutherland DA, Lamont EI, Hainey MA, Emlet RB. 2020. Marine heat waves, climate change, and failed spawning by coastal invertebrates. Limnology and Oceanography. 65:627–636.
- Shears NT, Bowen MM. 2017. Half a century of coastal temperature records reveal complex warming trends in western boundary currents. Scientific Reports. 7:1–9.
- Smale DA, Wernberg T, Oliver ECJ, Thomsen MS, Harvey BP, Straub SC, Burrows MT, Alexander LV, Benthuysen JA, Donat MG, et al. 2019. Marine heatwaves threaten global biodiversity and the provision of ecosystem services. Nature Climate Change. 9(4):306–312.
- Smit AJ, Roberts M, Anderson RJ, Dufois F, Dudley SF, Bornman TG, Olbers J, Bolton JJ. 2013. A coastal seawater temperature dataset for biogeographical studies: large biases between in situ and remotely-sensed data sets around the coast of South Africa. PLOS one. 8:e81944.
- Smith KE, Burrows MT, Hobday AJ, King NG, Moore PJ, Sen Gupta A, Thomsen MS, Wernberg T, Smale DA. 2022. Biological impacts of marine heatwaves. Annual Review of Marine Science. 15:119–145.
- Smith KE, Burrows MT, Hobday AJ, Sen Gupta A, Moore PJ, Thomsen MS, Wernberg T, Smale DA. 2021. Socioeconomic impacts of marine heatwaves: global issues and opportunities. Science, 374. doi:10.1126/science.abj3593.
- Spalding MD, Fox HE, Allen GR, Davidson N, Ferdaña ZA, Finlayson M, Halpern BS, Jorge MA, Lombana AL, Sara AL. 2007. Marine ecoregions of the world: a bioregionalization of coastal and shelf areas. Bioscience. 57:573–583.
- Stevens CL, Spillman CM, Behrens E, Broekhuizen N, Holland P, Matthews Y, Noll B, O'Callaghan JM, Rampal N, Smith RO, Soltanzadeh I. 2022. Horizon scan on the benefits of ocean seasonal forecasting in a future of increasing marine heatwaves for Aotearoa New Zealand. Frontiers in Climate. 4:907919.
- Strydom S, Murray K, Wilson S, Huntley B, Rule M, Heithaus M, Bessey C, Kendrick GA, Burkholder D, Fraser MW, Zdunic K. 2020. Too hot to handle: unprecedented seagrass death driven by marine heatwave in a world heritage area. Global Change Biology. 26:3525–3538.
- Sutton PJ, Bowen M. 2019. Ocean temperature change around New Zealand over the last 36 years. New Zealand Journal of Marine and Freshwater Research. 53:305–326.
- Tait LW, Thoral F, Pinkerton MH, Thomsen MS, Schiel DR. 2021. Loss of giant kelp, Macrocystis pyrifera, driven by marine heatwaves and exacerbated by poor water clarity in New Zealand. Frontiers in Marine Science. 8:721087.
- Thomsen MS, Mondardini L, Alestra T, Gerrity S, Tait LW, South PW, Lilley SA, Schiel DR. 2019. Local extinction of bull kelp (Durvillaea spp.) due to a marine heatwave. Frontiers in Marine Science. 6:84.
- Thomsen MS, Mondardini L, Thoral F, Gerber D, Montie S, South PM, Tait LW, Orchard S, Alestra T, Schiel DR. 2021a. Cascading impacts of earthquakes and extreme heatwaves have destroyed populations of an iconic marine foundation species. Diversity and Distributions. 27(12):2369–2383.
- Thomsen MS, Montie S, Gerber D, Thoral F, South PW, Tait LW, Wernberg T, Smale DA, Schiel DR. 2021b. Impacts of marine heatwaves: what are they, what have they done and what can we expect in the future? Coastal News. 76:3–6.
- Thomsen MS, South PM. 2019. Communities and attachment networks associated with primary, secondary and alternative foundation species; a case study of stressed and disturbed stands of southern bull kelp. Diversity. 11(4):56.
- Thoral F, Montie S, Thomsen MS, Tait LW, Pinkerton MH, Schiel DR. 2022. Unravelling seasonal trends in coastal marine heatwave metrics across global biogeographical realms. Scientific Reports. 12:1–13.
- Wernberg T, Bennett S, Babcock RC, de Bettignies T, Cure K, Depczynski M, Dufois F, Fromont J, Fulton CJ, Hovey RK, et al. 2016. Climate-driven regime shift of a temperate marine ecosystem. Science. 353:169–172.
- Wernberg T, Smale DA, Tuya F, Thomsen MS, Langlois TJ, de Bettignies T, Bennett S, Rousseaux CS. 2013. An extreme climatic event alters marine ecosystem structure in a global biodiversity hotspot. Nature Climate Change. 3:78–82.
- Woo HJ, Park KA. 2020. Inter-comparisons of daily sea surface temperatures and in-situ temperatures in the coastal regions. Remote Sensing. 12(10):1592. doi:10.3390/rs12101592.
- Yue S, Wang C. 2004. The Mann-Kendall test modified by effective sample size to detect trend in serially correlated hydrological series. Water Resources Management. 18:201–218.