
 ?Mathematical formulae have been encoded as MathML and are displayed in this HTML version using MathJax in order to improve their display. Uncheck the box to turn MathJax off. This feature requires Javascript. Click on a formula to zoom.
ABSTRACT
The native kelp Ecklonia radiata is a target species for the emerging seaweed aquaculture industry in New Zealand, however, the effect of line configuration on survival and growth of farmed seaweed is unknown. In this study, we outplanted nine seaweed growth lines (with 20 individuals each) in three line configurations (vertical, horizontal 2 m depth, and horizontal 4 m depth) in northern New Zealand for grow-out between August 2021 and April 2022. Initial survival rates were similar between line configurations, but only individuals growing on vertical lines survived after four months (38% ± 12 SD). Similarly, on vertical lines, average juvenile growth by elongation was 85% higher (0.11 cm day−1 ± 0.03 SD) and maximum average weight of individuals was 77% higher (106 g WW ± 73 SD), compared to horizontal lines. Unusually warm water temperatures were likely a central driver for the overall high mortality of E. radiata observed from January to April, while a combination of temperature and light stress was likely a central driver for higher mortality observed on vertical lines at shallow depths compared to deeper depths. In conclusion, this study supports farming E. radiata on vertical dropper lines rather than horizontal lines.
Introduction
In New Zealand, the emerging seaweed aquaculture sector has the potential to provide significant economic and environmental benefits, however, no commercial seaweed aquaculture has yet been established and production is still based on wild harvest, beach cast collection, and import (Bradly et al. Citation2021; Clark et al. Citation2021). The native kelp Ecklonia radiata is a target for aquaculture because of its abundant distribution across the country (Shears and Babcock Citation2007), and because of its desirable biomass profile (Stewart et al. Citation1961; Magnusson et al. Citation2017; Nepper-Davidsen et al. Citation2023) that is exploited domestically for production of biostimulants and commercial food products (Bradly et al. Citation2021).
Ecklonia radiata is not currently farmed commercially anywhere in the world (Wiltshire et al. Citation2020), but hatchery farming protocols have recently been developed (Praeger et al. Citation2022a; Praeger et al. Citation2022b). Furthermore, farming trials have previously been carried out in New Zealand and Australia, identifying seasonality and current flow as critical factors, especially for avoiding heavy fouling of the seaweed during the austral summer (Neill et al. Citation2009; Wiltshire et al. Citation2020). In wild populations, the growth of E. radiata is usually fastest in the austral spring and early summer and lowest in the austral winter and autumn, primarily due to seasonal changes in temperature and light, and secondarily due to changes in nutrient levels and water motion (Novaczek Citation1984; Wernberg and Goldberg Citation2008; Bearham et al. Citation2013). Specifically, high temperatures during late summer can cause respiration rates to surpass photosynthetic rates and low light levels during winter may be insufficient to saturate photosynthesis beyond respiratory demands, which in both cases results in a negative net carbon balance and can have a significant negative impact on growth (Staehr and Wernberg Citation2009; Bearham et al. Citation2013). Thus, understanding how E. radiata responds to changes in such environmental factors when farmed on artificial structures (i.e. at sites and environmental conditions where this seaweed may not naturally occur) will be crucial for establishing farm management protocols.
Furthermore, comparative studies on the optimal line configuration for farming of E. radiata have not yet been conducted. Saccharina spp. (the most farmed seaweed genus worldwide, FAO Citation2022) and most other kelp species are generally farmed on horizontal longlines submerged just below the surface of the water (Zhang Citation2018). However, the morphology of E. radiata differs markedly from other commonly farmed kelp species, and optimal line configuration may therefore also differ from other species. Specifically, the morphology of E. radiata is characterised by a thick elongated stipe, which can be several times the length of the lamina, and growth is mostly lateral, whereas Saccharina japonica and Saccharina latissima have a much shorter stipe and growth is longitudinal. In addition, farming of E. radiata in New Zealand is likely to initially occur by utilising existing mussel farm infrastructure consisting of u-shaped vertical droplines extending 5–20 m down into the water column. It is therefore important to test the effect of farming on horizontal and vertical line configurations to identify any potential effects on the survival and growth of E. radiata before large scale farming is undertaken.
In this study we tested aquaculture methods for the farming of E. radiata, utilising existing mussel farm infrastructure. The aims of the study were to (1) compare survival and growth of E. radiata between horizontal and vertical line configurations, and (2) assess E. radiata survival at different depths. Trials were undertaken by transplanting juvenile E. radiata individuals from nearby natural populations. Temporal changes in solar irradiation, water temperature, and fouling were quantified to help understand any drivers of survival and growth.
Materials and methods
Sample collection and experimental design
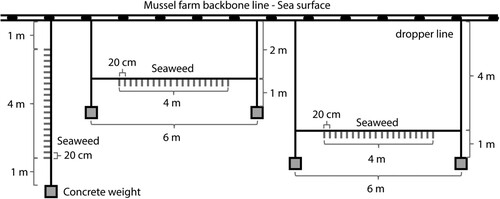
The experiment took place at the Gold Ridge Marine Farms at Esk Point, Coromandel Harbour, New Zealand (). This site is located in the Hauraki Gulf (Tīkapa Moana) at the edge of Coromandel Harbour, approximately 120 m from shore with a maximum depth of approximately 7 m. The site is sheltered by the surrounding coastline and islands. Juvenile E. radiata individuals (stage 1 and 2 individuals; Kirkman Citation1984) were collected under Special Permit 742–743 by scuba diving at Cow Island, Coromandel, New Zealand (approximately 3 km from the farm site) in August 2021. Juveniles (n = 180) with a length of 10–20 cm from the bottom of the stipe to the tip of the central lamina were selected. All individuals were free of fouling and had limited lateral growth (). Selected juveniles were attached to grow lines (10 mm diameter, polypropylene, twisted rope) by splicing them into the twists of the rope so that the holdfast was sticking out through the twist and would be able to subsequently grow around and attach to the rope. The grow lines were attached to three replicate mussel farm backbone lines held up by mussel floats and were deployed in two configurations (). Three vertical grow lines were suspended directly from the backbone lines with the seaweed growing at depths of 1–5 m. Six additional horizontal grow lines were deployed at 2 and 4 m depth (three lines each), suspended between vertical dropper lines attached to the backbone. On each line, 20 individuals were spaced 20 cm apart over the centre 4 m. For each grow line, an identical control line (without seaweed) was deployed adjacent to the grow line to enable estimation of the amount of fouling on the grow line. A concrete weight was attached to the end of all dropper lines and vertical grow (and control) lines to keep them vertical in the water column. Prior to deployment, all grow and control lines were soaked in seawater for 24 h (renewed twice) to remove manufacturing residues and to enable quantification of the wet weight of the grow lines. A greater number of juveniles were collected than were required for outplanting on experimental grow lines. Therefore, two additional vertical grow lines were deployed for qualitative assessment (i.e. not included in the statistical analysis) using these surplus individuals. Juveniles were attached to these additional grow lines in the same way as the experimental grow lines, but at twice the density, i.e. 40 individuals per 4 m line. The experiment was run for a total of 235 days and was concluded in April 2022.
Figure 1. Map of study site showing mussel farm backbone lines at Gold Ridge Marine Farms (left; coordinates: −36.809,761, 175.436973) in Coromandel Harbour, New Zealand (right). Satellite images sourced from Google Earth Pro.
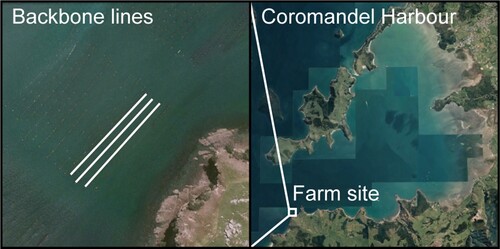
Figure 2. Ecklonia radiata juveniles collected by scuba diving ready for attachment to grow lines (left), and selected individuals spliced onto a grow line (right).
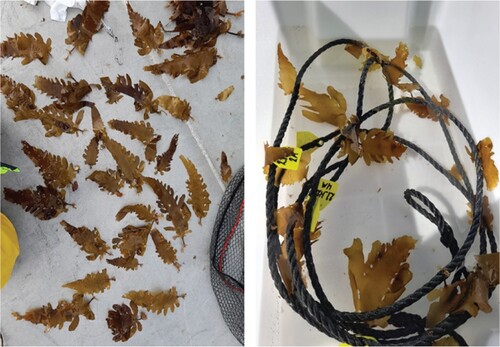
Figure 3. Schematic of grow line configurations showing a vertical line to the left, a horizontal line (2 m depth) in the middle, and a horizontal line (4 m depth) to the right. Individuals were spaced 20 cm apart on the lines.
Seaweed grow line monitoring
Survival, growth, and the degree of fouling on individuals were monitored on five occasions during the experiment (range: 29–62 days between visits), with frequency dependent on accessibility to the farm due to weather and commercial operations. Detached individuals and individuals without a central lamina (e.g. with only a stipe and holdfast remaining) were considered lost, and survival was measured as % of the initial 20 individuals deployed on each grow line that were remaining on the line at each monitoring occasion. The initial length of all individuals was measured at deployment, and lengthwise growth was measured thereafter on every fifth individual on each line during each monitoring visit. Approximately one month post-deployment (October 2021), most individuals had significant lateral growth. Lengthwise growth is therefore only shown for the first two months as it was no longer representative of the overall growth of individuals for the subsequent months. The average weight of each individual (g wet weight, WW) was estimated for each grow line at each monitoring visit using Equation (1). Fouling and the weight of the line were accounted for by subtracting the average weight of control lines from the weight of the grow line. The average weight of all control lines for each month was used in this calculation as the weight of control lines did not significantly differ between configurations for any month (). Grow lines and control lines were weighed on a hanging scale (0.01 kg precision, Burnsco Digital Scale, New Zealand).
(1)
(1)
Table 1. Results of repeated measures permutational multivariate analysis of variance (repeated measures PERMANOVA, top panels) testing for differences in weight of control lines (n = 3), survival (% of the initial 20 individuals remaining on each line at each monitoring period, n = 3), individual weight (n = 3), and relative growth rate (RGR, n = 3) between line configurations, months, replicate lines nested within line configuration (Rep (config)), and the line configuration x month interaction.
Relative growth rate (RGR, day−1) was calculated for each grow line following Equation (2), assuming exponential growth.
(2)
(2)
Where weight2 and weight1 are the average individual weight (kg WW) of each line (following Equationeq. 1(1)
(1) ) at time t2 and time t1 (days) respectively.
Fouling on individuals was visually estimated as the average percent of the thallus covered by fouling organisms across all individuals for each grow line. This approach was used rather than quantifying the amount of fouling on each individual due to time constraints on the water. An approximate range of fouling was estimated on grow lines where fouling was highly variable between individuals, but a single number estimate was made on grow lines where fouling was more uniform among individuals. Additionally, the average weight of the control lines was used to provide an overall estimate of the degree of fouling settling on the line itself (as opposed to the seaweed individuals on the line) for each month.
Twelve temperature and light loggers (HOBO MX2202, Onset, US) were deployed on the three vertical seaweed lines at 1, 2, 3, and 4 m depth (i.e. three replicate loggers for each depth) and measurements were taken once every 10 min between the 29th of September 2021 and the 15th of April 2022. Backbone 3 sank 1–2 m below the surface between November and January because a float had detached, and five loggers ran out of battery or were lost (the first one less than halfway through the experiment). These gaps in the data made it impractical to treat the loggers as separate replicates for analysis as the duration of datasets was different between loggers. Therefore, the average temperature (°C) and light (lum m−2) were calculated for every 10 min measurement for each depth across all available data (i.e. average calculated from 1–3 loggers for each 10 min measurement). An average depth profile for water temperature and light was then calculated from this consolidated data from September to February. Average temperature was calculated between monthly averages (n = 6; all data from September to end of February), and average light intensity was calculated between weekly averages (n = 4) using only data measured during the first week following each visit when loggers were cleaned (due to heavy fouling). Furthermore, all light measurements of 0 (i.e. measurement recorded during night) were excluded from the calculations. A monthly average timeseries between September and April was calculated using the measured temperature at 1 m depth (n = 4032–4464, depending on the number of days in a month), combined with average monthly sea surface temperature (SST) and photoactive radiation (PAR; µmol m−2 s−1) during the past 20 years (July 2002 to June 2022) in the water (0.8 km−2 area) around the farm, which were obtained from the online satellite data portal NIWA-SCENZ (Pinkerton et al. Citation2022).
Data analysis
Differences in juvenile lengthwise growth between August and September were analysed using a one-way ANOVA in R-Studio (Team RStudio Citation2022), with line configuration as a fixed factor. Normality and homogeneity of variance were checked using the Shapiro–Wilk test of normality (shapiro.test; R-Studio) and Levene’s test of equal variance (levenetest; car package, R-Studio). Differences in control line weight, survival, average individual weight, and RGR were analysed using repeated measures permutational multivariate analysis of variance (repeated measures PERMANOVA) in PRIMER 7 (Clarke and Gorley Citation2015) as assumptions for ANOVA were not met and because monthly measurements were not independent of each other (lost individuals cannot grow back). Line configuration and month were included as fixed factors, and replicate lines nested within line configuration were included as random factor. Analyses were run as univariate models for control line weight, survival, average individual weight, and RGR, using Euclidian distance resemblance matrices, 9,999 unrestricted permutations of raw data, and Type III sum of squares. Some significant differences in dispersion among line configurations and months were found using tests of homogeneity of dispersion (PERMDISP – an extension of Levene’s test), however, such difference typically does not significantly inflate the error rates of PERMANOVA (Anderson et al. Citation2016). The linear relationship between survival and depth was analysed using the linear model function (lm; stats) in R-Studio. Legibility of figures was improved in Adobe Illustrator.
Results
Survival
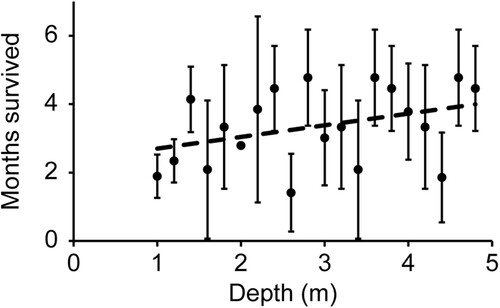
Survival of E. radiata was similar between line configurations during the first three months following deployment (August to November), however five months after deployment (January 2022) there were significant differences among configurations, as indicated by a significant configuration x month interaction effect (, A). By January, all individuals on horizontal lines were lost while on average 38% ± 12 SD of individuals (n = 3) remained on the vertical lines (A). By April 2022 (235 days after deployment) only five of the original 60 individuals were left on the vertical lines and all individuals were lost a year after deployment. Individuals generally survived longer in deeper water on vertical lines, however, the relationship between survival and depth was not significant (linear regression: F1,18 = 2.77, P = 0.11, R2 = 0.13; ). The same pattern was observed on the additional vertical lines, where by February 2022 (176 days after deployment), only 1–2 individuals remained on the upper half of the lines (1–3 m depth) but 9–12 individuals still remained on the lower half (3–5 m depth, data not shown).
Figure 4. Average (± SD, n = 3) survival and growth of E. radiata on three line configurations for each month of monitoring following deployment in August 2021, with (A) survival (% of the initial 20 individuals remaining on each line at each monitoring period) (B) average weight (g WW) of individuals, (C) growth by elongation (cm day-1); only during the first 44 days (August to September) after deployment, and (D) relative growth rate (RGR; day-1). All surviving individuals in April were on the same vertical line.
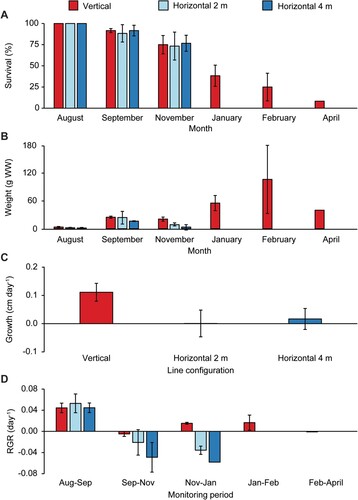
Figure 5. Average (± SD) number of months survived (August to February) per individual as a function of depth for vertical lines (n = 3). Linear regression (dotted line): F1,18 = 2.77, P = 0.11, R2 = 0.13.
Growth rates
The average weight of E. radiata individuals was significantly different among line configurations and between monitoring months, and there was a significant interaction effect between these factors (). The average weight of E. radiata on vertical lines increased exponentially from 4 g WW ± 1 SD per individual (n = 3) at deployment in August up to 106 g WW ± 73 SD per individual (n = 3) in February, after which time weight decreased (B). Meanwhile, weight increase was much lower for individuals growing on horizontal lines, with the average weight of individuals reaching a maximum of only 24 g WW ± 13 SD and 16 g WW ± 1 SD for lines at 2 and 4 m depth, respectively, in September (one month after deployment), before decreasing again. Similarly, growth of juveniles by elongation during the first 44 days after deployment (August to September) was markedly higher for individuals growing on vertical lines (0.11 cm day−1 ± 0.03 SD, n = 3) compared to horizontal lines (2 m depth: 0.00 cm day−1 ± 0.05 SD; 4 m depth: 0.02 cm day−1 ± 0.04 SD), although differences were not significant (C, ). RGR was significantly different among line configurations and between monitoring months (, D). RGR was highest in the austral late winter/early spring (from August to September) for all line configurations, but only individuals on vertical lines maintained a positive growth rate after November.
Fouling
All individuals were fouled to some degree throughout the experiment (range: 5%–75% cover of fouling on thallus, n = 9; ). Fouling of E. radiata was highest in the austral spring (September to November), where seaweed on horizontal lines were generally more fouled than seaweed on vertical lines. However, fouling was highly variable between individuals on replicate lines during this season, with two of the vertical replicate lines showing little fouling among individuals (range: 5%–25% thallus cover) and one replicate line showing high fouling on some individuals (range: 5%–75% thallus cover). During the austral summer (December to February), fouling was lower and less variable among the surviving individuals on the vertical lines (range: 10%–33% thallus cover, n = 3). A similar pattern was detected for fouling on the line itself (as opposed to fouling on the seaweed), where control lines were heaviest and had the highest densities of fouling organisms in spring (September and November, ).
Figure 6. Average (± SD) weight (kg WW) of control lines for each monitoring month (n = 9).
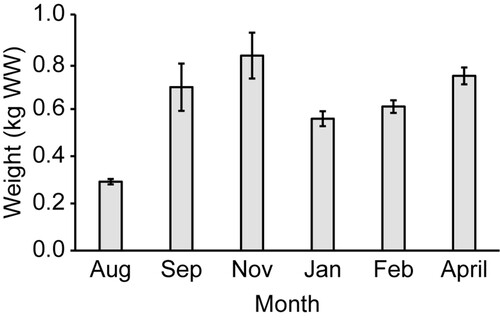
Table 2. Fouling of seaweed individuals (% cover of thallus) on three line configurations from September 2021 to February 2022, estimated by eye as the average percent of thallus covered in fouling across all individuals on each replicate line (Rep).
Temperature and irradiation
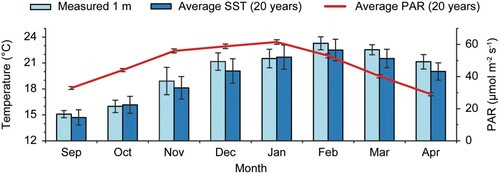
Water temperature (averaged across 1–4 m depth) ranged from 14.7–21.7 °C during the austral spring (first measurement; 29th of September), from 18.5–24.7 °C during the austral summer (highest temperature: 12th of February), and from 19.5–24.0 °C during the austral autumn (last measurement; 15th of April). Both water temperature and irradiance decreased with depth, although this effect was only minor for temperature (). The average water temperature between September and February (average between months) was 1.2% lower at 4 m depth (19.1 °C ± 3.2 SD, n = 6) compared to 1 m depth (19.3 °C ± 3.3, n = 6). In contrast, irradiance between September and February was 54.8% lower at 4 m depth (3,628 lum m−2 ± 969 SD, n = 4) compared to 1 m depth (8,026 lum m−2 ± 1,140 SD, n = 4). The average measured temperature at 1 m depth during the experiment was 0.6 ⁰C above the average SST at the farm during the past 20 years from September to April, reaching a maximum of 1.1 ⁰C above the monthly 20-year average in December (; Pinkerton et al. Citation2022). Average monthly photosynthetically active radiation (PAR; µmol m−2 s−1) peaked between November and January, with January showing the highest average light radiation.
Figure 7. Depth profiles of average (± SD) water temperature (⁰C) and light (lum m-2) from the 29th of September 2021 to 28th of February 2022. Measurements were taken once every 10 min, and water temperature is show as average between months (n = 6) and light is shown as average between weeks (n = 4), including only light data measured during the first week following each visit and omitting values of zero (night measurements).
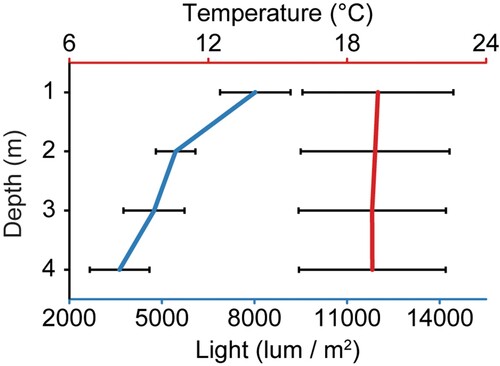
Figure 8. Average (± SD) measured monthly temperature (⁰C) at 1 m depth at the farm during the trial (light blue bars), average (± SD) monthly sea surface temperature (SST) at the farm during the last 20 years (dark blue bars), and average (± SD) monthly photosynthetically active radiation (PAR; µmol m-2 s-1) at the farm during the last 20 years (red line). SD’s on light blue bars express variation within months during the experiment (n = 4032–4464, depending on the number of days in a month), and SD’s on dark blue bars and the red line express variation between months during the last 20 years (n = 20). Average monthly SST and PAR are obtained from the online data portal NIWA-SCENZ (Pinkerton et al. Citation2022).
Discussion
Line configuration
This study compared survival and growth of E. radiata on horizontal long lines (similar to farming methods for other commercially farmed kelps; lines at 2 and 4 m depth tested) and on vertical dropper lines (similar to farming methods for mussels). Although survival was similar between line configurations during the first three months (August to November), growth of E. radiata during this time (measured by average individual weight) was exponential on vertical lines, but was limited on horizontal lines. Similarly, elongation rates for juvenile individuals (during spring) were by far highest on vertical grow lines (average: 0.11 cm day−1 ± 0.03 SD, n = 3), but were lower than those reported for natural populations of adult E. radiata in Australia during the same period (average: 0.19 ± 0.1 SD and 0.16 ± 0.01 SD, at 3 and 5 m depth respectively; Fairhead and Cheshire Citation2004). Although, the RGR was comparable for all line configurations in the August to September period, it was higher for vertical lines compared to horizontal lines in all subsequent months. In accordance with the low growth observed on horizontal lines, most individuals on these lines were more severely fouled and eroded compared to individuals on the vertical lines. Furthermore, all individuals were lost on horizontal lines during the austral summer (i.e. by January), while 25% of individuals on vertical lines still remained by February. This is the first time that survival and growth of E. radiata on different line configurations has been investigated, and our results show that survival and growth are higher on vertical lines compared to horizontal lines, when growing at 1–5 m depths in shallow semi-sheltered waters.
Light and temperature
A decrease in kelp abundance during summer is often driven by high water temperatures (Pehlke and Bartsch Citation2008; Moy and Christie Citation2012) which may cause respiration rates to exceed photosynthetic rates, resulting in a net carbon loss (e.g. Gerard Citation1988; Bearham et al. Citation2013). High summer temperatures have previously been identified as a main driver for reduced growth in E. radiata (Kirkman Citation1984), and water temperatures above 20–21 °C are associated with negative growth for E radiata in Australia (Hatcher et al. Citation1987; Bearham et al. Citation2013). Notably, high water temperature at 1 m depth were observed in this study (compared to the 20-year average SST), where the average monthly temperature exceeded 21 °C from December to April (). In fact, a 29-week continuous marine heat wave was observed in the Hauraki Gulf (location of the farm) from November 2021 to May 2022, reaching a maximum intensity of 3.8 °C above average temperature in late November to early December (Bell et al. Citation2022). Although upper thermal limits for survival may differ for E. radiata in Australia and New Zealand as thermal responses in kelp are often related to local growth conditions (Gerard and Bois Citation1988; Staehr and Wernberg Citation2009), heat stress was likely a central driver for the high mortality of E. radiata observed in the current study from January to April.
Average survival of E. radiata increased with increasing depth for the three experimental vertical lines, with the same pattern observed on the additional vertical lines that were not included in the formal analyses. Similarly, in a previous farming trial in New Zealand, all surviving individuals of E. radiata were found at the lowest measured depth (6 m) by the end of the trial (Neill et al. Citation2009), and in the North Sea, growth of farmed Saccharina latissima increased with depth between 2 and 8 m (Handå et al. Citation2013). In this study, average monthly water temperature was unusually high in November and December, and during this time the water temperature at 1 and 4 m depth reached a maximum difference of 2.0 °C or more on 17 days (non-consecutive, data not shown). However, from September to February, the average water temperature at 4 m depth was only 0.2 °C (1.2%) lower than at 1 m depth. Therefore, it is unlikely that thermal stress alone explains the higher survival of individuals with increased depth. In comparison, average light levels (September to February) decreased considerably with depth and were 55% lower at 4 m depth relative to 1 m depth. Exposure to high light levels may cause photoinhibition, reducing photosynthetic performance, and may also cause oxidative stress, when energy absorption by photosynthetic pigments exceeds what can be utilised for photochemistry (Adams III et al. Citation2008). Furthermore, seaweed may be more susceptible to photoinhibition and light-related oxidative stress during heat stress, as high temperatures may reduce photosynthetic rates and thereby lower the capacity to utilise absorbed energy (Bruhn and Gerard Citation1996; Lesser Citation2006; Heinrich et al. Citation2012). Daily irradiation peaked during the months of high mortality (November to February, ), and the higher mortality of E. radiata in shallower waters may therefore be due to a combination of light and temperature stress. Further indicating that light stress was contributing to mortality during summer, wild individuals were observed in the upper 1 m of the water column in February growing in the shade attached to the underside of large floats on the farm. In contrast to the unhealthy individuals on the grow lines growing in full light, wild individuals under the floats were healthy in condition. However, although high light stress may be a crucial factor for survival in the upper layers of the water during summer, insufficient light in deeper water may also increase mortality as more light may be needed during elevated temperatures in summer to compensate for low photosynthetic efficiency and increased respiration rates (Staehr and Wernberg Citation2009). Indeed, in New Zealand, natural populations of E. radiata grew faster and were more abundant at 7 m depth compared 15 m depth (Novaczek Citation1984) and laminarian kelp forests generally decline in density at around 12–14 m depth, although dispersal has been observed down to 65 m depth (Choat and Schiel Citation1982). Thus, the optimal farming depth for E. radiata is likely to be somewhere below the upper portion of the water column where light stress is severe, but above the point where light levels become insufficient for obtaining positive net photosynthesis.
Implications for aquaculture
Juveniles of E. radiata on vertical lines grew to maturity (average individual weight: 106 g WW, n = 3 lines) within 6 months of deployment (from August to February), however, survival decreased markedly during summer. High mortality and low growth rate during summer have previously been observed in E. radiata farming trials, recommending farming from early autumn to late spring to avoid high temperatures and fouling during summer (Neill et al. Citation2009; Wiltshire et al. Citation2020). Though growth rate is usually slower during autumn and winter (Wernberg and Goldberg Citation2008; Bearham et al. Citation2013), the kelp is typically outplanted earlier in the year (e.g. early autumn) to increase growing time before a potential harvest in late spring/early summer, and to possibly lower overall mortality (Broch et al. Citation2019; Hwang et al. Citation2020). Previous studies on E. radiata in New Zealand and on commercial northern hemisphere kelp species have found fouling to be heaviest during summer (Neill et al. Citation2009; Handå et al. Citation2013). In contrast, we found that fouling was most prevalent in spring. However, we may have missed the peak of fouling during the summer months as monitoring was not conducted in December. The negative physiological effects of temperature are likely to be most prevalent at shallow sheltered sites as water temperature at these sites will often be higher compared to deeper and more exposed sites (Bearham et al. Citation2013). In the current study, E. radiata was farmed within 50 m of the shore in a semi-sheltered area (outer Coromandel Harbour) and higher growth and survival rates may therefore be achieved in a setting further off-shore that has higher flow rates and deeper waters. The unusually high water temperatures (compared to the 20-year average) observed during November and December likely contributed to the high mortality of E. radiata observed between November and January (Moy and Christie Citation2012; Nepper-Davidsen et al. Citation2019), and thus, results of the current study may not necessarily represent a general scenario. However, marine heat waves are predicted to become more frequent, longer lasting and more extreme as global warming intensifies (Oliver et al. Citation2018). Therefore, adapting to these environmental changes will be crucial for future-proofing a successful kelp farming industry in New Zealand. Such adaptations could be (1) choosing farm sites and farming depths accordingly (Choat and Schiel Citation1982; Novaczek Citation1984), (2) harvesting before summer temperatures reach harmful intensities, and (3) selecting and breeding more heat tolerant cultivars (Hwang et al. Citation2019).
This study constituted the first practical step in an ongoing development of farming practices for E. radiata in New Zealand. The aim was to provide an initial proof of concept, fast tracking results on farm line configuration to inform future outplanting procedures for hatchery seeded spores to be conducted at a later stage within the larger programme (see acknowledgements). It is important to note that the presented results are based on transplanted wild collected seaweed individuals and therefore are not necessarily transferable to farming trials employing a hatchery phase, which would be included in an actual aquaculture setting. In conclusion, this study supports farming E. radiata on vertical dropper lines rather than horizontal lines, but given the overall high mortality, and unusually high SST during the experiment, we recommend that line configuration is tested further using hatchery seeded lines.
Authors’ contribution
JN-D: investigation, field work, data analysis, visualisation, and writing – original draft, review, and editing. MM: conceptualisation, design, field work, supervision, funding, and writing – review, and editing. CG: supervision, writing – review, and editing. RL: conceptualisation, design, field work, supervision, and writing – review, and editing. All authors contributed to the article and approved the submitted version.
Acknowledgements
The authors thank Gold Ridge Marine Farms for use of infrastructure and for technical and operational assistance, Peter Randrup for extensive field work assistance, and Holly Fergusson, Logan Forsythe, and Katherine Rowe for diving and field work assistance.
Disclosure statement
No potential conflict of interest was reported by the author(s).
Data availability statement
The datasets generated and analysed during the current study are available from the corresponding author on reasonable request.
Additional information
Funding
References
- Adams III WW, Zarter CR, Mueh KE, Amiard V, Demmig-Adams B. 2008. Energy dissipation and photoinhibition: a continuum of photoprotection. In: Demming-Adams B, Adams W, Mattoo A, editors. Photoprotection, photoinhibition, gene regulation and environment. Dordrecht: Springer Netherlands; p. 49–64.
- Anderson MJ, Gorley RN, Clarke KR. 2016. PERMANOVA ± for PRIMER: guide to software and statistical methods. Plymouth: PRIMER-E Ltd.
- Bearham D, Vanderklift MA, Gunson JR. 2013. Temperature and light explain spatial variation in growth and productivity of the kelp Ecklonia radiata. Marine Ecology Progress Series. 476:59–70. doi:10.3354/meps10148.
- Bell JJ, Smith RO, Micaroni V, Strano F, Balemi CA, Caiger PE, Miller KI, Spyksma AJP, Shears NT. 2022. Marine heat waves drive bleaching and necrosis of temperate sponges. Curr Biol. 33:1–6.
- Bradly N, Syddall V, Ingram C, Clarkson R, Elliot A, Adams S. 2021. Stocktake and characterisation of aotearoa New Zealand’s seaweed sector: market and regulatory focus. Auckland: EnviroStrat.
- Broch OJ, Alver MO, Bekkby T, Gundersen H, Forbord S, Handå A, Skjermo J, Hancke K. 2019. The kelp cultivation potential in coastal and offshore regions of Norway. Frontiers in Marine Science. 5:1–15. doi:10.3389/fmars.2018.00529.
- Bruhn J, Gerard VA. 1996. Photoinhibition and recovery of the kelp Laminaria saccharina at optimal and superoptimal temperatures. Marine Biology. 125(4):639–648. doi:10.1007/BF00349245.
- Choat JH, Schiel DR. 1982. Patterns of distribution and abundance of large brown algae and invertebrate herbivores in subtidal regions of northern New Zealand. Journal of Experimental Marine Biology and Ecology. 60:129–162. doi:10.1016/0022-0981(82)90155-1.
- Clark D, Newcombe E, Clement D, Magnusson M, Lawton R, Glasson R, Major R, Adams S. 2021. Stocktake and characterisation of Aotearoa New Zealand’s seaweed sector: environmental effects of seaweed wild-harvest and aquaculture. Nelson: Cawthron.
- Clarke KR, Gorley RN. 2015. PRIMER v7: user manual/tutorial. Plymouth: PRIMER-E Ltd.
- Fairhead VA, Cheshire AC. 2004. Rates of primary productivity and growth in Ecklonia radiata measured at different depths, over an annual cycle, at West Island, South Australia. Marine Biology. 145(1):41–50. doi:10.1007/s00227-004-1308-8.
- FAO. 2022. The state of world fisheries and aquaculture 2022. Towards blue transformation. Rome: Food and Agriculture Organisation of the United Nations.
- Gerard VA. 1988. Ecotypic differentiation in light-related traits of the kelp Laminaria saccharina. Marine Biology. 97(1):25–36. doi:10.1007/BF00391242.
- Gerard VA, Bois D,RK. 1988. Temperature ecotypes near the southern boundary of the kelp Laminaria saccharina. Marine Biology. 97(4):575–580. doi:10.1007/BF00391054.
- Handå A, Forbord S, Wang X, Broch OJ, Dahle SW, Størseth TR, Reitan KI, Olsen Y, Skjermo J. 2013. Seasonal- and depth-dependent growth of cultivated kelp (Saccharina latissima) in close proximity to salmon (Salmo salar) aquaculture in Norway. Aquaculture. 414–415:191–201.
- Hatcher B, Kirkman H, Wood WF. 1987. Growth of the kelp Ecklonia radiata near the northern limit of its range in western Australia. Marine Biology. 95:63–73. doi:10.1007/BF00447486.
- Heinrich S, Valentin K, Frickenhaus S, John U, Wiencke C. 2012. Transcriptomic analysis of acclimation to temperature and light stress in Saccharina latissima (Phaeophyceae). PLoS One. 7(8):e44342–13. doi:10.1371/journal.pone.0044342.
- Hwang EK, Cho HG, Kim JK. 2020. Seaweed resources of Korea. Botanica Marina. 63:395–405. doi:10.1515/bot-2020-0007.
- Hwang EK, Yotsukura N, Pang SJ, Su L, Shan TF. 2019. Seaweed breeding programs and progress in eastern Asian countries. Phycologia. 58(5):484–495. doi:10.1080/00318884.2019.1639436.
- Kirkman H. 1984. Standing stock and production of Ecklonia radiata (C.Ag.). Journal of Experimental Marine Biology and Ecology. 76:119–130. doi:10.1016/0022-0981(84)90060-1.
- Lesser MP. 2006. Oxidative stress in marine environments: biochemistry and physiological ecology. Annual Review of Physiology. 68(1):253–278. doi:10.1146/annurev.physiol.68.040104.110001.
- Magnusson M, Yuen AKL, Zhang R, Wright JT, Taylor RB, Maschmeyer T, de Nys R. 2017. A comparative assessment of microwave assisted (MAE) and conventional solid-liquid (SLE) techniques for the extraction of phloroglucinol from brown seaweed. Algal Research. 23:28–36. doi:10.1016/j.algal.2017.01.002.
- Moy FE, Christie H. 2012. Large-scale shift from sugar kelp (Saccharina latissima) to ephemeral algae along the south and west coast of Norway. Marine Biology Research. 8(4):309–321. doi:10.1080/17451000.2011.637561.
- Neill K, Miller S, Allen S, Heath P. 2009. Experimental culture of the kelp Ecklonia radiata. Wellington: National Institute of Water and Atmospheric Research internal report.
- Nepper-Davidsen J, Andersen DT, Pedersen MF. 2019. Exposure to simulated heatwave scenarios causes long-term reductions in performance in Saccharina latissima. Marine Ecology Progress Series. 630:25–39. doi:10.3354/meps13133.
- Nepper-Davidsen J, Glasson CRK, Lawton RJ, Magnusson M. 2023. High spatial and temporal variation in biomass composition of the novel aquaculture target Ecklonia radiata. J. Appl. Phycol. 35:1755–1768. doi:10.1007/s10811-023-02969-2.
- Novaczek I. 1984. Development and phenology of Ecklonia radiata at two depths in goat island Bay, New Zealand. Marine Biology. 81:189–197. doi:10.1007/BF00393117.
- Oliver ECJ, Donat MG, Burrows MT, Moore PJ, Smale DA, Alexander LV, Benthuysen JA, Feng M, Gupta S, Hobday A, J A, et al. 2018. Structural absorption by barbule microstructures of super black bird of paradise feathers. Nature Communications. 9(1):1–12. doi:10.1038/s41467-017-02088-w.
- Pehlke C, Bartsch I. 2008. Changes in depth distribution and biomass of sublittoral seaweeds at Helgoland (North Sea) between 1970 and 2005. Climate Research. 37:135–147. doi:10.3354/cr00767.
- Pinkerton M, Gall M, Steinmetz T, Wood S. 2022. NIWA seas, coasts and estuaries New Zealand (NIWA-SCENZ): image services of satellite (MODIS-Aqua) water quality products for coastal New Zealand. Data product version 1.0. Wellington: National Institute of Water and Atmospheric Research. [accessed 2023 Jan 10]. https://data-niwa.opendata.arcgis.com/documents/niwa-scenz-ocean-colour-application/explore.
- Praeger C, Magnusson ME, Lawton RJ. 2022a. Optimising the zoospore release, germination, development of gametophytes and formation of sporophytes of Ecklonia radiata. Journal of Applied Phycology. 34:2535–2549. doi:10.1007/s10811-022-02806-y.
- Praeger C, Magnusson ME, Lawton RJ. 2022b. Successful initiation of sorus formation and viable zoospores in Ecklonia radiata on isolated lateral fronds under hatchery conditions. J Appl Phyco. 35:739–751. doi:10.1007/s10811-022-02894-w.
- Shears NT, Babcock RC. 2007. Quantitative description of mainland New Zealand’s shallow subtidal reef communities. Wellington: Department of Conservation.
- Staehr PA, Wernberg T. 2009. Physiological responses of Ecklonia radiata (Laminariales) to a latitudinal gradient in ocean temperature. Journal of Phycology. 45(1):91–99. doi:10.1111/j.1529-8817.2008.00635.x.
- Stewart CH, Higgins HG, Austin S. 1961. Seasonal variation in alginic acid, mannitol, laminarin and fucoidin in the brown alga, Ecklonia radiata. Nature. 192:1208. doi:10.1038/1921208a0.
- Team RStudio. 2022. RStudio: integrated development environment for R. RStudio. Boston, MA: PBC. http://www.rstudio.com/.
- Wernberg T, Goldberg N. 2008. Short-term temporal dynamics of algal species in a subtidal kelp bed in relation to changes in environmental conditions and canopy biomass. Estuarine, Coastal and Shelf Science. 76(2):265–272. doi:10.1016/j.ecss.2007.07.008.
- Wiltshire KH, Gurgel CFD, Marty D, Jason T. 2020. Application of seaweeds to integrated multi-trophic aquaculture in southern Australia: identifying and investigating suitable native species [dissertation]. Adelaide, SA: The University of Adelaide.
- Zhang J. 2018. Seaweed industry in China. Beijing: Innovation Norway.