
 ?Mathematical formulae have been encoded as MathML and are displayed in this HTML version using MathJax in order to improve their display. Uncheck the box to turn MathJax off. This feature requires Javascript. Click on a formula to zoom.
ABSTRACT
Marine species are facing an increasing number of stressors and some species once thought to be resilient to change are now threatened. It is important to understand how species populations have changed through time so that management can be adjusted accordingly, and so that achievable restoration goals can be set. However, many species lack population data at multidecadal or longer time scales. Using historical data from the 1970s, this study investigates how the dynamics of a New Zealand abalone (Haliotis iris), or pāua, population at Peraki Bay changed over a 45-year period. No commercial fishing of the population occurred prior to the initial survey and limited commercial catch has been reported between surveys. Repeat monitoring of the H. iris population at a 45-year interval indicates that a large change in population size and structure had occurred. Since 1976, there has been an 84% decrease in estimated population size. The remaining population is restricted to where juveniles were found in the original survey. These findings are consistent with conclusions, made from modelling in the 1970s, that the population seen in the 1970s was not stable and that a possible cause was temporal variability in population recruitment.
Introduction
Over recent decades, the functioning of marine ecosystems has been impacted by a warming climate and an increasing human reliance on ocean resources (Jackson et al. Citation2001; Halpern et al. Citation2008; Duarte et al. Citation2020). As a result, population declines, shifts in species ranges, and local extinctions have occurred (Dulvy et al. Citation2003; Cheung et al. Citation2009; McCauley et al. Citation2015; Hastings et al. Citation2020). Exploited species are subject to increased pressure as the removal of individuals can modify population structure and amplify the effects of climate and other environmental changes (Planque et al. Citation2010; Gamelon et al. Citation2019). As a result, many fisheries have declined causing alteration of food webs and loss of livelihoods (Pauly et al. Citation2002; Roberts Citation2007; Smith et al. Citation2011). Stock estimates prior to exploitation are extremely rare, and the lack of data on historical abundances and ranges is a significant problem in fisheries management (Zeller et al. Citation2005; McClenachan et al. Citation2012). Historical data provide a reference point of past abundance and are important in avoiding a gradual shift in stock baseline assessments, known as the ‘shifting baseline syndrome’ (Pauly Citation1995).
Species that inhabit shallow coastal ecosystems are easily accessible and are exposed to a wide range of stressors (Hobohm et al. Citation2021). Abalone (Haliotidae) are a marine gastropod that inhabit intertidal and subtidal rocky reefs. Many species of abalone are of significant cultural and spiritual importance to indigenous people and have been an important food source for thousands of years (Cox Citation1962; Sloan Citation2003; Menzies Citation2010). Abalone are also highly prized commercially, driven by both high demand and price (Raemaekers et al. Citation2011; Braje and Bentz Citation2021) and also support significant recreational fisheries (Tarr Citation2000; Hart et al. Citation2013; Woolford Citation2019). The life history traits of abalone, including recruitment, vary on small scales making them difficult to manage (Mullon et al. Citation2005). As highly prized, long-lived species, with variable life history traits, abalone are susceptible to multiple stressors such as environmental change (e.g. sedimentation), disease, and overfishing (Hahn Citation1989; Karpov et al. Citation2000; Onitsuka et al. Citation2008; Rogers-Bennett et al. Citation2010; Morash and Alter Citation2016). For example, the reproduction of abalone, from spawning to larvae settlement, relies on external biological, environmental and chemical cues (Geiger and Owen Citation2012). Therefore, physical stressors (e.g. sedimentation) and changes in ocean chemistry (e.g. temperature, salinity and pH) can reduce successful fertilisation and larval settlement (Onitsuka et al. Citation2008; Guo et al. Citation2015; Kavousi et al. Citation2022). Due to a range of stressors, the collapse of many abalone fisheries has been observed globally (Tegner Citation1993; Karpov et al. Citation2000; Shepherd et al. Citation2001), and some species that were once abundant are now threatened or have collapsed (Lessard and Campbell Citation2007).
The New Zealand abalone (Haliotis iris, blackfoot pāua) has been harvested for hundreds of years (Smith Citation2013). Haliotis iris are considered a taonga (treasure) and a cultural keystone species for indigenous Māori (Garibaldi and Turner Citation2004; McCarthy et al. Citation2014). Traditionally, kaitiakitanga (guardianship) was exercised with the use of mātauranga Māori (Māori knowledge) to manage the fishery. Today, H. iris support large commercial and recreational fisheries and are managed under the Quota Management System (QMS) via input and output controls, such as catch limits and a minimum legal harvestable size (MLS) of 125 mm shell length (Fisheries (Amateur Fishing) Regulations 1986; Fisheries (Commercial Fishing) Regulations 2001). Since its introduction into the QMS in 1986, abalone Total Allowable Commercial Catch (TACC) has declined from 1261 to 936 t, and commercial landings have declined from 1078 to 706 t (Fisheries New Zealand Citation2007; Fisheries New Zealand Citation2021a). Landings often do not reach the TACC limit as some fishers voluntarily shelve (do not fish) their quota as they believe stocks are not healthy enough to fish at the regulated level (Fisheries New Zealand Citation2009; Fisheries New Zealand Citation2021b; Fisheries New Zealand Citation2021c). The QMS comprises 12 Quota Management Areas (QMAs). Some areas are doing well, while others have had ongoing declines (Marsh Citation2019; Fisheries New Zealand Citation2021b; Fisheries New Zealand Citation2021c). As a result, access to H. iris has been greatly reduced in some areas, concerning local communities (McCarthy et al. Citation2014; Bennett-Jones et al. Citation2021). Excessive recreational harvest is also an issue in more accessible areas (Gerrity and Schiel Citation2023). For example, in Kaikōura, 839 recreational H. iris fishers were recorded in the water in one day in 2022 (Holdsworth Citation2022). This excessive recreational take was significant as the H. iris fishery in this area had been under a five-year emergency closure after the 2016 Kaikōura earthquake caused mass mortality and substantial habitat damage (Gerrity and Schiel Citation2023). Recreational limits are daily (generally 10 H. iris per person per day) with no annual limit. Concerns over reduced access and stock declines have prompted a number of reseeding and translocation attempts (Roberts et al. Citation2007; Gillies Citation2014; Bennett-Jones et al. Citation2021; Pāua Industry Council Citation2023).
In a rare opportunity, this study utilises the availability of comprehensive historical population data from Sainsbury (Citation1977, Citation1982a) to evaluate how a population of H. iris has changed since the 1970s. Peraki Bay (the commonly used French version of the original Māori name Pireka) is a long and narrow bay located on the southern side of Banks Peninsula, South Island, New Zealand (). The H. iris in Peraki Bay have a low maximum shell length, a slow growth rate, and were predicted to have an unstable population structure and episodic recruitment (Sainsbury Citation1982a, Citation1982b). The 1970s surveys provided a baseline of abundance, size structure, and population dynamics before exposure to a commercial fishery or a range of new environmental stressors (Sainsbury Citation1982a). Although limited by two sampling events, repeating these surveys over 45 years later allows long-term changes to be examined, modelling predictions to be tested (Sainsbury Citation1982b), and future management to be adjusted accordingly.
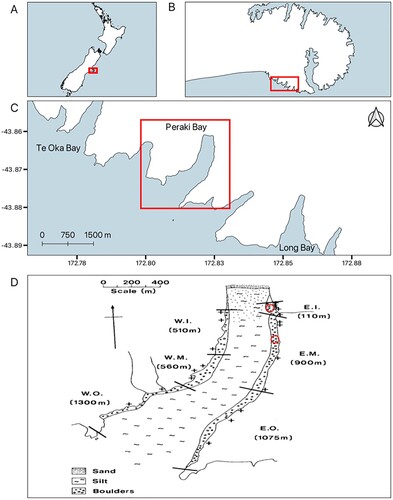
Figure 1. Location of study site. A, Map of New Zealand with B an enlarged map of Banks Peninsula, C, an enlarged map of Peraki Bay and surrounding Bays, D, Peraki Bay with transect locations completed in 1976 and 2021 (+), tagging locations (red circles), substrate types, and sampling strata (between black lines): W.I., western inner; W.M., western middle; W.O., western outer; E.I., eastern inner; E.M., eastern middle; E.O., eastern outer (adapted from Sainsbury 1982). The tagging location in E.I. is where tagging occurred in 2021, whereas the tagging location in E.M. is where tagging occurred in 1976.
Methods
Study location
The east and west sides of Peraki Bay are surrounded by steep cliffs, except for a boulder beach in the northeastern corner. Below the cliffs sits a narrow strip (<50 m) of bedrock and boulders covered in dense canopies of Carpophyllum maschalocarpum. The centre of Peraki Bay consists of silt substrate at a maximum depth of around 18 m. Peraki Bay has been subject to commercial fishing since Sainsbury’s survey and falls into the H. iris QMA PAU3B. The current TACC for PAU3B is 46,000 kg (Ministry of Fisheries Citation2023). Most of the catch around Banks Peninsula comes from headlands as H. iris inside the bays tend to be too small (Martin Pattison, personal communication). However, since 2016, an annual average of approximately 250 kg of H. iris have been harvested from within Peraki Bay (Pāua Industry Council, unpublished data). Recreational fishing is not recorded in New Zealand so there is no data or estimates of recreational catch in Peraki Bay or the surrounding area. Although there have been cases of illegal H. iris fishing noted around Peraki Bay, none have been reported in the bay (New Zealand Press Association Citation2009, Citation2010). The Peraki Bay population was resurveyed in 2021 using the same survey methods applied in the 1970s.
Size structure
To determine the size structure of the population in 2021, 19 transects perpendicular to the shoreline were completed at the same locations used in 1976 (D). The original locations of transects were determined using a stratified random sampling technique as variation in density and size composition was observed throughout Peraki Bay (Sainsbury Citation1977). Therefore, Peraki Bay was divided into six sampling strata: ‘inner’, ‘middle’, and ‘outer’ on the east and west sides of the bay to reduce variances in population estimates. Transects began at the low tide mark (identified by the highest presence of crustose coralline algae) and extended to the end of hard substrate (6–50 m long). Using a 1-m pole as a guide, two divers swam down the transect measuring all H. iris that fell within 50 cm on either side of the transect. Total shell length was measured to the nearest millimetre with Vernier callipers. To uncover cryptic individuals (typically juveniles), boulders were carefully moved and replaced during searches.
Population size estimates were calculated for each stratum separately using the method for belt transects outlined in Seber (Citation1982, pp. 26–28). The area of available habitat for each stratum was calculated as the length of the coastline multiplied by the mean transect length. The estimates for all strata were then added together to calculate the total population size.
Growth
To estimate the growth of adult H. iris, 284 individuals ranging from 70 to 122 mm were tagged in November 2019 in the eastern inner (E.I.) stratum (D) between 0.5 and 3.9 m depth. Underwater, H. iris larger than 70 mm were gently removed, and tagged with a numbered self-locking cable tie tag (Hallprint, Australia) through a respiratory pore. Total shell length was measured to the nearest mm then individuals were carefully returned. Recapture surveys of tagged H. iris were carried out in March 2021 with a time at liberty of 468 days (1.28 years). In 1975, 150 individuals were tagged using a tag glued externally to the shell. Tagging was in the inner quarter of the eastern middle (E.M.) stratum (D) and time at liberty ranged from 33 to 402 days (0.09–1.102 years). The distance between tagging locations was 370 m. Maximum likelihood estimates of the von Bertalanffy growth equation parameters were calculated using the method of Sainsbury (Citation1980).
Mortality
Total mortality (Z) was estimated using two methods (Beverton and Holt Citation1956; Ssentongo and Larkin Citation1973). These methods use size frequency data and estimated parameters of the von Bertalanffy growth equation. The assumptions of these methods are that growth is described by the same von Bertalanffy equation, that recruitment and mortality are constant, and that the population has a stable age structure. Although the assumptions of these methods can often be violated by abalone populations, they can provide reliable estimates of mortality and have been found to be similar to estimates using Pauly’s empirical mortality equation and the Jolly-Seber tag recapture model (Rogers-Bennett et al. Citation2007). Furthermore, Sainsbury (Citation1982a) found the Beverton and Holt (Citation1956) method to provide similar estimates for mortality as the population model described in Sainsbury (Citation1982b) that does not have the assumption of a stable population.
Reproduction and recruitment
To monitor spawning at Peraki Bay both Sainsbury (Citation1982a) and this study calculated gonad indices of mature individuals (>100 mm shell length) using the method described in Poore (Citation1973b). Samples were taken in November 2019, November 2020, and March 2021. Sampling periods were targeted around the start and end of summer as this is when the largest change in gonad indices was expected (Sainsbury Citation1982a). Samples of 10–15 individuals were collected by snorkelers in 0.5–2 m of water from the E.I. and western inner (W.I.) strata (D). For each individual, maximum shell length, width, and height were measured to the nearest mm. Shell weight and total weight (g) were measured to the nearest mg using an electronic balance. Once individuals had been sexed, the gonads and hepatic gland were removed with scissors, weighed, and then preserved in 10% formalin. The gonad and hepatic gland were sectioned one-third of the distance from the shell apex and the gonad index was then calculated as:
To estimate fecundity, the gonads of females were carefully dissected from the hepatic gland and gently broken up in 100 ml of seawater. Samples were then mechanically agitated for 24 h using a shaker table. Three 1 ml samples were taken from each gonad seawater mix and the number of yolky eggs were counted using a counting chamber and a microscope at 400x magnification.
Using the method for belt transects by Seber (Citation1982), recruitment of juvenile H. iris was estimated for February 1976 and 2021 using the results from the size structure transects surveys conducted at this time. Sainsbury (Citation1977) classed recruitment as the number of +1 year-old individuals (24–56 mm). However, as data were available as pooled size frequency data and the length frequency of 1–3 year-old animals overlap (Sainsbury Citation1977), recruits were classed as individuals ≤60 mm. The data from 1976 were re-analysed to account for the change in recruit size range.
Data analysis
The majority of the raw data from Sainsbury 1973 no longer exists. However, growth and pooled size frequency data could be extracted from the appendices of Sainsbury (Citation1977) for comparisons. As only limited data was available, for analyses of reproduction, figures from Sainsbury 1973 were digitised in R (R Core Team Citation2021) using the package metaDigitise (Pick et al. Citation2018). As size frequency data from 1976 were only available in size classes, to make statistical comparisons of size composition, the middle value of a size class was used as length (e.g. 65 mm for H. iris in size class 61–70 mm). The size structures were then analysed using a Kolmogorov–Smirnov test. For comparisons of individual growth rates, the time at liberty in 1975/1976 varied from 33 days to 402 days, whereas in this study time at liberty was 468 days. As growth rates can vary temporally, only recaptures after 241 days (0.81–1.1 years) were used from the 1970s data. A Kruskal–Wallis test was used for the analysis of fecundity and recruitment because of unequal variance of the residuals. Post hoc analyses of fecundity were performed using a Games-Howell post hoc test. All strata were combined for analysis. Weighted means were calculated for individual growth and total mortality where the weight was the inverse of the standard error. Weighted standard errors were calculated using the Cochran (Citation1977) method (Gatz and Smith Citation1995). All statistical analyses were run in R (R Core Team Citation2021).
Results
Size and structure
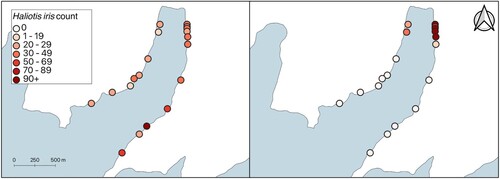
Since 1976, the total estimated number of H. iris in Peraki Bay has declined. The estimated number of H. iris in 1976 was 179,693 ± 43,144 (95% confidence interval) whereas, in 2021, the estimated total population number was 29,286 ± 13,337. This 84% decline in estimated abundance was largely driven by no H. iris being found in the outer bay in 2021 (). Large numbers of H. iris were recorded in the eastern outer (E.O.) stratum in 1976. In contrast, nearly all the H. iris recorded in 2021 were found in the inner strata (E.I. and W.I.). Haliotis iris were found in the E.M. stratum but there was an 89% decrease in abundance. The only strata that contained H. iris in 2021 were the strata where small (≤60 mm) H. iris were recorded in the 1970s (i.e. E.I., W.I. and E.M).
Figure 2. Transect location and Haliotis iris count in 1976 (left), and 2021 (right) in Peraki Bay, Banks Peninsula, New Zealand.
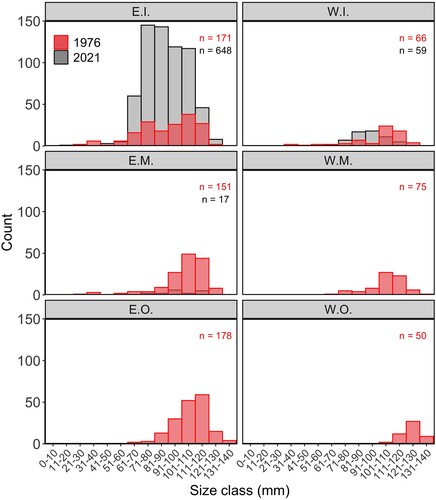
There has been a change in size structure of H. iris since 1976 (; Kolmogorov–Smirnov test: D = 0.40, p < 0.001). The number of individuals greater than 111 mm has decreased by 25% (). However, there has been a 230% increase in H. iris in the size range of 60–100 mm (), resulting in a less skewed size composition than the highly skewed size composition seen in 1976. This change varied among strata (). The W.I. stratum had similar numbers of H. iris observed between studies however, the size structure has changed (Kolmogorov–Smirnov test: D = 0.49, p < 0.001). There has been a large increase in the number of H. iris observed in the E.I. stratum, resulting in a shift in size structure (Kolmogorov–Smirnov test: D = 0.15, p < 0.001). In 1976, the largest H. iris recorded was 140 mm, whereas, in 2021, the largest H. iris recorded was 123 mm. The mean length of H. iris has decreased from 106.2 mm to 89.9 mm.
Figure 3. Size (mm) frequency of Haliotis iris within Peraki Bay, Banks Peninsula, New Zealand, in February 1976 (red, n = 691), and March 2021 (grey, n = 724).
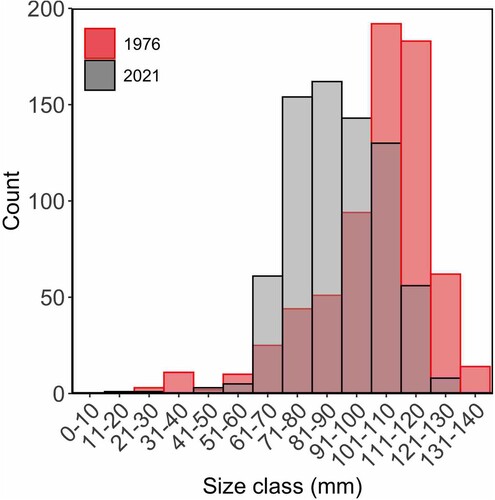
Figure 4. Size (mm) frequency of Haliotis iris in strata of Peraki Bay, Banks Peninsula, New Zealand, in February 1976 (red, n = 691) and March 2021 (grey, n = 724). Sampling strata: W.I., western inner; W.M., western middle; W.O., western outer; E.I., eastern inner; E.M., eastern middle; E.O., eastern outer.
Growth
Although more individuals were tagged in 2019, the successful recapture rate of 3.9% was seven times lower than it was in 1976 for H. iris recaptured after 241 days (24.6%). Growth rates were similar with the 1976 growth rates ranging from 0 to 15 mm per year and the 2021 growth rates ranging from 0 to 12 mm per year (). The Mean annual growth rate was 4.14 ± 0.71 mm in 1976 and 2.40 ± 0.83 mm in 2021, with a weighted mean of 3.33 ± 0.87 mm per year. A similar estimate for and L∞ was recorded for both 1976 and 2021; however, there has been a decrease in K ().
Figure 5. Growth increment (mm) and initial length (mm) of Haliotis iris within Peraki Bay, Banks Peninsula, New Zealand, in February 1976 (red, n = 37) and March 2021 (grey, n = 11).
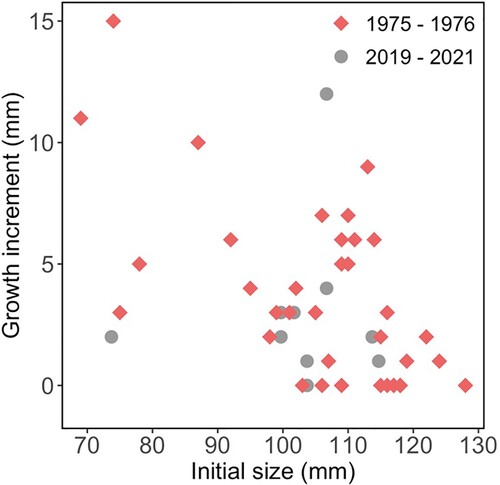
Table 1. The parameters of the von Bertalanffy growth equation, 95% confidence intervals (CI), and supporting information (n and initial shell length at release) for Haliotis iris in Peraki Bay, Banks Peninsula, New Zealand, in 1976 and 2021.
Mortality
Estimates of total annual mortality (Z) differed between methods (). The Ssentongo and Larkin (Citation1973) method resulted in a larger mortality estimate (Z = 0.225) than the Beverton and Holt (Citation1956) method (Z = 0.069). Regardless of method, there has been an increase in total mortality since 1976. An overall estimate of Z is 0.12 ± 0.07, obtained with a weighted mean of the estimates from both methods. The 95% confidence intervals were larger in 2021 than 1976 due to larger confidence intervals for the von Bertalanffy growth parameters.
Table 2. Total mortality rate (Z) ± 95% confidence interval (CI) for adult (> 59 mm) Haliotis iris in Peraki Bay, Banks Peninsula, New Zealand, from 1976 (n = 37) and 2021 (n = 11), using methods from Beverton and Holt (Citation1956) and Ssentongo and Larkin (Citation1973).
Reproduction and recruitment
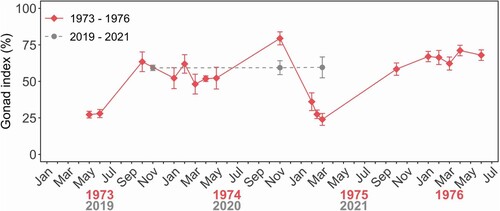
Patterns in reproduction differed between the two studies (). Mean gonad index (GI) showed a mixed annual pattern from 1973 to 1976, with large drops in mean GI indicating spawning at the start of autumn in 1973 and 1975, but no or very little spawning in 1974 and 1976. From 2019 to 2021, however, no pattern was observed, and mean GI stayed consistent at 59%. Although no mass spawning was observed, two individuals had spent gonads suggesting spawning had occurred: one in November 2020 (GI = 40.7%) and one in March 2021 (GI = 32.5%).
Figure 6. Mean gonad index for adult (>100 mm) Haliotis iris in Peraki Bay, Banks Peninsula, New Zealand from 1973 to 1976 (red, n = 7–25), and 2019–2021 (grey, n = 10–15 per sapling event).
Lower fecundity was recorded from 2019 to 2021 than in February 1976 (, , Kruskal–Wallis, x2 = 20.1, df = 3, p < 0.001). However, fecundity did not differ significantly among November 2019, November 2020, and March 2021 (Games-Howell, p < 0.01). The sex ratio of the H. iris dissected was 4:1 (female:male). This was a higher female to male ratio than in 1976 of 2:1.
Figure 7. Fecundity (number of eggs x 106) vs length (mm) of Haliotis iris in Peraki Bay, Banks Peninsula, New Zealand in February 1976 (n = 35), November 2019 (n = 7), November 2020 (n = 9), and March 2021 (n = 11).
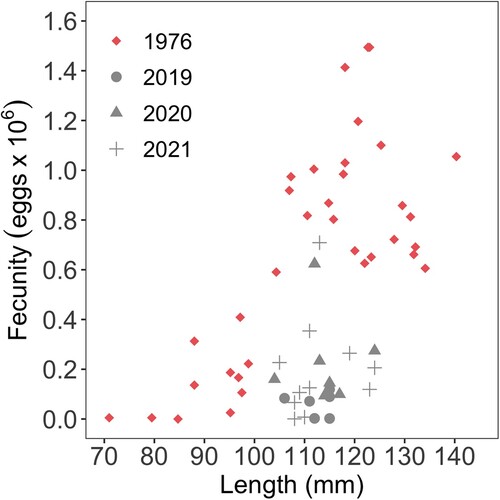
Table 3. Population parameters of Haliotis iris sampled in Peraki Bay in 1976 and 2021. Errors (±) are 95% confidence intervals for population size and juvenile abundance, and standard errors for individual growth rate, mortality, and fecundity. MLS = minimum legal harvestable size.
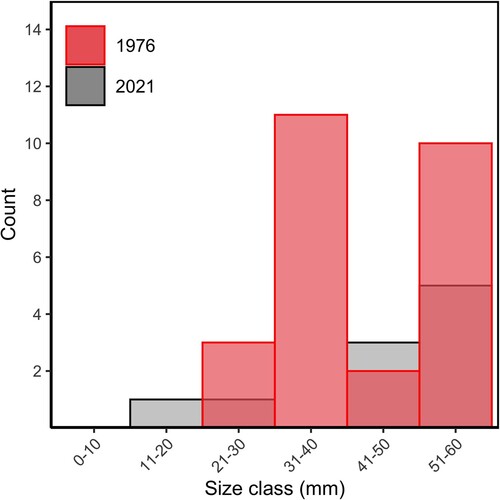
Recruitment of H. iris ≤60 mm was lower in 2021 than in 1976 (Kruskal–Wallis, x2 = 4, df = 1, p = 0.04). The estimated number of recruits in 1976 was 2980 ± 1181 recruits, whereas in 2021 the estimated number of recruits was 220 ± 90 recruits. No H. iris were found in the 31–40 mm size class in 2021 ().
Figure 8. Count of Haliotis iris ≤60 mm in Peraki Bay, Banks Peninsula, New Zealand in 1976 (red, n = 26) and 2021 (grey, n = 10).
Discussion
By re-surveying Peraki Bay 45 years after it was first surveyed, this study found a large change in H. iris population size and structure. However, with only two sampling points over such a long timeframe the scope for firm conclusions is limited. There are also differences between the H. iris population at Peraki Bay and those elsewhere in New Zealand, so there is a need to extrapolate the results from Peraki Bay with care. Compared to many other populations, Peraki Bay H. iris reach a smaller maximum size and show episodic spawning and recruitment. However, as highlighted below, the Peraki Bay population has been influenced by a range of biotic and abiotic factors that affect their population parameters and so species in the high-impact areas of shallow coastal waters may be susceptible to multiple stressors that could decrease population sizes.
This study has shown a large decrease in H. iris population size over 45 years. The H. iris in 2021 were found only in the areas where juvenile H. iris were observed in the 1970s. It is unlikely that the population decline observed is due to disease as there have been no reports of disease causing mortality in the area and H. iris are typically resistant to diseases that cause mass mortalities in other abalone species (e.g. abalone viral ganglioneuritis and Haliotid herpesvirus 1) (Corbeil et al. Citation2017). Instead, this decline in population size may be due to a combination of stressors such as sedimentation, habitat loss, fishing, and low recruitment. Sainsbury (Citation1982a) predicted that the observed annual recruitment was considerably less than what was needed to maintain the observed population. As such, it is possible that the population has declined in numbers and biomass over time due to low recruitment. In 1976, the population was spread throughout the bay. However, in 2021 the population was strongly concentrated in the inner strata with few H. iris found in the outer half of the bay. The outer half of Peraki Bay may have suffered from local recruitment failure, non-local recruitment failure, and/or a lack of adult movement from the shallower inner bay. A combination of all of these may have occurred to cause the large decline observed.
This study supports the conclusions of Sainsbury (Citation1982b) that recruitment in Peraki Bay may consist of episodic recruitment events. Sainsbury (Citation1982b) concluded that prior to his study the population had received several years of good recruitment followed by about 10–15 years of poor recruitment, that the observed recruitment could not maintain the observed population, and that possible increased future recruitment would decrease the extreme skew of the population size composition. The current study shows that the population in the 1970s was unstable, that the population in 2021 was much smaller than in 1976, that recruitment in 2021 was lower than in 1976, and that there was sufficient recruitment prior to 2021 to allow some rebuilding of the intermediate sized H. iris (i.e. 60–100mm) that were rare in 1976. Episodic recruitment is common in long-lived species (Kindsvater et al. Citation2016). Unfavourable environmental conditions may persist for years, causing consistently low recruitment in episodic species (Kindsvater et al. Citation2016). For example, the size structure of an unfished population of abalone was found to be based mainly on two large pulse recruitment events over 18 years (Shepherd Citation1990). Therefore, resilience against prolonged recruitment failure requires adequate densities of adult abalone to be maintained (Shepherd Citation1990). Although this study sampled some juvenile habitat, a more focused juvenile survey would be required to increase confidence in these findings. As broadcast spawners, there is potential for a large local recruitment production in Peraki Bay as the remaining population is highly aggregated, increasing the chance of successful fertilisation occurring (Levitan Citation1995). This population may fluctuate naturally based on large recruitment events, and further study in the future will provide evidence on whether H. iris numbers in Peraki Bay will recover.
It was expected that a spawning event would take place at the end of summer/start of autumn (Poore Citation1973b; Sainsbury Citation1982a). However, no spawning events were observed at Peraki Bay in March 2021. In contrast, widespread spawning was observed in 1973 and 1975, while limited or no spawning occurred in 1974 and 1976 (Sainsbury Citation1982a). Spawning events are difficult to detect without continued sampling, therefore it is likely that the infrequent sampling intervals missed spawning events or that the small sample size was not sufficient to represent the population at each sampling interval. However, the lack of spawning events is consistent with the low number of recruits observed, and low spawning frequency has been observed in other H. iris populations. Non-annual spawning was observed in Kaikōura in 1969 when no spawning was observed but H. iris maintained full gonads (Poore Citation1973a). More recently, in East Otago, the gonad condition of H. iris remained low over the course of a year (Gnanalingam Citation2013). The inconsistent spawning of H. iris in some areas of New Zealand and the unknown causes provide additional challenges for the management of these areas.
An environmental stressor that has affected the H. iris in Peraki Bay is sedimentation, which can decrease larval metamorphosis (Onitsuka et al. Citation2008) and in large quantities result in direct mortality (Sainsbury Citation1982a). A major cause of mortality in H. iris in the 1970s was burial by silt (Sainsbury Citation1982a). In 1975, the sediment level rose vertically by around 1 m after a violent storm, killing hundreds of H. iris (Sainsbury Citation1982a). Even in the absence of storms, in both the 1970s and 2020s, H. iris were found covered in a fine layer of silt on the western side of the bay. The impacts of sedimentation in Peraki Bay may also negate any spawning through reduced larval settlement and increased mortality of larvae and juveniles (Phillips and Shima Citation2006; Chew et al. Citation2013). The boulder strip in the W.M. strata was recorded as up to 110 m wide in the 1970s, whereas in 2021, the boulder strip was only 30 m wide. As such, one reason for the decline in H. iris observed on the western side of the bay could be the loss of habitat from sedimentation.
Fishing can cause unstable population dynamics and magnify natural fluctuations (Anderson et al. Citation2008; Shelton and Mangel Citation2011). In 1976, 8% of the H. iris population was of the minimum legal harvestable size or larger. The distribution of these larger individuals was not uniform throughout the bay. The majority of large H. iris were present in the outer strata (E.O. and W.O.). These outer strata also had very few H. iris under 90 mm. Therefore, the absence of any H. iris in the outer strata in 2021 may be due to a combination of past fishing of larger individuals and few smaller H. iris to replace them through a lack of recruitment. Given the long time frame and limited information on fishing activity in the area, it is difficult to draw definitive conclusions.
In H. iris tag recapture experiments, recapture rates are often low (<10%) (Naylor et al. Citation2006) and this study was no exception (3.9%). Low recapture rates during the 2021 survey (n = 11) limit the comparisons that can be made relative to the 1970s survey. However, this population seems to have had slow growth rates for many years with a weighted mean annual growth rate across both studies of 3.33 mm per year. Further, the largest H. iris measured in 2021 transects was 123 mm indicating the population was still ‘stunted’ (Sainsbury Citation1977). Stunted populations are common in abalone fisheries worldwide and are believed to be caused by resource availability (Emmett and Jamieson Citation1989; Wells and Mulvay Citation1995; Saunders et al. Citation2009). In 2021, Carpophyllum maschalocarpum dominated any algal cover and very few subcanopy species were observed. There has been a decline in algal diversity in Peraki bay as Sainsbury (Citation1977) observed many other species such as Cystophora spp, Glossophora kuntii and Sargassum sinclairii. Fine-scale differences in shell length are common among populations of H. iris (Ryder et al. Citation2023), therefore it is possible that the population in the outer bay had faster individual growth rates than the H. iris in the inner bay. The growth rates from both studies are representative of individuals in the inner half of the bay. A difference in growth rates inside Peraki bay would result in differences among other population dynamics. This hypothesis could be tested if the H. iris population in Peraki Bay expands to the outer strata in the future.
A higher mortality rate was observed in 2021 than 1976 for both methods. However, the recent estimates have large confidence intervals. The likely cause for the slight increase in mortality was the decrease in mean length observed. Natural mortality in abalone is size dependent as a larger thicker shell provides more safety from predators and environmental disturbances (Rossetto et al. Citation2012). As there was a larger number of small individuals in the 2021 survey mortality estimates have increased. The assumptions (a stable population, and constant mortality/recruitment) of the methods were not met, and, as a result, these estimates may be biased. However, these results can still provide useful estimates of mortality for H. iris as the use of methods with varying assumptions have produced similar estimates of mortality (Sainsbury Citation1982a; Rogers-Bennett et al. Citation2007).
The decline in population size of H. iris in Peraki Bay is not unique. While catch has remained stable in some areas (Marsh Citation2019; Fisheries New Zealand Citation2021d), H. iris populations have declined in a number of localised areas around New Zealand (Northland Age Citation2013; Shaskey Citation2019; Gnanalingam et al. Citation2021; Fisheries New Zealand Citation2021b; Fisheries New Zealand Citation2021c). By re-surveying the H. iris in Peraki Bay, the original conclusions made by Sainsbury (Citation1982b) on the population could be tested. These conclusions were: (1) the population in Peraki Bay was unstable; (2) the likely cause of this was variable recruitment; and (3) these findings could be tested by a future re-survey of the population (Sainsbury Citation1982b). The large change in size structure supports that the population is unstable. The decline observed in this study was over a longer timescale than Sainsbury predicted. It is unlikely that a one-off event such as a storm caused the change initially observed (Sainsbury Citation1982b). Over the 45 years, it appears the population has had a long period of low recruitment and has declined. Although the current absolute number of recruits is lower than in 1976, current recruitment relative to the current population size is now higher and the population has rebuilt the central part of its size composition with more recent recruitment events. This variable recruitment is likely affected by additional stressors, and some form of impact on the population had already affected the population in the 1970s (Sainsbury Citation1982b).
Resurveying the H. iris population in Peraki Bay provides a snapshot of change over a long timescale, highlighting the high impacts of anthropogenic and environmental stressors in shallow coastal ecosystems. This study has shown significant changes in an H. iris population over time in the absence of high fishing pressure. The drivers of these changes are unclear, but they include human activities and natural processes. To avoid declines in remaining populations, the uncertainty of H. iris population dynamics should be included in future management of H. iris fisheries and the associated coastal zone.
Supplementary material
Download MS Word (18.3 KB)Acknowledgements
The authors would like to acknowledge the owners of Peraki Station, Dave and Linda Patullo and their family Pauline Patullo and Ryan Hayter for their support of this study and for allowing us access to Peraki Bay via their land even when it resulted in disruptions to their stock. Thank you to Martin Pattison, whose local H. iris diving knowledge was of great help to this study. Divers Lucy Coyle, Maryann Watson, Louise Bennett-Jones assisted greatly with this study. Thanks to the Pāua Industry Council and Philipp Neubauer for providing data on H. iris catch. Funding for this study was provided by a University of Otago Masters/PhD scholarship to F. Ryder and funding from a Ministry of Business, Employment and Innovation Vision Mātauranga Placement Fund contract UOOX1812.
Disclosure statement
No potential conflict of interest was reported by the authors.
Additional information
Funding
References
- Anderson CNK, Hsieh C-h, Sandin SA, Hewitt R, Hollowed A, Beddington J, May RM, Sugihara G. 2008. Why fishing magnifies fluctuations in fish abundance. Nature. 452:835–839. doi:10.1038/nature06851.
- Bennett-Jones L, Gnanalingam G, Flack B, Scott N, Pritchard D, Moller H, Hepburn C. 2021. Translocation of black foot pāua (Haliotis iris) in a customary fishery management area: transformation from top-down management to kaitiakitanga (local guardianship) of a cultural keystone. Pacific Conservation Biology. 27:402–417. doi:10.1071/PC20058.
- Beverton RJ, Holt SJ. 1956. A review of methods for estimating mortality rates in fish populations, with special reference to sources of bias in catch sampling. Rapp Proces-Verb Reun Cons Int Explor Mer. 140:67–83.
- Braje TJ, Bentz L. 2021. Bills of fare, consumer demand, social status, ethnicity, and the collapse of California Abalone. Journal of Ethnobiology. 41:277–291. doi:10.2993/0278-0771-41.2.277.
- Cheung WW, Lam VW, Sarmiento JL, Kearney K, Watson R, Pauly D. 2009. Projecting global marine biodiversity impacts under climate change scenarios. Fish and Fisheries. 10:235–251. doi:10.1111/j.1467-2979.2008.00315.x.
- Chew CA, Hepburn CD, Stephenson W. 2013. Low-level sedimentation modifies behaviour in juvenile Haliotis iris and may affect their vulnerability to predation. Marine Biology. 160:1213–1221. doi:10.1007/s00227-013-2173-0.
- Cochran WG. 1977. Sampling techniques. New York: John Wiley & Sons.
- Corbeil S, McColl KA, Williams LM, Slater J, Crane MSJ. 2017. Innate resistance of New Zealand pāua to abalone viral ganglioneuritis. Journal of Invertebrate Pathology. 146:31–35. doi:10.1016/j.jip.2017.04.005.
- Cox KW. 1962. Fish Bulletin No. 118. California Abalones, Family Haliotidae.
- Duarte CM, Agusti S, Barbier E, Britten GL, Castilla JC, Gattuso J-P, Fulweiler RW, Hughes TP, Knowlton N, Lovelock CE, et al. 2020. Rebuilding marine life. Nature. 580:39–51. doi:10.1038/s41586-020-2146-7.
- Dulvy NK, Sadovy Y, Reynolds JD. 2003. Extinction vulnerability in marine populations. Fish and Fisheries. 4:25–64. doi:10.1046/j.1467-2979.2003.00105.x.
- Emmett B, Jamieson G. 1989. An experimental transplant of northern abalone, Haliotis kamtschatkana, in Barkley Sound, British Columbia. Fishery Bulletin. 87:95–104.
- Fisheries New Zealand. 2007. PAUA (PAU). https://fs.fish.govt.nz/Doc/5550/PAU1Intro_07.pdf.ashx.
- Fisheries New Zealand. 2009. PAUA (PAU 5A) – Fiordland. https://fs.fish.govt.nz/Doc/21762/65_PAU5A_09.pdf.ashx.
- Fisheries New Zealand. 2021a. Black pāua & yellowfoot pāua (PAU). https://fs.fish.govt.nz/Page.aspx?pk = 7&tk = 100&ey = 2021.
- Fisheries New Zealand. 2021b. Pāua (PAU4) – May Plenary Report 2021 Volume 2. https://www.mpi.govt.nz/dmsdocument/49714-Paua-PAU4-May-Plenary-Report-2021-Volume-2.
- Fisheries New Zealand. 2021c. Paua (pau 7) – May Plenary Report 2021 Volume 2. https://www.mpi.govt.nz/dmsdocument/49726/direct.
- Fisheries New Zealand. 2021d. Pāua (PAU) – May Plenary Report 2021 Volume 2. https://fs.fish.govt.nz/Doc/25108/57%20PAUintro%202021.pdf.ashx.
- Gamelon M, Sandercock BK, Sæther BE. 2019. Does harvesting amplify environmentally induced population fluctuations over time in marine and terrestrial species? Journal of Applied Ecology. 56:2186–2194. doi:10.1111/1365-2664.13466.
- Garibaldi A, Turner N. 2004. Cultural keystone species: implications for ecological conservation and restoration. Ecology and Society. 9(3):1.
- Gatz DF, Smith L. 1995. The standard error of a weighted mean concentration – I. bootstrapping vs other methods. Atmospheric Environment. 29:1185–1193. doi:10.1016/1352-2310(94)00210-C.
- Geiger DL, Owen B. 2012. Abalone: world-wide Haliotidae. Hackenheim: ConchBooks.
- Gerrity S, Schiel D. 2023. Recreational fishing effects on wadeable pāua populations along the Kaikōura coast, 2021–22. New Zealand Fisheries Assessment Report: 01.
- Gillies TT. 2014. Reseeding of Haliotis iris in a customary fisheries context. University of Otago.
- Gnanalingam G. 2013. Using science and matauranga to support local management of Blackfoot Pāua (Haliotis iris) in the East Otago Taiapure. University of Otago.
- Gnanalingam G, Pritchard DW, Richards DK, Subritzky P, Flack B, Hepburn CD. 2021. Local management to support local fisheries: Rāhui (temporary closure) and bag limits for blackfoot abalone (Haliotis iris) in southern New Zealand. Aquatic Conservation: Marine and Freshwater Ecosystems. 31:2320–2333. doi:10.1002/aqc.3662.
- Guo X, Huang M, Pu F, You W, Ke C. 2015. Effects of ocean acidification caused by rising CO2 on the early development of three mollusks. Aquatic Biology. 23:147–157. doi:10.3354/ab00615.
- Hahn KO. 1989. Handbook of culture of abalone and other marine gastropods. Boca Raton: CRC Press .
- Halpern BS, Walbridge S, Selkoe KA, Kappel CV, Micheli F, D'Agrosa C, Bruno JF, Casey KS, Ebert C, Fox HE, et al. 2008. A global map of human impact on marine ecosystems. Science. 319:948–952. doi:10.1126/science.1149345.
- Hart AM, Fabris F, Caputi N. 2013. Biology, history, and assessment of Western Australian abalone fisheries.
- Hastings RA, Rutterford LA, Freer JJ, Collins RA, Simpson SD, Genner MJ. 2020. Climate change drives poleward increases and equatorward declines in marine species. Current Biology. 30:1572–1577.e2. doi:10.1016/j.cub.2020.02.043.
- Hobohm C, Schaminée J, van Rooijen N. 2021. Coastal habitats, shallow seas and inland saline steppes: Ecology, distribution, threats and challenges. In: Hobohm C, editor. Perspectives for biodiversity and ecosystems. Cham: Springer International Publishing; p. 279–310.
- Holdsworth JC. 2022. Harvest estimates from land-based amateur fishers – Kaikōura Marine Area to Marfells Beach. New Zealand Fisheries Assessment Report 2022/40: 27 p.
- Jackson JBC, Kirby MX, Berger WH, Bjorndal KA, Botsford LW, Bourque BJ, Bradbury RH, Cooke R, Erlandson J, Estes JA, et al. 2001. Historical overfishing and the recent collapse of coastal ecosystems. Science. 293:629–637. doi:10.1126/science.1059199.
- Karpov K, Haaker P, Taniguchi I, Rogers-Bennett L. 2000. Serial depletion and the collapse of the California abalone (Haliotis spp.) fishery. In: Campbell A, editor. Workshop on rebuilding abalonestocks in British Columbia, Canadian Special Publication of Fisheriesand Aquatic Sciences 130. Ottawa, ON, Canada: Department of Fisheries and Oceans; p. 11–24.
- Kavousi J, Roussel S, Martin S, Gaillard F, Badou A, Di Poi C, Huchette S, Dubois P, Auzoux-Bordenave S. 2022. Combined effects of ocean warming and acidification on the larval stages of the European abalone Haliotis tuberculata. Marine Pollution Bulletin. 175:113131. doi:10.1016/j.marpolbul.2021.113131.
- Kindsvater HK, Mangel M, Reynolds JD, Dulvy NK. 2016. Ten principles from evolutionary ecology essential for effective marine conservation. Ecology and Evolution. 6:2125–2138. doi:10.1002/ece3.2012.
- Lessard J, Campbell A. 2007. Describing northern abalone, Haliotis kamtschatkana, habitat: focusing rebuilding efforts in British Columbia, Canada. Journal of Shellfish Research. 26:677–686. doi:10.2983/0730-8000(2007)26[677:DNAHKH]2.0.CO;2.
- Levitan DR. 1995. Ecology of marine invertebrate larvae. In: McEdward LR, editor. Ecology of marine invertebrate larvae. Boca Raton: CRC Press; p. 123–156.
- Marsh C. 2019. The 2017 stock assessment of pāua (Haliotis iris) for PAU 5B. https://www.mpi.govt.nz/dmsdocument/36225-far-201926-the-2017-stock-assessment-of-paua-haliotis-iris-for-pau-5b.
- McCarthy A, Hepburn C, Scott N, Schweikert K, Turner R, Moller H. 2014. Local people see and care most? Severe depletion of inshore fisheries and its consequences for Māori communities in New Zealand. Aquatic Conservation: Marine and Freshwater Ecosystems. 24:369–390. doi:10.1002/aqc.2378.
- McCauley DJ, Pinsky ML, Palumbi SR, Estes JA, Joyce FH, Warner RR. 2015. Marine defaunation: animal loss in the global ocean. Science. 347:247–254. doi:10.1126/science.1255641.
- McClenachan L, Ferretti F, Baum JK. 2012. From archives to conservation: why historical data are needed to set baselines for marine animals and ecosystems. Conservation Letters. 5:349–359. doi:10.1111/j.1755-263X.2012.00253.x.
- Menzies CR. 2010. Dm sibilhaa'nm da laxyuubm Gitxaała: picking abalone in Gitxaała territory. Human Organization. 69:213–220. doi:10.17730/humo.69.3.g68p1g7k40153010.
- Ministry of Fisheries. 2023. Pāua Canterbury (PAU3). https://fs.fish.govt.nz/Page.aspx?pk = 8&tk = 41&ey = 2023.
- Morash AJ, Alter K. 2016. Effects of environmental and farm stress on abalone physiology: perspectives for abalone aquaculture in the face of global climate change. Reviews in Aquaculture. 8:342–368. doi:10.1111/raq.12097.
- Mullon C, Fréon P, Cury P. 2005. The dynamics of collapse in world fisheries. Fish and Fisheries. 6:111–120. doi:10.1111/j.1467-2979.2005.00181.x.
- Naylor J, Andrew N, Kim S. 2006. Demographic variation in the New Zealand abalone Haliotis iris. Marine and Freshwater Research. 57:215–224. doi:10.1071/MF05150.
- New Zealand Press Association. 2009. Pāua poaching ring smashed. Otago Daily Times.
- New Zealand Press Association. 2010. Pāua poacher loses car, banned for three years. Otago Daily Times.
- Northland Age. 2013. Pāua on the verge of extinction. The Northland Age.
- Onitsuka T, Kawamura T, Ohashi S, Iwanaga S, Horii T, Watanabe Y. 2008. Effects of sediments on larval settlement of abalone Haliotis diversicolor. Journal of Experimental Marine Biology and Ecology. 365:53–58. doi:10.1016/j.jembe.2008.07.042.
- Pāua Industry Council. 2023. Fisheries management tools. https://www.paua.org.nz/fisheries-management-tools.
- Pauly D. 1995. Anecdotes and the shifting baseline syndrome of fisheries. Trends in Ecology & Evolution. 10:430. doi:10.1016/S0169-5347(00)89171-5.
- Pauly D, Christensen V, Guénette S, Pitcher TJ, Sumaila UR, Walters CJ, Watson R, Zeller D. 2002. Towards sustainability in world fisheries. Nature. 418:689–695. doi:10.1038/nature01017.
- Phillips NE, Shima JS. 2006. Differential effects of suspended sediments on larval survival and settlement of New Zealand urchins Evechinus chloroticus and abalone Haliotis iris. Marine Ecology Progress Series. 314:149–158. doi:10.3354/meps314149.
- Pick JL, Nakagawa S, Noble DWA. 2018. Reproducible, flexible and high-throughput data extraction from primary literature: The metaDigitise R package. Ed. by Biorxiv.
- Planque B, Fromentin J-M, Cury P, Drinkwater KF, Jennings S, Perry RI, Kifani S. 2010. How does fishing alter marine populations and ecosystems sensitivity to climate? Journal of Marine Systems. 79:403–417. doi:10.1016/j.jmarsys.2008.12.018.
- Poore GC. 1973a. Ecology of New Zealand abalones, Haliotis species (Mollusca: Gastropoda) 4. Reproduction. New Zealand Journal of Marine and Freshwater Research. 7:67–84. doi:10.1080/00288330.1973.9515456.
- Poore GC. 1973b. Ecology of New Zealand abalones, Haliotis species (Mollusca: Gastropoda). New Zealand Journal of Marine and Freshwater Research. 7:67–84. doi:10.1080/00288330.1973.9515456.
- Raemaekers S, Hauck M, Bürgener M, Mackenzie A, Maharaj G, Plagányi ÉE, Britz PJ. 2011. Review of the causes of the rise of the illegal South African abalone fishery and consequent closure of the rights-based fishery. Ocean & Coastal Management. 54:433–445. doi:10.1016/j.ocecoaman.2011.02.001.
- R Core Team. 2021. R: a language and environment for statistical computing. R.
- Roberts C. 2007. The unnatural history of the sea. Washington: Island Press.
- Roberts RD, Keys EF, Prendeville G, Pilditch CA. 2007. Viability of abalone (Haliotis iris) stock enhancement by release of hatchery-reared seed in Marlborough, New Zealand. Journal of Shellfish Research. 26:697–703. doi:10.2983/0730-8000(2007)26[697:VOAHIS]2.0.CO;2.
- Rogers-Bennett L, Dondanville RF, Moore JD, Vilchis LI. 2010. Response of red abalone reproduction to warm water, starvation, and disease stressors: implications of ocean warming. Journal of Shellfish Research. 29:599–611. doi:10.2983/035.029.0308.
- Rogers-Bennett L, Rogers DW, Schultz SA. 2007. Modeling growth and mortality of red abalone (Haliotis rufescens) in northern California. Journal of Shellfish Research. 26:719–727. doi:10.2983/0730-8000(2007)26[719:MGAMOR]2.0.CO;2.
- Rossetto M, De Leo GA, Bevacqua D, Micheli F. 2012. Allometric scaling of mortality rates with body mass in abalones. Oecologia. 168(4):989–996.
- Ryder FJ, Gnanalingam G, Pritchard DW, Rayment WJ, Scott NJ, Hepburn CD. 2023. Drivers of fishery status for the cultural keystone pāua (Haliotis iris) in Customary fishery Protection Areas in Aotearoa New Zealand. Fisheries Research. 261:106613. doi:10.1016/j.fishres.2023.106613.
- Sainsbury K. 1977. Population dynamics and fishery management of the abalone, Haliotis iris [Doctoral dissertation]. University of Canterbury.
- Sainsbury K. 1980. Effect of individual variability on the von Bertalanffy growth equation. Canadian Journal of Fisheries and Aquatic Sciences. 37:241–247. doi:10.1139/f80-031.
- Sainsbury K. 1982a. Population dynamics and fishery management of the pāua, Haliotis iris I. Population structure, growth, reproduction, and mortality. New Zealand Journal of Marine and Freshwater Research. 16:147–161. doi:10.1080/00288330.1982.9515958.
- Sainsbury K. 1982b. Population dynamics and fishery management of the pāua, Haliotis iris: II. Dynamics and management as examined using a size class population model. New Zealand Journal of Marine and Freshwater Research. 16:163–173. doi:10.1080/00288330.1982.9515959.
- Saunders T, Connell S, Mayfield S. 2009. Differences in abalone growth and morphology between locations with high and low food availability: morphologically fixed or plastic traits? Marine Biology. 156:1255–1263. doi:10.1007/s00227-009-1167-4.
- Seber GAF. 1982. The estimation of animal abundance and related parameters.
- Shaskey T. 2019. Poaching and environmental changes threaten Taranaki pāua stocks. Stuff.
- Shelton AO, Mangel M. 2011. Fluctuations of fish populations and the magnifying effects of fishing. Proceedings of the National Academy of Sciences. 108:7075–7080. doi:10.1073/pnas.1100334108.
- Shepherd S. 1990. Studies on Southern Australian abalone (Genus Haliotis). XII. Long-term recruitment and mortality dynamics of an unfished population. Marine and Freshwater Research. 41:475–492. doi:10.1071/MF9900475.
- Shepherd S, Rodda KR, Vargas KM. 2001. A chronicle of collapse in two abalone stocks with proposals for precautionary management. Journal of Shellfish Research. 20:843–856.
- Sloan N. 2003. Evidence of California-area abalone shell in Haida trade and culture. Canadian Journal of Archaeology/Journal Canadien d'Archéologie. 27(2):273–286.
- Smith ADM, Brown CJ, Bulman CM, Fulton EA, Johnson P, Kaplan IC, Lozano-Montes H, Mackinson S, Marzloff M, Shannon LJ, et al. 2011. Impacts of fishing low–trophic level species on marine ecosystems. Science. 333:1147–1150. doi:10.1126/science.1209395.
- Smith I. 2013. Pre-European Maori exploitation of marine resources in two New Zealand case study areas: species range and temporal change. Journal of the Royal Society of New Zealand. 43:1–37. doi:10.1080/03036758.2011.574709.
- Ssentongo G, Larkin P. 1973. Some simple methods of estimating mortality rates of exploited fish populations. Journal of the Fisheries Research Board of Canada. 30:695–698. doi:10.1139/f73-121.
- Tarr RJ. 2000. The South African abalone (Haliotis midae) fishery. In: Workshop on Rebuilding Abalone Stocks in British Columbia. Nanaimo, British Columbia, Canada: NRC Research Press; p. 32.
- Tegner MJ. 1993. Southern California abalones: can stocks be rebuilt using marine harvest refugia? Canadian Journal of Fisheries and Aquatic Sciences. 50:2010–2018. doi:10.1139/f93-225.
- Wells FE, Mulvay P. 1995. Good and bad fishing areas for Haliotis laevigata: A comparison of population parameters. Marine and Freshwater Research. 46:591–598. doi:10.1071/MF9950591.
- Woolford J. 2019. World abalone fisheries and stock enhancement. Fisheries Research and Development Cooperation. Nuffield Australia Project.
- Zeller D, Froese R, Pauly D. 2005. On losing and recovering fisheries and marine science data. Marine Policy. 29:69–73. doi:10.1016/j.marpol.2004.02.003.