Abstract
The forest limits of south-east Norway have expanded to higher altitudes. Two main processes are believed to cause these changes: regrowth after abandonment of human utilisation and recent climate changes. The article aims at separating the effects of these two processes on the upper forest limits and recent forest expansion. Four datasets representing 161.5 km2 have been used: climate data, downscaled climate change scenario data, forest height growth, and four vegetation maps. The maps represent the years 1959 and 2001, potential natural vegetation (PNV), and a climate change scenario (CCS). The recent upper potential climatic and edaphic forest limit (UPCEFL) was used to define the potential for forest regrowth after the abandonment of human utilisation. Forest height growth and climate data were then used to analyse any supplementary effect of recent climate change. The projected future forest limits were based on the IPCC IS92a scenario for 2020–2049. The results show that raised forest limits and forest range expansion often attributed to recent climate change is rather the product of regrowth, a process that was climatically retarded from 1959 to 1995. For the period 1995–2006, the data indicate a preliminary effect of climate change escalating the regrowth and probably pushing the future forest limits to higher altitudes.
Introduction
The forest limits of the Nordic countries have varied greatly in altitude since the end of the last Ice Age more than 11,000 years ago (Aas & Faarlund Citation1988; Bjune Citation2005). During warmer periods of the Holocene, the forest limit stretched to considerably higher elevations (Kullman & Kjällgren Citation2006). This variation has been linked to natural climatic changes, mainly variations in temperature (Miller et al. Citation2008). Since the cold period referred to as the Little Ice Age, from the 15th to the 19th century, average summer temperatures have generally been rising (Briffa & Osborn Citation2002; Solomon et al. Citation2007). The last period of climatically explained forest limit rise in Norway occurred in the period between 1930 and 1950, approximately concurrent with forest limits advance in other northern regions (Aas Citation1969; Mazepa Citation2005; Danby & Hik Citation2007).
Recent centuries with human release of greenhouse gases and the subsequent temperature augmentation are predicted to cause a further upward expansion of boreal forests in the northern hemisphere (Gautestad et al. Citation2005; Holtmeier & Broll Citation2005; Wielgolaski Citation2005). Most future climate change scenarios of the Nordic region anticipate a warmer summer climate (Benestad Citation2002; Engen-Skaugen Citation2004; Hanssen-Bauer et al. Citation2005). Hanssen-Bauer et al. (Citation2003) downscaled temperature scenarios for Norway and found future tritherm (the three warmest months) warming rates of 0.2–0.3°C per decade.
The causes of global upper forest limits and treeline formations have been much debated, but most scientists agree on the hypothesis of a thermal threshold for forest growth at high elevations and latitudes (Körner & Paulsen Citation2004; Holtmeier & Broll Citation2007; Körner Citation2007; Gehrig-Fasel et al. Citation2008). The upper potential climatic forest limit of Norway, dominated by mountain birch (Betula pubescens ssp. tortuosa) (Lid & Lid Citation2005), has been found to be best correlated with the tritherm, which varies strongly in altitude and geographic range along the Scandinavian mountain chain (Dahl Citation1998; Aas & Faarlund Citation2000). Although temperature is believed to be the most important global forest limit growth factor at these latitudes, several other variables should be accounted for when regional or local forest limits are evaluated, e.g. precipitation, snow cover, spring desiccation, fires, wind, topography, soil conditions, browsing, and human encroachment (Löffler et al. Citation2004; Holtmeier & Broll Citation2005, Citation2007; Karlsson et al. Citation2007; Kullman 2007).
During the most recent decades, the boreal forests of Norway have expanded into sub- and low-alpine areas, resulting in higher local and regional forest limits (Aas & Faarlund Citation1995; Wehberg et al. Citation2005; Wielgolaski Citation2005; Bryn Citation2006). Two main processes are believed to cause these forest limit changes. On the one hand, there is regrowth after abandoned or changed human outfield land-use. The human encroachment has decreased substantially in the valley regions of Norway during the 20th century (Daugstad Citation2000; Bryn & Daugstad Citation2001; Almås et al. Citation2004). Abandonment of felling, mowing and outfield scything, and also the reduction in domestic grazing is believed to explain much of the large-scale expansion of mountain birch, Norway spruce (Picea abies) and Scots pine (Pinus sylvestris) in many subalpine areas of Norway (Aas & Faarlund Citation1995; Wehberg et al. Citation2005; Wielgolaski Citation2005; Bryn Citation2006). The same processes have taken place in the European Alps and other populated mountain regions, although with other tree species (Bowen et al. Citation2007; Tasser et al. Citation2007; Albert et al. Citation2008).
The second main process is recent climate change, often focused on higher temperatures at these latitudes and altitudes. Studies of treeline and forest limit dynamics within the Nordic countries focusing on the effects of climate alone have found contrasting results. Dalen & Hofgaard (Citation2005) found very little evidence for recent mountain birch treeline progress in their study of the Scandinavian mountain chain. Kullman (Citation2006); 2007), on the other hand, found that climate improvement in recent decades has led to an increase in Scots pine populations and the raising of pine forest limits to higher altitudes.
Several authors have pointed out the problem of interpreting forest expansion caused by land-use changes as responses to climate shifts (e.g. Hofgaard Citation1997). Recently, however, a number of studies have attempted to separate the effects of recent climate change from those of regrowth following the abandonment of human encroachment on the upper forest limit expansion in regions of previously extensive human outfield land-use (e.g. Motta et al. Citation2006; Bolli et al. Citation2007; Gehrig-Fasel et al. Citation2007; Albert et al. Citation2008; Gellrich et al. Citation2008; Rutherford et al. Citation2008). The results of these studies are less contrasting, although the emphasis on the driving forces behind the forest expansion of sub- and low-alpine areas varies. Bolli et al. (Citation2007) found that higher summer temperatures since 1990 in the Swiss Alps coincided with increased Norway spruce radial growth and tree establishment, but also that land-use abandonment was important for spruce forest limit advance. Gehrig-Fasel et al. (Citation2007) found that recent climate warming in the Swiss Alps explained far less of the forest expansion than land-use abandonment.
The present article aims to analyse such questions within a valley region of south-east Norway. The overall goal of this study is to investigate the main causes and effects of regional landscape changes in upper forest limits and forest range expansion. Secondly, this study aims to separate the effects of regrowth after abandoned human disturbance from those of recent climate change on forest development.
Study area
Nature
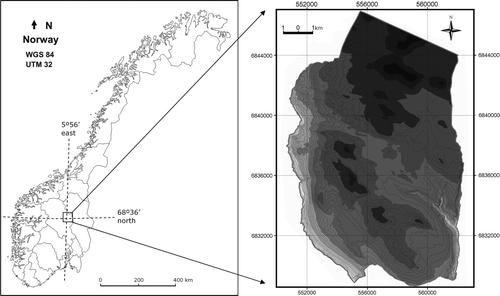
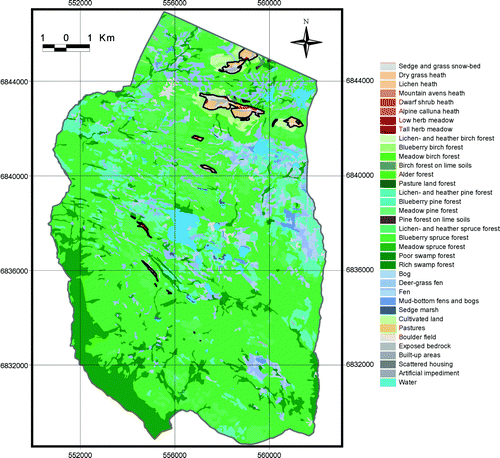
The investigated area comprises a broad valley-mountain profile located in Venabygd, Ringebu municipality, Oppland County, south-east Norway (). A total area of 161.5 km2 was mapped, the lowest part being 330 m a.s.l. and the highest point 1356 m a.s.l. The specific area was chosen because it represents a typical valley-mountain profile of south-east Norway (Puschmann Citation2005), capturing lowland farming areas, intermediate forest areas, subalpine summer dairy farming areas, and high mountains. Also, a meteorological station exists within the study area at an elevation close to the forest limits (940 m a.s.l.) and downscaled climate change scenarios for this location were available.
Fig. 1. Location of the study area in Ringebu Municipality, Oppland County, south-east Norway. Right-hand map: 100 m elevation contour bands from light grey at 330 m a.s.l. to dark grey at 1356 m a.s.l.
Most of Venabygd is situated on sedimentary rocks, mainly feldspar-yielding sandstones (Siedlicka et al. Citation1987). Bioclimatically, Venabygd is in a transition zone between a continental climate and an oceanic climate (Moen Citation1999). Venabygd meteorological station is situated at the centre of the study area (Aune Citation1993). The yearly mean temperature at this location is −0.3°C, the coldest month is January with an average of −9.7°C and the warmest is July with 10.4°C. Yearly average precipitation is moderate: 660 mm in the period 1961–1990. Winter precipitation is low, but the period from June to October has more than 70 mm on average per month.
The climatic gradient from the valley bottom to the mountains is reflected in a change from mid-boreal to mid-alpine vegetation zones (Bryn Citation2006). At the valley bottom a small patch of elm (Ulmus glabra) represents the lower parts of the mid-boreal zone. Higher up, surrounding the farms (500–700 m a.s.l.), birch-dominated forests are scattered with areas of grey alder (Alnus incana). Both are secondary succession forests. In the same region and up to 900 m a.s.l., but more distanced from the farms, Norway spruce forest dominates with patches of Scots pine on dry ground. Forest stands of spruce were found up to 1000 m a.s.l., whereas mountain birch forest stands were found up to 1060 m a.s.l. Low-alpine vegetation existed down to 780 m a.s.l., but the low-alpine climatic zone stretches from c.1000 m a.s.l. up to 1200 m a.s.l. (Moen Citation1999). The low-alpine zone is dominated by dwarf shrub- and lichen heaths, but with intrusions of mountain avens (Dryas octopetala) heath, low herb meadows, tall forb meadows, and snow beds. Higher up, the mid-alpine zone is dominated by dry grass heaths and boulder fields.
Culture
Venabygd is a typical village of the upper mountain valleys in south-east Norway (S⊘mme Citation1954; Puschmann Citation2005). Farmers’ incomes still depend to a relatively large degree on outfield resources, e.g. logging, hunting and outfield grazing. Historically, however, this dependency is at a low level today (Almås et al. Citation2004).
Venabygd was settled during the Late Stone Age, from 4000 BC, but was abandoned after the Black Death in AD 1349. The village was resettled 150–200 years later, and summer dairy farming was re-established early in the 16th century (Sch⊘ning Citation1826 [1775]; Hovdhaugen Citation1988). Throughout the 16th and 17th centuries, the settlements spread to new areas and many farms were divided into smaller units, under the pressure of a rapidly increasing population.
In 1850 there were 45–50 summer dairy farms within the study area, and in 1939 there were 44 (Gjessing Citation1845; S⊘mme Citation1954). Cheese production on the summer dairy farms was extremely demanding in terms of firewood and the need for firewood was always greater than the supply (Reinton Citation1957). In 1974 there were five summer dairy farms and today only one of them remains active.
Several other activities were dependent upon the availability of great amounts of forest, but these activities decreased throughout the 19th and 20th centuries. The local iron, charcoal, tar, and lye production ended early in the 20th century (Kleiven Citation1928). The farmers used large quantities of timber for fences and house construction. Logging, however, is still widespread within the productive spruce forests. The practice of collecting lichens, outfield scything and collecting leaves and twigs for fodder were widespread and lasted until the early 1950s.
Many domestic animals were herded into the mountains. In 1900 there were 5905 goats in Ringebu Municipality, but by 2001 there were none. The number of sheep, however, increased during the 20th century. By 1963 there were 4000 sheep and more than 500 cows. In 2007 there were 6635 sheep and c.200 cows grazing outfields, but today they graze mostly within the alpine areas only partly within the study area.
Methods
Overview
Four datasets were used for this study. Firstly, forest height growth measures of Norway spruce representing the years 1936–2006 (e.g. Gamache & Payette Citation2004) were standardised and measured to interpret climate responses on forest growth alone. Secondly, climate data from the same period and region were put together as respondent variables for the spruce height growth measures. Thirdly, four vegetation maps were constructed to analyse the effect of regrowth after abandoned human land-use compared to those of recent climate improvement on a landscape scale. Actual vegetation maps from 1959 and 2001 were mapped and interpreted through fieldwork and aerial photo interpretation (Bryn 2006; Ihse Citation2007), whereas a potential natural vegetation (PNV) map and a climate change scenario (CCS) map were constructed by a simplified rule-based explorative model (Perry & Millington Citation2008). The difference between the two actual vegetation maps (1959 and 2001) and the PNV map was then used to indicate the effects of regrowth after abandoned land-use (Gehrig-Fasel et al. Citation2007), while the forest height growth and recent climate data were used to analyse the separate effects of recent climate change on forest growth and expansion. Fourthly, a downscaled climate change scenario was included to analyse the future climate effect on the regional forest limits (Koca et al. Citation2006).
Definitions of forest
A tree was defined as a fully grown individual, standing 2.5 m tall. A patch was a group of trees (0.1–1 ha) with a crown density above 25%. A forest was continuous occurrence of trees (>1 ha) with a crown density above 25%. The forest limit was defined in two ways. Firstly, the actual forest limit was the interpolated empiric forest limit seen in nature, determined by edaphic, climatic, topographic, anthropogenic, biotic, and historic factors (e.g. Löffler et al. Citation2004; Holtmeier & Broll Citation2007). Secondly, the upper potential climatic and edaphic forest limit (UPCEFL) was the interpolated theoretical line, given by both climatic and edaphic factors. Both forest limits were drawn through the uppermost forest projections and isolated stands along the contour lines (± 10 m). Forest gaps of mires, boulder fields, bodies of water, and other non-potential forest habitats below c.100 m were tolerated when the two continuous upper forest limits were drawn, but separated patches (< 1 ha) were drawn individually, even at shorter gaps. At larger forest gaps (> 100 m), the continuous upper forest limits were drawn around the non-potential forest habitats. Both forest limits express the continuous upper altitudinal limit for each specific forest type at the specific locations, and they are fully comparable in a map context.
Forest height growth and climate data
The tree sampling was standardised with respect to altitude, aspect, slope, vegetation type, soil type, and tree species in an attempt to single out the effects of recent climate changes. All measured trees were freestanding, growing within dwarf shrub heath, aspect southwards, on 0–7% slope, were healthy individuals with no traces of damage, and growing on moraine soils, at altitudes between 854–891 m a.s.l. Forest height growth was measured in cm from yearly branch-rings on 81 Norway spruce individuals of different ages within a small range of the mapping area (WGS84/UTM32 68°31′N, 5°60′E) in June 2007. The sum of six years height growth and each tree-age was measured from 1.3 m upwards on the stem. The exact growth years were measured from tree rings, and these were then able to be paralleled with local climate measures.
Registered climate data from Venabygd meteorological station did not stretch back as far in time as needed. Hence, data from another mountain meteorological station had to be used, and the most relevant were found at Fokstua (952 m a.s.l.) (WGS84/UTM32 68°87′N, 5°15′E), where they existed from as early as 1923. The data from Fokstua that overlapped in time with data from Venabygd correlated strongly and showed very small discrepancies. The tetratherm (the four warmest months) had a correlation coefficient of 0.992 (p < 0.001) and no yearly temperature differed between the two sites (p > 0.888).
Available explanatory variables tested for forest height growth were: monthly average temperature and precipitation, average temperature and precipitation from the three-, four-, and five warmest months, yearly average of temperature and precipitation, average snow depth, snow depth in May, maximum snow depth, number of days with more than 5 cm snow, and surrounding tree-density. The latter was registered as the tree-layer cover in per cent of a 100 m2 circular plot surrounding each spruce individual.
Initial mapping of actual vegetation in 2001
The actual vegetation map representing the year 2001 was classified by following a survey vegetation map system explored by Bryn (Citation2006). The system has 12 vegetation groups, 45 vegetation types and 9 subordinate land cover types (Appendix 1). In a phytosociological context, the vegetation types mainly operate at the level of classes (Dierschke Citation1994). Additional information was attached to the vegetation types by the use of codes that captured ecological extremes, PNV or specific regional variation (Appendix 2). Vegetation types were outlined on black and white aerial photos at a scale of 1:40,000 using lens stereoscopes in the field. Approximately 90% of the polygons drawn were physically observed during fieldwork (Bryn & Rekdal Citation2001).
Interpreting the vegetation of 1959 as deviations from the 2001 map
Twelve black-and-white air photos from July 1959 (Ser. No. 1044, scale 1:40,000) were rectified to orthophotos with Intergraph OrtoPro Version 10. Around 30 geo-reference points were used for each air photo. The map distortion was between 0 and 8 (10) m.
The vegetation of 1959 was interpreted on orthophoto using FYSAK Version F2.31 in a map scale of 1:10,000. The interpretation was calibrated in advance by three weeks of field work focusing on forest stand age, forest structure, field-layer characteristics and aerial photo (1959) characteristics of vegetation types (colour, structure and form).
The interpretation of the 1959 situation was structured by imposing the digitised outlines of the vegetation map polygons from 2001 onto the orthophotos from 1959, giving important background ecological information to guide the interpretation. This restricted the possible interpretation error and made it less dependent on information given only through aerial photo recognition (see Ihse Citation2007).
Clear interpretation rules were given in advance. For example, if a polygon in 2001 had blueberry birch forest and that same polygon in 1959 lacked a tree-layer, then it was retyped to dwarf shrub heaths in 1959. Such rules were given to all vegetation types (), but more often the polygon outlines also had to be adjusted following the 1959 situation. Farm land, however, was radically changed by humans and could have originated from several vegetation types. Farm land polygons were therefore interpreted individually based on expert knowledge, without the guidance of strict rules (see e.g. Sickel et al. Citation2004).
Table 1. Key to the most frequently used guideline rules for reconstruction of vegetation types in 1959 from the 2001 situation and orthophoto. See Appendix 3 for vegetation type codes andAppendix 2 for additional information codes for the vegetation types. Other abbreviations: F.L.=field layer, B.L.=bush layer, T.=texture.
Identifying the UPCEFL for 1961–1990 (PNV)
The regional and local UPCEFL for 1961–1990 was estimated from six different types of data (). Firstly, the regional UPCEFL was interpolated from hypsogrammetric maps with 100 m elevation contour lines. Secondly, the regional UPCEFL was found by tracking the uppermost localities with forest from eight neighbouring topographic maps at scale 1:50,000 (± 10 m). Thirdly, the local UPCEFL was found through literature and by examining old county maps of different scales (Resvoll-Holmsen Citation1918; Dahl & Mork Citation1959; Aas Citation1969). Fourthly, the local UPCEFL for the mapping area was given by the uppermost altitudinal findings of forest for different species (± 10 m). Fifthly, the local UPCEFL for each tree-forming species was extrapolated from the average tritherm of the normal period between 1961 and 1990 (after Dahl Citation1986 and Aas & Faarlund Citation1988, Citation2000). The tritherm for mountain birch was estimated to 8.6°C, for Norway spruce 9.2°C, and for Scots pine 9.5°C. The tritherm from 1961–1990 at 940 m a.s.l. was 9.63°C, and the summer inland vertical temperature change was set at 0.7°C per 100 m. Finally, the regional UPCEFL for different tree species was adjusted by taking into account altitudinal and climate statistics from different sources (Aas & Faarlund Citation1988; Kjällgren & Kullman Citation2002).
Table 2. The UPCEFL altitude of the three forest types within the region from different sources of information. Abbreviations: p (poor) = lichen- and heather forest, i (intermediate) = blueberry forest, r (rich) = meadow forest.
Based on experience from the region and other researchers’ findings (e.g. Aas & Faarlund Citation2000), the UPCEFL of poor and dry soils was positioned 20 m a.s.l. lower than on intermediate soil types, whereas the UPCEFL of nutrient rich and lush soils was positioned 20 m a.s.l. higher (). The forest limits of the PNV map were also adjusted for effects of aspect and slope. A continuous digital elevation model of the area was made from a point-resolution of 25 m (DTED Version 2). The UPCEFL in slopes above 15° in all north- and east-exposed positions was reduced by 80 m a.s.l. for all forest types following the findings of, for example, Danby & Hik (Citation2007).
Simplified modelling of potential natural vegetation (PNV)
The reconstruction of PNV followed rule-based changes that were given in advance for all vegetation types at all altitudinal levels (Appendix 3). The design of the rules was kept as simple as possible and used in an automatic construction of the PNV map from the 2001 situation, giving an exploratory model as described by Perry & Millington (Citation2008) (see also Smith & Smith Citation2007). If a polygon with mountain vegetation was detected below the altitude of the UPCEFL, then the rules prescribed the most probable forested vegetation type at the site. This depended on the vegetation type of 2001, altitude, edaphic conditions, moisture, aspect, and slope.
The only exceptions from the rule-based modelling were polygons with agriculture. They were interpreted from aerial photos drawing upon expert knowledge as to the most likely PNV types (e.g. Tüxen Citation1956; Moravec Citation1998; Capelo et al. Citation2007).
Climate change scenario map (CCS)
The CCS was based on dynamically downscaled temperatures from the Venabygd and Fokstua meteorological stations. The downscaling was done by the Norwegian Meteorological Institute following the HIRHAM (regional climate model) from the Atmospheric-Ocean General Circulation Model at the Max Planck Institute. The emission scenario was IPCC (Intergovernmental Panel on Climate Change) IS92a run with the ECHAM4/OPYC3 model for the normal period 2020–2049 (Hanssen-Bauer et al. Citation2003; Benestad Citation2004; Engen-Skaugen Citation2004).
The tritherm for a 30-year normal period was used as the climate variable, but forest limits were also adjusted for by edaphic factors, vegetation types, additional information, slope, and aspect in the same way as for the PNV map. The latest tritherm at Venabygd, from 1961–1990, had 9.63°C. The new tritherm downscaled to the period from 2020–2049 showed a rise to 11.02°C. With a summer inland vertical temperature change of 0.7°C per 100 m, this results in a UPCEFL rise of c.200 m. A CCS map was then produced using the same rule-based principles as for the aforementioned PNV map, but with all UPCEFLs 200 m higher (Appendix 3).
Statistics
All statistical tests were run using SPSS (Statistical Package for the Social Sciences) Version 16. The forest growth statistics were tested in several ways. Correlations between climate parameters were tested with Pearson's correlation coefficient. Differences between the mean of groups were tested with ANOVA (analysis of variance test) and Tukey's LSD Post Hoc test or Kruskal-Wallis with subsequent Mann-Whitney U-tests, depending on the distribution and homogeneity of variance (Mackenzie Citation2005). The connection between the dependent variable forest height growth and independent explanatory variables were tested with univariate and multivariate stepwise linear regression analysis, the latter eliminating collinear variables. The statistical significance of the regressions reports the probabilities of an associated T-test or ANOVA test, i.e. whether or not the slope of the regression line deviates significantly from zero.
The continuous forest limit statistics and vegetation group changes were run on a grid-data subset with a point resolution of 100 m, giving 16,140 unbiased and area representative points (Nakagoshi et al. Citation1998). The average altitude of the continuous uppermost forest limits was calculated from points with the ‘nearest’ function (< 20 m) in spatial join (ArcView Version 3.3) and tested for mean altitudinal differences with Mann-Whitney U-tests. The overlay between the four maps was calculated with the ‘assign data by location’ function in spatial join (ArcView).
Results
Forest height growth and explanatory variables
The best predictor of spruce height growth close to the UPCEFL in this inland region was the tetratherm (June–September) (). Within the last eight decades of variability in average temperatures of this region, higher summer temperature predicted higher spruce growth (r2=0.409, p < 0.001, F = 54.735). The second best predictor, after having removed all collinear summer temperature variables, was the summer precipitation of the four warmest months. Within the last eight decades of variability in average precipitation of this region, more summer precipitation predicted less forest growth (r2=0.215, p < 0.001, F = 21.694). Precipitation and temperature was significantly negatively correlated (r = − 0.600, p < 0.001), i.e. higher summer precipitation correlates with lower summer temperature and subsequently with lower spruce height growth in this region. The measured snow variables, winter temperatures and different yearly climate averages did not predict spruce height growth changes. The spring tetratherm from May to August (r2=0.208) had far less explanatory power for height growth than the autumn tetratherm from June to September (r2=0.409).
Fig. 2. Linear regression plot and mean 95% C.I. of temperature sums from six years with average of the four warmest months and forest height growth totals for six years in cm (dependent variable).
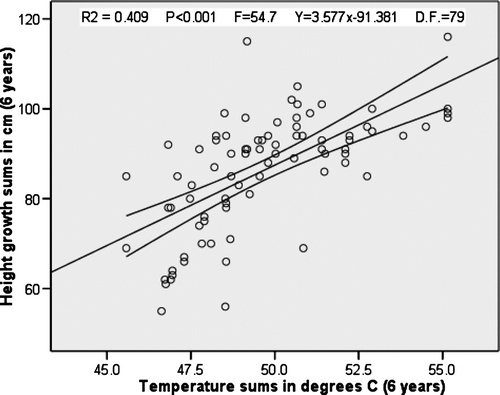
The overall best multivariate linear regression model was achieved with two independent variables, the tetratherm and the surrounding tree-density, with all collinear and non-explanatory variables removed (r2 adj=0.544, p < 0.001, F = 48.730).
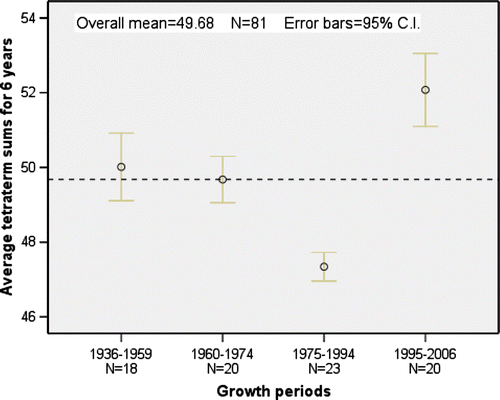
The spruce height growth has varied much during the investigated period. To determine important trends, the measured height growth sums of six years were grouped in time, following natural breaks in the material. The periodical forest growth () indicates that 1936 to 1959 was the measured period with best height growth. The second best period was between 1995 and 2006. The only period of significantly lower forest height growth (p < 0.001) was between 1975 and 1994. The same period had a significantly lower tetratherm (p < 0.001) () and highest precipitation. The last period from 1995 to 2006 had the highest tetratherm, which also increased throughout the period to reach maximum temperatures late in the period.
Fig. 3. Four periods with average forest height growth totals from six years measured in cm on 81 spruce individuals.
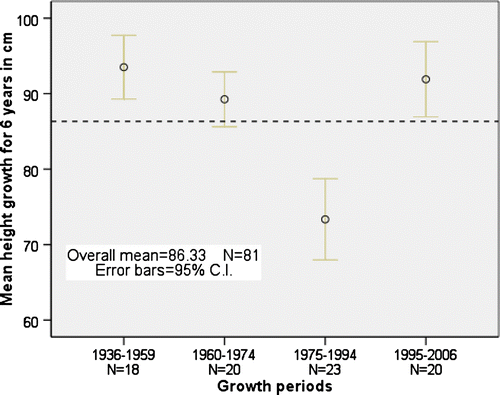
Fig. 4. Four periods with average tetratherm temperature totals for six years measured in °C.
Landscape and vegetation type changes
From 1959 to 2001, more than 27.2 km2 of the study area faced change in vegetation types (16.9%). From 1959 to PNV, 81.3 km2 (51.5%) changed vegetation types and from 2001 to PNV the figure was 77.3 km2 (49%). The vegetation type change from PNV to CCS affected an area of 52 km2 (33%).
The predominant changes from 1959 to 2001 were the loss of alpine heath communities at relatively low altitudes and the gain of deciduous birch forest (Figs. ). The expansion of mountain birch during this period added more than 17.4 km2 of birch forest. The mountain vegetation types in the same period diminished by 17.3 km2. All these alterations occurred well below the UPCEFL. The main changes were transformations from dwarf shrub heath to blueberry birch forest and blueberry spruce forest. Other important changes were transformations from lichen heaths to lichen- and heather birch forests. In addition, pastures were cultivated and regrowth changed pastures to meadow birch forests and dwarf shrub heaths.
Fig. 5. Proportions of vegetation groups as a percentage of total land area (157.8 km2).
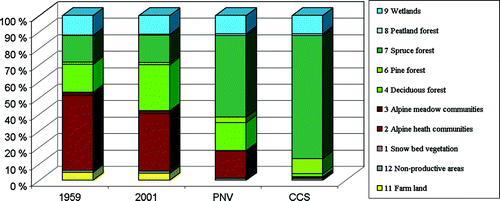
Fig. 6. Vegetation map and the continuous upper forest limits (black line) in 1959. Map projection WGS84/UTM zone 32.
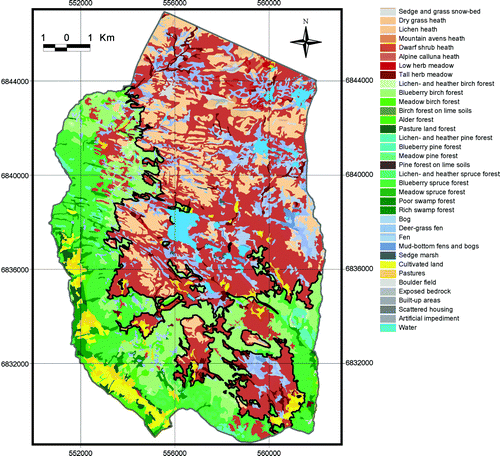
Fig. 7. Vegetation map and the continuous upper forest limits (black line) in 2001. Map projection WGS84/UTM zone 32.
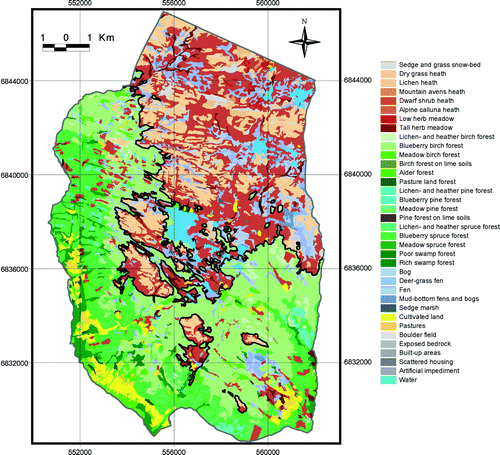
Fig. 8. Vegetation map and the continuous upper forest limits (black line) of PNV. Map projection WGS84/UTM zone 32.
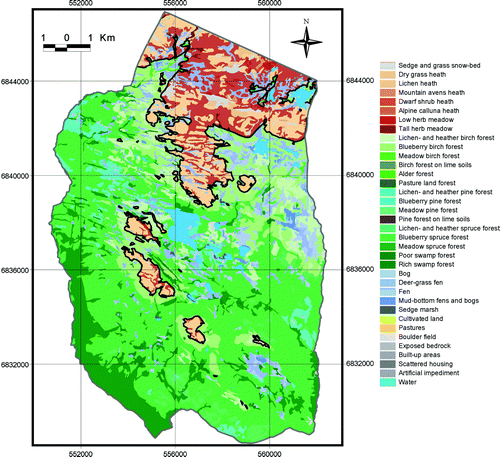
Fig. 9. Vegetation map and the continuous upper forest limits (black line) of CCS. Map projection WGS84/UTM zone 32.
The landscape modifications from 1959 and 2001 to PNV were dominated by the reduction of alpine vegetation types and the advance of spruce forest. Also, the pine forest advanced on dry and poor locations from 1959 and 2001 to PNV and CCS. Spruce forest advance affected 65% of the landscape changes from 1959 to PNV and almost 30% was birch forest advance. Approximately 67% of the landscape changes from 2001 to PNV were spruce forest advance, and almost 28% was birch forest advance.
The landscape changes from PNV to CCS were dominated by the reduction of alpine vegetation and the advance of spruce forest. The birch forest area diminished and all mean forest types’ altitudes were allocated to higher elevations. Pine forest advanced, notably on poor and dry ground from lichen- and heather birch forest. Spruce forest advance affected 77% of the landscape changes from PNV to CCS, whereas 18% was pine forest advance.
Uppermost forest limit changes
The continuous upper forest limits of mountain birch were raised significantly (p < 0.001) with 32 m a.s.l. on average from 1959 to 2001 (). The mountain birch forest clearly expanded the range to higher altitudes, from 911 m a.s.l. to 943 m a.s.l. However, this expansion mostly affected areas far below the potential forest limits of PNV (Mean = 1035 m a.s.l.) (). More than 97% of the forest expansion between 1959 and 2001 occurred below the upper forest limits of PNV, i.e. the UPCEFL of 1961–1990.
Fig. 10. Mean altitude of the continuous upper forest limits for four vegetation maps based on the grid-data subset.
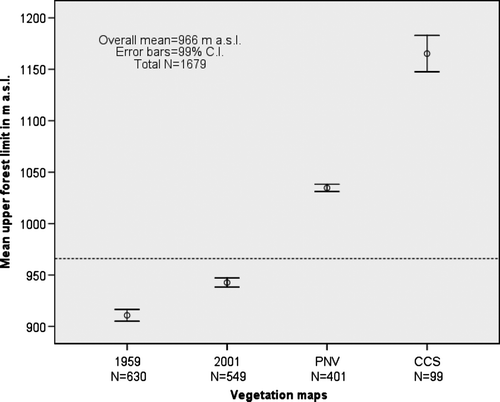
Fig. 11. The continuous upper forest limits distribution in altitude for four vegetation maps based on frequencies of points from the grid-data subset.
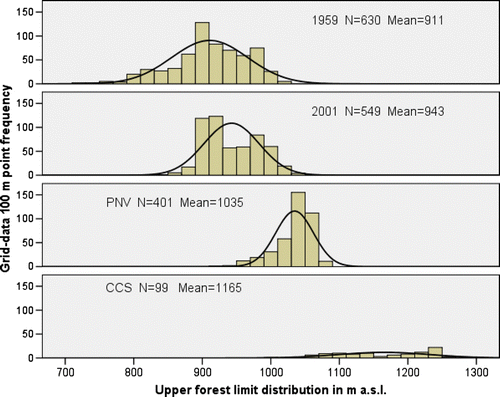
The average continuous upper forest limit depression in 1959 and 2001, i.e. the mean difference between the UPCEFL and the actual upper forest limits, amounted to 124 m a.s.l. and 92 m a.s.l., respectively. The highest continuous forest limit in 1959 stretched to 1020 m a.s.l., whereas the figure in 2001 was 1060 m a.s.l. The lowest continuous forest limit in 1959 was registered at 720 m a.s.l., whereas the figure in 2001 was 840 m a.s.l.
Discussion
Forest growth, climate change and regrowth after human disturbance
The forest range within the study area expanded and the upper forest limits were raised between 1959 and 2001. These changes reflect a common trend of subalpine forest expansion in most mountain regions of southern Norway (Aas & Faarlund Citation1995; Bryn & Daugstad Citation2001; Larsson Citation2004; Wielgolaski Citation2005; Bryn Citation2006). In 1959 and 2001, however, there was still a large gap between the actual and the potential forest range (Figs. ). Thus, the changes from 1959 to 2001 within this forest range gap already had the required climatic and edaphic potential for forest growth (). A recent climate improvement was not needed to explain, nor supported an explanation of, most of these alterations ( and ). The forest expansion was probably mainly driven by regrowth after abandoned human utilisation, filling in the gap between the human-structured actual forest and the potential natural forest range. Had it not been for centuries of forest felling, mowing, outfield scything, and domestic grazing, the forest would probably have existed there before 1959 ().
The regrowth of forest following abandoned agricultural activities is a process that will take place whether there is a climate change or not, as long as it appears below the fluctuating potential climatic forest limit and is not constrained by other ecological processes (Bryn Citation2006; Gehrig-Fasel et al. Citation2007; Gellrich et al. Citation2008). Climatic change can alter the extent, speed and direction of regrowth (e.g. Franke & Köstner Citation2007), but as long as the human encroachment remains insignificant compared to the historical utilisation, the regrowth will continue below the UPCEFL.
In Norway, such forest clearings have mainly been explained by farming activities, summer dairy farming or reindeer grazing (Fjellstad & Dramstad Citation1999; Bryn & Daugstad Citation2001; Löffler et al. Citation2004; Bjune Citation2005; Thannheiser et al. Citation2005). In this respect, the chosen study area seems to be representative of the valleys and mountain villages, the mountain forests, and the low-alpine mountains of Norway (Puschmann Citation2005). Similar findings from the Swiss Alps document the importance of land abandonment for recent forest expansion in areas near the forest limits (Motta et al. Citation2006; Gehrig-Fasel et al. Citation2007; Tasser et al. Citation2007; Albert et al. Citation2008; Gellrich et al. Citation2008).
However, regrowth after abandoned human utilisation and climate change are concurrent processes and a temperature rise would probably have accelerated the regrowth rate from 1959 to 2001 and contributed to higher forest limits (Theurillat & Guisan Citation2001; Solberg et al. Citation2002; Karlsson et al. Citation2005). The findings of this study, however, elucidate the dominance of regrowth after abandoned outfield farming activities as the driving mechanism behind forest expansion and forest limit changes. Both the recent forest height growth and the temperature development point to lower climatic forest growth potential in the period from 1959 to 1995 ( and ). Thus, the speed of forest regrowth was actually climatically lowered during most of that period, at least for Norway spruce.
The UPCEFL is a dynamic line, responding and fluctuating with the climatic changes and soil conditions. The small (<3%) and very recent forest expansion above the UPCEFL of 1961–1990, the forest height growth and the temperature development after 1995 could indicate a preliminary effect of recent summer warming. Such effects and similar apportionment have recently been documented from the Swiss Alps in studies were the effect of forest regeneration was separated from recent climate-driven forest expansion (Bolli et al. Citation2007; Gehrig-Fasel et al. Citation2007). The three findings of the present study point to increased future forest growth and higher actual and UPCEFL. Such findings are also supported in other parts of the Nordic region, but many of these studies have not clearly separated the effect of regrowth after human disturbance from that of recent climate change (Kullmann Citation2000; Kaplan et al. Citation2003, Dalen & Hofgaard Citation2005; Wielgolaski Citation2005; Kullman & Kjällgren Citation2006). This separation is crucial in order to understand and single out the effects of present and future climate change on the uppermost forest limits.
The small and very recent uppermost forest advance, however, does not correspond with climate data ( and ). There is an obvious time lag between climate change and forest advance (Holtmeier & Broll Citation2005, Citation2007; Voldoire et al. Citation2007). The average tritherm has increased by 0.52°C from 1975–1994 to 1995–2006. This implies a possible potential forest altitude advance of 74 m a.s.l. Kullmann (Citation2001) postulated a local climatic tree-limit time lag of up to 30 years in Sweden, which indicates the difference between forest in situ height growth and forest expansion. Forest in situ height growth seems to respond quickly to climate changes, whereas forest expansion, including dispersal and seedling establishment, is much more dependent on optimum climatic conditions and human land-use () (Mork Citation1960; Dullinger et al. Citation2004; Dalen & Hofgaard Citation2005; Kullmann Citation2007). This is probably strengthened at the upper forest limits, close to the species’ existence limit (Hofgaard Citation1997; Danby & Hik Citation2007).
The biophysical cultural landscape and natural dynamics
The differences between PNV and the vegetation maps from 1959 and 2001 reflect the extent of a biophysical cultural landscape (Chytrý Citation1998). In this context, the cultural landscape is areas with vegetation types changed by human activity from their potential natural types. The outfield cultural landscape of Norway is probably largely underestimated (Emanuelsson Citation1987; Christensen Citation1989; Lundberg Citation2002; Bryn Citation2006), and undisturbed ecosystems ‘can hardly be found in northern Europe’ (Hofgaard Citation1997, 427). In the present study, more than 81.3 km2 (51.5%) of the 1959 landscape could be interpreted as a biophysical cultural landscape, whereas the number for 2001 was 77.3 km2 (49%). These areas correspond highly with the locations of farms and summer dairy farms (Olsson et al. Citation2000).
Alongside regrowth after human abandonment, natural ecological dynamics may introduce a wide range of continuous landscape changes, including a natural post-fire succession, post-caterpillar outbreak succession, snow-induced dynamics, extreme weather effects, and wild animal grazing. Such dynamics may explain small parts of the landscape changes, but probably no more than a few per cent. Most natural occurring disturbance factors do not change the vegetation type. Geometrid moth outbreaks may well create a thin tree-layer (Neuvonen et al. Citation2005), but they do not change birch forest to pine forest. The interpreted changes in this study are expressed as vegetation type replacements. In the survey mapping system used, such dynamics are primarily created by human encroachment (including domestic grazing) or climate change. Thus, within the error of a few per cent, most forest changes registered below the UPCEFL should be attributed to regrowth after human disturbance, when climate changes are accounted for. Most other important forest-structuring factors have been more or less stable since the early 1950s, e.g. wind, snow cover and wild animal grazing (temperature and precipitation are discussed elsewhere in this paper). A geometrid moth outbreak ‘rarely causes noticeable defoliation at more southern latitudes’ in Norway (Neuvonen et al. Citation2005, 126) and forest fires have not been reported in the study area from the 20th century. The only notably exception was a slightly reduced nitrogen downfall (Strand et al. Citation2005) and an increased elk population (Solberg et al. Citation2006). Both factors can constrain the speed of forest regeneration, but cannot change its prevailing direction.
Timetables, models and their realism
The PNV and CCS maps will probably never be fully realised. The models were presented to determine the vegetation change potentials after human utilisation from those of present and future climate change potentials ( and ). However, future politics may change the preconditions for the vegetation development presented in this study. Policy decisions may increase the existing utilisation or reintroduce parts of the historic outfield encroachment (Soliva et al. Citation2008). Present and future policy decisions may also change the future expectations of climate warming (Metz & Davidson Citation2007). Also, the future climate change scenarios and models are expected to improve in the coming years, and will probably give other projections of future climate (Solomon et al. Citation2007). In addition, the response time of forest limits and forest range expansions to climatic change varies between different climatic regions and tree species (Holtmeier & Broll Citation2005; Danby & Hik Citation2007). As seen in this study (Figs. ), mountain birch has much higher capacity for rapid forest recruitment and expansion in this region, than Norway spruce and Scots pine. By 2020–2049, the projected time for the climate changes in the CCS map, the mountain birch may have expanded into higher elevations, whereas Norway spruce and Scots pine will probably exist at lower and intermediate elevations. Hence, the PNV and CCS maps have no timetable for establishment and their exact vegetation patterns will probably never be reached. Nonetheless, they shed light on the distinction between the effects of human utilisation and future climate changes. For example, if the CCS or a comparable scenario becomes a reality, the future extensiveness of mountains will be largely reduced. In this study, vegetation type transitions covered more than 52 km2 (33%) from PNV to CCS. Still, regrowth after abandoned human utilisation will cause larger reductions in mountain vegetation than the climate change scenario used in this study (49–52%). This pinpoints the importance of human disturbance, outfield cultural landscapes and regrowth in the Norwegian mountain regions (Bryn & Daugstad Citation2001; Löffler et al. Citation2004; Karlsson et al. Citation2007; Potthoff Citation2007).
Vegetation map uncertainties and underestimation of vegetation changes
The interpretation of actual vegetation from 1959 involves uncertainties related to the recognition of vegetation types from aerial photos (Green & Hartley Citation2000; Sandmann & Lertzman Citation2003; Ihse Citation2007). The interpretation, however, was guided by the actual vegetation map from 2001, giving important information on the ecology at different sites and the present vegetation. Furthermore, the interpretation followed clear rules that restricted possible interpretation error (). Also, the mapping system used is a survey system with few vegetation types following the main ecological gradients (Bryn Citation2006). Most interpreted changes were forest changes, i.e. the separation of non-forested areas from those with forest. The high quality aerial photo from 1959, gave very clear forest patterns for interpretation.
Thus, the between vegetation-type changes from 1959 to 2001 have therefore probably been well interpreted and documented, because they are dominated by forest expansion. The within vegetation-type changes, however, are probably inadequately documented. The mapping system does not capture small-scale changes and only a few field-layer characteristics outside those defined within the vegetation types are included (Appendix 2). Many potential small-scale changes and specific field- and bottom-layer characteristics that have not been registered in the presented vegetation maps are known to occur in changing summer dairy farm landscapes, e.g. a reduction in plant species diversity (Olsson et al. Citation2000; Bryn et al. Citation2001; Vandvik & Birks Citation2004; Potthoff Citation2007). This and related topics point to a probable underestimation of the extent of the biophysical cultural landscape. If a more detailed mapping system could have been used in combination with infrared aerial photos, additional changes could probably have been registered (Wyatt Citation2000; Sickel et al. Citation2004; Ihse Citation2007).
Several problems are known to arise in the process of reconstructing altered vegetation in cultural landscapes (Moravec Citation1998; Zerbe Citation1998; Neuhäuslová et al. Citation2001). In the present study, however, the cultural landscape is dominated by semi-natural vegetation types, i.e. types that are characterised by plant species which regenerate naturally after abandonment (Bryn & Daugstad Citation2001; Pykälä Citation2005). The PNV is thus close to the actual vegetation, reducing the problem of reconstructing vegetation types. Also, as mentioned by Chytrý (Citation1998) and Ricotta et al. (Citation2002), large-scale studies above a map scale of 1:25,000 avoid the problems of drawing too many exact boundaries. Furthermore, few and ecologically relatively wide vegetation types also simplify the reconstruction of PNV (Bryn Citation2006).
The interpretation uncertainty is probably mostly connected to the farmland vegetation types that had been more radically changed by human activity (Moravec Citation1998). They were interpreted manually by expert opinion, thus introducing the problem of replication and subjective mapping (Capelo et al. Citation2007). This subjective reconstruction of vegetation types, however, affected less than 4.8% of the 1959 map and less than 4.2% of the PNV map. The rest, above 95% for both map types, was reconstructed following the prescribed rules given in and Appendix 3, i.e. they can easily be replicated.
Climate projection uncertainties and climate simplifications
The chosen greenhouse gas emission scenario, the underlying climate model, the resulting climate projection, vegetation to climate feedback mechanisms and the regional downscaling, involves several assumptions and uncertainties (Betts & Shugart Citation2005; Raper & Giorgi Citation2005; Solomon et al. Citation2007).
The climate change scenarios used by the IPCC (2001) for the period until 2100 vary in temperature between 1.7°C and 4.2°C, indicating uncertain projections of future temperature. To avoid exaggerations of future forest limit movements, a shorter projection period was implemented (until 2049) and the most conservative climate model was chosen (IPCC Citation2001; Benestad Citation2002, Citation2004). Also, the chosen scenario was regionally downscaled. This was essential, since the tritherm and the potential forest limits vary regionally, and because the temperatures depend on the regional topography (Hugget & Cheesman Citation2002; Hanssen-Bauer et al. Citation2005).
The use of summer temperature as the most important climatic forest limit variable, involves both simplifications and assumptions. Most researchers, however, agree that the uppermost potential climatic forest limit is mainly regulated by summer temperatures (Brockmann-Jerosch Citation1919; Daubenmire Citation1954; Mork Citation1968; Walter Citation1968; Fang & Li Citation2002; Holtmeier Citation2003; Körner & Paulsen Citation2004; Wielgolaski Citation2005; Danby & Hik Citation2007). The best predictor of the upper potential climatic forest limit of mountain birch in Norway was found to be the tritherm, whereas Norway spruce and Scots pine also correlate strongly with the tetratherm (Dahl Citation1986, Citation1998; Aas & Faarlund Citation1988, Citation2000). The use of other temperature measures instead of the tritherm, e.g. the maximum summer temperature or the root-zone temperature, may have parallel-displaced the chosen UPCEFL by some altitudinal metres or created more small-scale local differences (Körner & Paulsen Citation2004) but they probably would not have changed the general findings of this study. These findings are in accordance with results from similar studies in the Swiss Alps, where other measures of the UPCEFL have been implemented (Gehrig-Fasel et al. Citation2007). The forest height growth data from this study also clearly point to the outmost importance of summer temperature as the dominant forest growth limiting factor in this region.
The best multivariate predictor of forest height growth, which included the surrounding tree-density, probably also points to the importance of local climate to vegetation feedback mechanisms for forest height growth (Holtmeier & Broll Citation2007). Below the UPCEFL, higher surrounding forest density slightly increased the in situ forest height growth. Following the findings of Vajda & Venäläinen (Citation2005), this is anticipated to be caused by a sheltering effect from cold winds and wind-transported ice crystals. Thus, forest regrowth below the UPCEFL may improve the local climate growth conditions and subsequently the rate of forest expansion in deforested areas (Bolli et al. Citation2007), whereas it may lower the root-zone temperature at the UPCEFL and hence retard the forest expansion at higher elevations (Körner & Paulsen Citation2004).
Future temperatures are expected to rise more in the winter season than in the summer season (Hanssen-Bauer et al. Citation2005). The winter season, however, is not a period of plant growth, and the tree species in the study area ‘have passed the selection filter’ (Körner & Paulsen Citation2004, 714) and are adapted to cold and variable winters (e.g. Sakai & Larcher Citation1987). Also, while the effects of winter warming on tree-forming species are more uncertain than the effects of summer temperatures (Skre Citation2001), Kullmann (2000) noted a mountain birch dieback related to a combination of higher mean winter and summer temperatures. Spring temperatures are also expected to rise, but in this study spring temperature had far less explanatory power in terms of forest height growth than the autumn temperature. This could indicate that autumn changes are more important for forest growth than spring temperatures at these altitudes, at least for evergreen coniferous trees that can respond to longer growing seasons. However, this may also be related to soil frost (spring desiccation) and snow cover, both of which are factors that may delay spring tree growth at forest limit elevations (Kullman 2007).
Future projections of precipitation, snow and wind are more uncertain than the predictions of a warmer climate (Benestad Citation2002; Hanssen-Bauer et al. Citation2005; Raper & Giorgi Citation2005; Solomon et al. Citation2007). None of the tested snow variables in this study explained any forest height growth changes for Norway spruce. The in situ forest height growth of Norway spruce does not seem to be regulated by yearly changes in the snow cover in this region (Mork Citation1968), whereas between-site snow cover differences probably will affect between-site differences in forest height growth. This was found to be the case in Canada by Gamache & Payette (Citation2004), where increased snow cover seemed to have depressed the height growth of black spruce (Picea mariana) at the forest margins, indicating the importance of future snow cover changes on the upper forest limits (Dalen & Hofgaard Citation2005). Mountain birch seems generally more dependent on air and soil humidity than do Norway spruce and Scots pine (Wielgolaski Citation2005). Sufficient soil moisture is a precondition for germination of mountain birch, and more precipitation could therefore increase seed propagation at the forest limits in continental regions of Scandinavia (Thannheiser et al. Citation2005). Topographically wind-exposed areas will probably experience reduced forest range expansion rates and lower upper forest limits (Gamache & Payette Citation2005), due to wind damage and snow drift.
Assuming soil conditions are sufficient, as shown for Norway spruce in this study, there should be sufficient precipitation for the dominant tree-forming species at these altitudes (Tengwall Citation1918; Mork Citation1960; Aas & Faarlund Citation1988; Körner & Paulsen Citation2004; Autio Citation2006). However, an increase in future precipitation would probably slow down the forest growth and could potentially reverse a future uppermost forest limit expansion, at least for Norway spruce. The geographic extent of mountain birch as a forest limit species, adjacent to high-latitude ice-free oceans, points to the competitive advantages of mountain birch compared with Norway spruce and Scots pine in regions with a high degree of oceanity (Ahti & Hämet-Athi Citation1969). The mountain birch could therefore potentially benefit from increased future precipitation, assuming stable or increasing summer temperatures.
The edaphic component, however, will probably slow down the future forest range expansion. As shown in , the upper forest limit of CCS is expected to become more spread in altitude than for the PNV situation. This correlates with increasing amount of bare rocks and boulder fields at higher elevations in the study area. These soils do not have the preconditions for forest establishment today, e.g. soil moisture and soil nutrients (Mork Citation1960; Timoney Citation1995; Barber et al. Citation2000). Thus, in the time lag of soil formation, future forest range expansion rates may be constrained (Holtmeier Citation2003; Holtmeier & Broll Citation2007). The altitudinal spread of the upper continuous forest limit in CCS also correlates with ste eper topography, giving lower forest limits on north- and east-exposed aspects, as found by Danby & Hik (Citation2007).
Conclusions
The uppermost forest limit expanded 32 m upwards and large areas were forested with mountain birch between 1959 and 2001. The forest expansion upwards was most probably driven by regrowth after abandoned outfield farming practises. Four different datasets indicate the importance of such regrowth. Firstly, the historical outfield farming utilisation decreased considerably throughout the 20th century. Secondly, more than 97% of the forest expansion between 1959 and 2001 appeared far below the UPCEFL of different tree-forming species from 1961–1990. Thirdly, the forest height growth from 1959 to 1995 was lowered, but increased from 1995 and onward. Fourthly, the summer temperatures were lowered during the same period, but also increased from 1995 to 2006. None of the datasets indicated that the expanding forest between 1959 and 1995 was driven by a climatic improvement, but local vegetation to climate feedback mechanisms may have increased the height growth slightly. After 1995, both summer temperatures and forest height growth indicate increased rates of regrowth and point to possible future elevated forest limits.
A PNV model show that c.52% of the 1959 landscape and c.49% of the 2001 landscape could be interpreted as cultural landscapes, dominated by semi-natural vegetation. The potential for future forest regrowth is very high; more than 13% of the landscape below the UPCEFL has ongoing forest expansion. In addition, large areas at higher altitudes may be forested in the future if the expected CCS of the IPCC (2001) becomes a reality. To date, only insignificant areas above the UPCEFL of 1961–1990 have been forested, possibly indicating a starting effect of climate change.
Acknowledgements
I wish to thank B⊘rre Aas, Michael Angeloff, Anna S. Berg, Odd Braaten, Margareta Ihse, Ketil Isaksen, Anders Lundberg, Geir-Harald Strand, Hanne Gro Wallin, and the reviewers for valuable comments and/or technical assistance.
Related Research Data
References
- Aas , B. 1969 . Climatically raised birch lines in southeastern Norway 1918-1968 . Norwegian Journal of Geography , 23 ( 3 ) : 119 – 130 .
- Aas , B. and Faarlund , T. 1988 . Postglacial forest limits in central south Norwegian mountains. Radiocarbon dating of subfossil pine and birch specimens . Norwegian Journal of Geography , 42 ( 1 ) : 25 – 61 .
- Aas , B. and Faarlund , T. 1995 . Forest limit development in Norway, with special regard to the 20th century . AmS-Varia , 24 : 89 – 100 .
- Aas , B. and Faarlund , T. 2000 . Forest limits and the subalpine birch belt in north Europe with a focus on Norway . AmS-Varia , 37 : 103 – 147 .
- Abrahamsen , J. Dahl , E. Jacobsen , N.K. Kalliola , R. Påhlsson , L. & Wilborg , L. 1977 . Naturgeografisk Regioninndeling av Norden . Nordiska utredningar 34. Nordiska ministerrådet, K⊘benhavn .
- Ahti , T. and Hämet-Athi , L. 1969 . The homologies of the Fennoscandian mountain and coastal birch forest in Eurasia and North America . Vegetatio , 19 : 208 – 219 .
- Albert , C.H. , Thuiller , W. , Lavorel , S. , Davies , I.D. and Garbolino , E. 2008 . Land-use change and subalpine tree dynamics: Colonization of Larix decidua in French subalpine grasslands . Journal of Applied Ecology , 45 : 659 – 669 .
- Almås , R. , Gjerdåker , B. , Lunden , K. , Myhre , B. and Øye , I. 2004 . Norwegian Agricultural History , Trondheim : Tapir Academic Press .
- Aune , B. 1993 . Temperaturnormaler, Normalperioden 1961–1990 . DNMI Report 2, 1–66. Det Norske Meteorologiske Institutt, Oslo .
- Autio , J. 2006 . Environmental Factors Controlling the Position of the Actual Timberline and Treeline on the Fells of Finnish Lappland . OULU Report A452, 1–61. University of Oulu, Oulo .
- Barber , V.A. , Juday , G.P. and Finney , B.P. 2000 . Reduced growth of Alaskan white spruce in the twentieth century from temperate-induced drought stress . Nature , 405 : 668 – 672 .
- Benestad , R. 2002 . Empirically downscaled multi-model ensemble temperature and precipitation scenarios for Norway . Journal of Climate , 15 ( 21 ) : 3008 – 3027 .
- Benestad , R. 2004 . Tentative probabilistic temperature scenarios for northern Europe . Tellus , 56A : 89 – 101 .
- Betts , R.A. & Shugart , H.H. 2005 . Dynamic ecosystem and earth system models . Lovejoy , T.E. & Hannah , L. Climate Change and Biodiversity , 232 – 251 . Yale University Press , New Haven .
- Bjune , A.E. 2005 . Holocene vegetation history and tree-line changes on a north-south transect crossing major climate gradients in southern Norway – evidence from pollen and plant macrofossils in lake sediments . Review of Palaeobotany and Palynology , 133 : 249 – 275 .
- Bolli , J.C. , Rigling , A. and Bugmann , H. 2007 . The influence of changes in climate and land-use on regeneration dynamics of Norway spruce at the treeline in the Swiss Alps . Silva Fennica , 41 ( 1 ) : 55 – 70 .
- Bowen , M.E. , McAlpine , C.A. , House , A.P.N. and Smith , G.C. 2007 . Regrowth forest on abandoned agricultural land: A review of their habitat values for recovering forest fauna . Biological Conservation , 140 : 273 – 296 .
- Briffa , K.R. and Osborn , T.J. 2002 . Blowing hot and cold . Science , 295 ( 5563 ) : 2227 – 2228 .
- Brockmann-Jerosch , H. 1919 . Baumgrenze und Klimacharacter . Beiträge zur Geobotanischen Landesaufnahme der Schweiz 6. Rascher & Cie, Zürich .
- Bryn , A. 2006 . A scenario for vegetation changes in a Norwegian mountain district: The combined effect of regrowth and climate change . Geographia Polonica , 79 : 41 – 64 .
- Bryn , A. & Daugstad , K. 2001 . Summer farming in the subalpine birch forest . Wielgolaski , F.E. Nordic Mountain Birch Ecosystem , 307 – 315 . UNESCO Man and Biosphere Series 27. Parthenon Publishing Group, New York .
- Bryn , A. , Norderhaug , A. and Daugstad , K. 2001 . Re-growth effects on vascular plant richness in Norwegian, abandoned summer farm areas . SkogræktaritiÐ , 1 : 163 – 166 .
- Bryn , A. & Rekdal , Y. 2001 . Vegetasjon og beite i Venabygdsfjellet . NIJOS Rapport 8, 1–68. Norsk institutt for jord- og skogkartlegging, Ås .
- Capelo , J. , Mesquita , S. , Costa , J.C. , Ribeiro , S. , Arsenio , P. , Neto , C. , Monteiro-Henriques , T. , Aguiar , C. , Honrado , J. , Espirito-Santo , D. and Lousa , M. 2007 . A methodological approach to potential vegetation modelling using GIS techniques and phytosociological expert-knowledge: Application to mainland Portugal . Phytocoenologia , 37 ( 3–4 ) : 399 – 415 .
- Christensen , N.L. 1989 . Landscape history and ecological change . Journal of Forest History , 33 ( 3 ) : 116 – 125 .
- Chytrý , M. 1998 . Potential replacement vegetation: An approach to vegetation mapping of cultural landscapes . Applied Vegetation Science , 1 ( 2 ) : 177 – 188 .
- Dahl , E. 1986 . Zonation in arctic and alpine tundra and fellfield ecobiomes . Polunin , N. Ecosystem Theory and Application , 35 – 62 . John Wiley , New York .
- Dahl , E. 1998 . The Phytogeography of Northern Europe , Cambridge : Cambridge University Press .
- Dahl , E. and Mork , E. 1959 . Om sambandet mellom temperatur, ånding og vekst hos gran (Picea abies (L.) Karst.) . Meddelelser fra det Norske Skogfors⊘ksvesen , 16 : 81 – 93 .
- Dalen , L. and Hofgaard , A. 2005 . Differential regional tree line dynamics in the Scandes mountains. Arctic . Antarctic and Alpine Research , 37 ( 3 ) : 284 – 296 .
- Danby , R.K. and Hik , D.S. 2007 . Variability, contingency and rapid change in recent subarctic alpine tree line dynamics . Journal of Ecology , 95 ( 2 ) : 352 – 363 .
- Daubenmire , R.F. 1954 . Alpine timberlines in the Americas and their interpretation . Butler University Botanical Studies , 11 : 119 – 136 .
- Daugstad , K. 2000 . Mellom romantikk og realisme. Om seterlandskapet som ideal og realitet . Dr. polit. Thesis, Department of Geography , NTNU , Trondheim .
- Dierschke , H. 1994 . Pflanzensoziologie. Grundlagen und Methoden , Stuttgart : Ulmer Verlag .
- Dullinger , S. , Dirnböck , T. and Grabherr , G. 2004 . Modelling climate change-driven tree line shifts: Relative effects of temperature increase, dispersal and invasibility . Journal of Ecology , 92 : 241 – 252 .
- Emanuelsson , U. 1987 . Human influence on vegetation in the Tornträsk area during the last three centuries . Ecological Bulletin , 38 : 95 – 111 .
- Engen-Skaugen , T. 2004 . Refinement of Dynamically Downscaled Precipitation and Temperature Scenarios . DNMI Climate Report 15, 1–20. Det Norske Meteorologiske Institutt, Oslo .
- Fang , J-Y. and Li , Y. 2002 . Climatic factors for limiting northward distribution of eight temperate tree species in eastern North America . Acta Botanica Sinica , 44 : 199 – 203 .
- Fjellstad , W.J. and Dramstad , W.E. 1999 . Patterns of change in two contrasting Norwegian agricultural landscapes . Landscape and Urban Planning , 45 ( 4 ) : 177 – 191 .
- Franke , J. and Köstner , B. 2007 . Effects of recent climate trends on the distribution of potential natural vegetation in Central Germany . International Journal of Biometeorology , 52 ( 2 ) : 139 – 147 .
- Gamache , I. and Payette , S. 2004 . Height growth response of tree line black spruce to recent climate warming across the forest-tundra of eastern Canada . Journal of Ecology , 92 : 835 – 845 .
- Gamache , I. and Payette , S. 2005 . Latitudinal response of subarctic tree lines to recent climate change in eastern Canada . Journal of Biogeography , 32 : 849 – 862 .
- Gautestad , A.O. Wielgolaski , F.E. Solberg , B. & Mysterud , I. 2005 . Scenarios for future development of the mountain birch ecosystem . Wielgolaski , F.E. Plant Ecology, Herbivory and Human Impact in Nordic Mountain Birch Forests , 301–311. Ecological Studies 180. Springer Verlag, Berlin .
- Gehrig-Fasel , J. , Guisan , A. and Zimmermann , N.E. 2007 . Tree line shifts in the Swiss Alps: Climate change or land abandonment? . Journal of Vegetation Science , 18 ( 4 ) : 571 – 582 .
- Gehrig-Fasel , J. , Guisan , A. and Zimmermann , N.E. 2008 . Evaluating thermal treeline indicators based on air and soil temperate using an air-to-soil temperature transfer model . Ecological Modelling , 213 ( 3-4 ) : 345 – 355 .
- Gellrich , M. , Baur , P. , Robinson , B.H. and Bebi , P. 2008 . Combining classification tree analyses with interviews to study why subalpine grasslands sometimes revert to forest: A case study from the Swiss Alps . Agricultural Systems , 96 : 124 – 138 .
- Gjessing , S.C. 1845 . Kart Over Christians Amt. Amtskart for Oppland i Målestokk 1:200,000 . Kongelige Norske Regjerings Finants- Handels- og Told Departements Foranstaltning, Christiania .
- Green , D.R. & Hartley , S. 2000 . Integrating photointerpretation and GIS for vegetation mapping: some issues of error . Alexander , R. & Millington , A.C. Vegetation Mapping , 103 – 134 . John Wiley & Sons, Chichester .
- Hanssen-Bauer , I. , F⊘rland , E.J. , Haugen , J.E. and Tveito , O.E. 2003 . Temperature and precipitation scenarios for Norway: Comparison of results from dynamical and empirical downscaling . Climate Research , 25 ( 15 ) : 15 – 27 .
- Hanssen-Bauer , I. , Achberger , C. , Benestad , R.E. , Chen , D. and F⊘rland , E.J. 2005 . Statistical downscaling of climate scenarios over Scandinavia . Climate Research , 29 ( 3 ) : 255 – 268 .
- Hofgaard , A. 1997 . Inter-relationship between treeline position, species diversity, land use and climate change in the central Scandes Mountains of Norway . Global Ecological Biogeography Letters , 6 ( 6 ) : 419 – 429 .
- Holtmeier , F.-K. 2003 . Mountain Timberlines, Ecology, Patchiness and Dynamics , Dordrecht : Kluwer .
- Holtmeier , F.-K. and Broll , G. 2005 . Sensitivity and response of northern hemisphere altitudinal and polar treelines to environmental change at landscape and local scales . Global Ecological Biogeography Letters , 14 ( 5 ) : 395 – 410 .
- Holtmeier , F.-K. & Broll , G. 2007 . Treeline advance – driving processes and adverse factors . Landscape Online 1 , 1–33. DOI:10.3097/LO.200701 .
- Hovdhaugen , E. 1988 . Busetningshistoria for Venabygd . Hemgrenda , 12 : 8 – 24 .
- Hugget , R. and Cheesman , J. 2002 . Topography and the Environment , Harlow : Prentice Hall .
- Ihse , M. 2007 . Colour infrared aerial photography as a tool for vegetation mapping and change detection in environmental studies of Nordic ecosystems: A review . Norwegian Journal of Geography , 61 ( 4 ) : 170 – 191 .
- IPCC 2001 . Climate Change 2001: Synthesis Report . Cambridge University Press , Cambridge .
- Kaplan , J.O. , Bigelow , N.H. , Prentice , I.C. , Harrison , S.P. , Bartlein , P.J. , Christensen , T.R. , Cramer , W. , Matveyeva , N.V. , McGuire , A.D. , Murray , D.F. , Razzhivin , V.Y. , Smith , B. , Walker , D.A. , Anderson , P.M. , Andreev , A.A. , Brubaker , L.B. , Edwards , M.E. and Lozhkin , A.V. 2003 . Climate change and arctic ecosystems: 2. Modelling, paleodata-model comparisons, and future projections . Journal of Geophysical Research , 108 ( D19 ) : 1 – 17 .
- Karlsson , P.S. Weih , M. & Borg , C. 2005 . Mountain birch growth in relation to climate and herbivores . Wielgolaski , F.E. Plant Ecology, Herbivory and Human Impact in Nordic Mountain Birch Forests , 71 – 86 . Ecological Studies 180. Springer Verlag, Berlin .
- Karlsson , H. , Hörnberg , G. , Hannon , G. and Nordström , E-M. 2007 . Long-term vegetation changes in the northern Scandinavia forest limit: A human impact-climate synergy? . The Holocene , 17 ( 1 ) : 37 – 49 .
- Kjällgren , L. and Kullmann , L. 2002 . Geographical patterns of tree-limits of Norway spruce and Scots pine in the southern Swedish Scandes . Norwegian Journal of Geography , 56 ( 4 ) : 237 – 245 .
- Kleiven , I. 1928 . Gamal Bondekultur i Gudbrandsdalen, Ringebu , Oslo : Aschehoug .
- Koca , D. , Smith , B. and Sykes , M.T. 2006 . Modelling regional climate change effects on potential natural ecosystems in Sweden . Climatic Change , 78 ( 2-4 ) : 381 – 406 .
- Körner , C. 2007 . Climatic treelines: Conventions, global patterns, causes . Erdkunde , 61 ( 4 ) : 316 – 324 .
- Körner , C. and Paulsen , J. 2004 . A world-wide study of high altitude treeline temperatures . Journal of Biogeography , 31 ( 55 ) : 713 – 732 .
- Kullman , L. 2000 . Tree-limit rise and recent warming: A geoecological case study from the Swedish Scandes . Norwegian Journal of Geography , 54 ( 2 ) : 49 – 59 .
- Kullman , L. 2001 . 20th century climate warming and tree-limit rise in the southern Scandes of Sweden . AMBIO , 30 ( 2 ) : 72 – 80 .
- Kullman , L. 2006 . Long-term geobotanical observations of climate change impacts in the Scandes of West-Central Sweden . Nordic Journal of Botany , 24 ( 4 ) : 445 – 467 .
- Kullman , L. 2007 . Tree line population monitoring of Pinus sylvestris in the Swedish Scandes, 1973–2005: Implications for tree line theory and climate change ecology . Journal of Ecology , 95 ( 1 ) : 41 – 52 .
- Kullman , L. and Kjällgren , L. 2006 . Holocene pine tree-line evolution in the Swedish Scandes: Recent tree-line and climate change in a long-term perspective . Boreas , 35 ( 1 ) : 159 – 168 .
- Larsson , J.Y. 2004 . Skoggrensa i Norge – indikator på endringer i klima og arealbruk? NIJOS Rapport 3, 1–47. Norsk institutt for jord- og skogkartlegging, Ås .
- Lid , J. and Lid , D.T. 2005 . Norsk Flora , Oslo : Det Norske Samlaget .
- Löffler , J. , Lundberg , A. , Rössler , O. , Bräuning , A. , Jung , G. , Pape , R. and Wundram , D. 2004 . The alpine treeline under changing land use and changing climate: Approach and preliminary results from continental Norway . Norwegian Journal of Geography , 58 ( 4 ) : 183 – 193 .
- Lundberg , A. 2002 . The interpretation of culture in nature: Landscape transformation and vegetation change during two centuries at Hystad, SW Norway . Norwegian Journal of Geography , 56 ( 4 ) : 246 – 256 .
- Mackenzie , A. 2005 . Mathematics & Statistics for Life Scientists , New York : Taylor & Francis .
- Mazepa , V.S. 2005 . Stand density in the last millennium at the upper tree-line ecotone in the polar Ural Mountains . Canadian Journal of Forest Research , 35 ( 9 ) : 2082 – 2091 .
- Metz , B. and Davidson , O. 2007 . Climate Change 2007. Mitigation , Cambridge : Cambridge University Press .
- Miller , P.A. , Giesecke , T. , Hickler , T. , Bradshaw , R.H.W. , Smith , B. , Seppä , H. , Valdes , P.J. and Sykes , M.T. 2008 . Exploring climatic and biotic controls on Holocene vegetation change in Fennoscandia . Journal of Ecology , 96 ( 2 ) : 247 – 259 .
- Moen , A. 1999 . Vegetation. National Atlas of Norway , H⊘nefoss : Norwegian Mapping Authority .
- Moravec , J. 1998 . Reconstructed natural versus potential natural vegetation in vegetation mapping – a discussion of concepts . Applied Vegetation Science , 1 ( 2 ) : 173 – 176 .
- Mork , E. 1960 . Om sambandet mellom temperatur, toppskuddtilvekst og årringenes vekst og forvedning hos gran (Picea abies (L.) Karst.) . Meddelelser fra Det Norske Skogfors⊘ksvesen , 56 ( 16 ) : 226 – 261 .
- Mork , E. 1968 . Økologiske unders⊘kelser i fjellskogen i Hirkj⊘len fors⊘ksområde . Meddelelser fra Det Norske Skogfors⊘ksvesen , 93 ( 25 ) : 463 – 614 .
- Motta , R. , Morales , M. and Nola , P. 2006 . Human land-use, forest dynamics and tree growth at the treeline in the Western Italian Alps . Annals of Forest Science , 63 ( 7 ) : 739 – 747 .
- Nakagoshi , N. , Hikasa , M. , Koarai , M. , Goda , T. and Sakai , I. 1998 . Grid map analysis and its application for detecting vegetation changes in Japan . Applied Vegetation Science , 1 ( 2 ) : 219 – 224 .
- Neuhäuslová , Z. , Moravec , J. , Chytrý , M. , Ložek , V. , Rybníček , K. , Rybníčková , E. , Husová , M. , Grulich , V. , Jeník , J. , Sádlo , J. , Jirásek , J. , Kolbek , J. and Wild , J. 2001 . Potential natural negetation of the Czech Republic . Braun-Blanquetia , 30 : 1 – 80 .
- Neuvonen , S. Bylund , H. & T⊘mmervik , H. 2005 . Forest defoliation risk in birch forest by insects . Wielgolaski , F.E. Plant Ecology, Herbivory and Human Impact in Nordic Mountain Birch Forests , 125 – 138 . Ecological Studies 180. Springer Verlag, Berlin .
- Olsson , E.G.A. , Austrheim , G. and Grenne , S.N. 2000 . Landscape change patterns in mountains, land use and environmental diversity, Mid-Norway 1960–1993 . Landscape Ecology , 15 ( 2 ) : 155 – 170 .
- Perry , G.L.W. and Millington , J.D.A. 2008 . Spatial modelling of succession-disturbance dynamics in forest ecosystems: Concepts and examples . Perspectives in Plant Ecology, Evolution and Systematics , 9 : 191 – 210 .
- Potthoff , K. 2007 . Persistence of alpine grass-dominated vegetation on abandoned mountain summer farms in Western Norway . Norwegian Journal of Geography , 61 ( 4 ) : 192 – 206 .
- Puschmann , O. 2005 . Nasjonalt Referansesystem for Landskap. Beskrivelse av Norges 45 Landskapsregioner . NIJOS Rapport 10, 1–204. Norsk institutt for jord- og skogkartlegging, Ås .
- Pykälä , J. , Luoto , M. , Heikkinen , R.K. and Kontula , T. 2005 . Plant species richness and persistence of rare plants in abandoned semi-natural grasslands in northern Europe . Basic and Applied Ecology , 6 ( 1 ) : 25 – 33 .
- Raper , S.C. & Giorgi , F. 2005 . Climate change projections and models Lovejoy , T.E. & Hannah , L. Climate Change and Biodiversity , 199 – 210 . Yale University Press , New Haven .
- Reinton , L. 1957 . Sæterbruket i Noreg. II. Anna Arbeid på Sætra. Sætra i Haustingsbruket og i Matn⊘ytsle elles , Oslo : Aschehoug .
- Resvoll-Holmsen , H. 1918 . Fra fjeldskogene i det ⊘stenfjeldske Norge . Tidsskrift for Skogbruk , 26 : 107 – 223 .
- Ricotta , C. , Carranza-Maria , L. , Avena , G.C. and Blasi , C. 2002 . Are potential natural vegetation maps a meaningful alternative to neutral landscape models? . Applied Vegetation Science , 5 ( 2 ) : 271 – 275 .
- Rutherford , G.N. , Bebi , P. , Edwards , P.J. and Zimmermann , N.E. 2008 . Assessing land-use statistics to model land cover change in a mountainous landscape in the European Alps . Ecological Modelling , 212 ( 3-4 ) : 460 – 471 .
- Sakai , A. & Larcher , W. 1987 . Frost Survival of Plants. Responses and Adaption to Freezing Stress . Ecological Studies 62. Springer Verlag, Berlin .
- Sandmann , H. and Lertzman , K.P. 2003 . Combining high-resolution aerial photography with gradient-directed transects to guide field sampling and forest mapping in mountainous terrain . Forest Science , 49 ( 3 ) : 429 – 443 .
- Sch⊘ning , G. 1826 [1775] . Reise Gjennem Gudbrandsdalen 1775 . Norsk Skoletiendes Boktrykkeri, Hamar .
- Sickel , H. , Ihse , M. , Norderhaug , A. and Sickel , M. 2004 . How to monitor semi-natural key habitats in relation to grazing preferences of cattle in mountain summer farming areas. An aerial photo and GPS method study . Landscape and Urban Planning , 67 : 67 – 77 .
- Siedlicka , A. , Nystuen , J.P. , Englund , J.O. & Hossack , J. 1987 . Lillehammer Berggrunnskart, M 1:250,000 . Norges Geologiske Unders⊘kelse, Trondheim .
- Skre , O. 2001 . Climate change impacts on mountain birch ecosystems . Wielgolaski , F.E. Nordic Mountain Birch Ecosystem , 343 – 357 . UNESCO Man and Biosphere Series 27. Parthenon Publishing Group, New York .
- Smith , J. and Smith , P. 2007 . Environmental Modelling – an Introduction , Oxford : Oxford University Press .
- S⊘mme , A. 1954 . Jordbrukets Geografi i Norge . Tekstbind. Skrifter fra Norges handelsh⊘yskole. Rekken av Geografiske Avhandlinger 3, 1–415. J. W. Eides Forlag, Bergen .
- Solberg , B.Ø. , Hofgaard , A. and Hytteborn , H. 2002 . Shifts in radial growth of coastal Picea abies induced by climatic change during the 20th century, central Norway . Ecoscience , 9 ( 1 ) : 79 – 88 .
- Solberg , E.J. , Rolandsen , C.M. , Heim , M. , Gr⊘tan , V. , Garel , M. , Sæther , B-E. , Nilsen , E.B. , Austrheim , G. & Herfindal , I. 2006 . Moose in Norway. An Analysis of Material Collected by Moose Hunters 1966-2004 . NINA Report 125, 1–197. Norsk institutt for naturforskning, Trondheim .
- Soliva , R. , R⊘nningen , K. , Bella , I. , Bezak , P. , Cooper , T. , Fl⊘ , B.J. , Marty , P. and Potter , C. 2008 . Envisioning upland futures: Stakeholder responses to scenarios for Europe's mountain landscape . Journal of Rural Studies , 24 : 56 – 71 .
- Solomon , S. , Qin , D. and Manning , M. 2007 . Climate Change 2007. The Physical Science Basis , Cambridge : Cambridge University Press .
- Strand , L.T. , Abrahamsen , G. and Stuanes , A.O. 2005 . Lysimeter study on the effects of different rain qualities on element fluxes from shallow mountain soils in southern Norway. Water . Air and Soil Pollution , 165 : 379 – 402 .
- Tasser , E. , Walde , J. , Tappeiner , U. , Teutsch , A. and Noggler , W. 2007 . Land-use changes and natural reforestation in the Eastern Central Alps. Agriculture . Ecosystems and Environment , 118 : 115 – 129 .
- Tengwall , T.Å. 1918 . Iaktagelser över fjällbjörkeskogens övre begränsning och ecologi i Sveriges nordliga Lappmarker . Svensk Botanisk Tidskrift , 12 : 171 – 179 .
- Thannheiser , D. , T⊘mmervik , H. & Wehberg , J. 2005 . The vegetation changes and recent impact on the mountain birch forest during the last 40 years . Wielgolaski , F.E. Plant Ecology, Herbivory and Human Impact in Nordic Mountain Birch Forests , 235 – 253 . Ecological Studies 180. Springer Verlag, Berlin .
- Theurillat , J.-P. and Guisan , A. 2001 . Potential impact of climate change on vegetation in the European Alps: A review . Climate Change , 50 ( 1 ) : 77 – 109 .
- Timoney , K. 1995 . Tree and tundra anomalies in the subarctic forest-tundra of western Canada . Arctic 48 , 13 – 21 .
- Tüxen , R. 1956 . Die heutige potentielle natürliche vegetationen als gegenstand der vegetationskarten . Angewandte Pflanzensoziologie (Stolzenau) , 13 : 4 – 42 .
- Vajda , A. and Venäläinen , A. 2005 . Feedback processes between climate, surface and vegetation at the northern climatological tree-line (Finnish Lapland) . Boreal Environment Research , 10 ( 4 ) : 299 – 314 .
- Vandvik , V. and Birks , H.J.B. 2004 . Mountain summer farms in R⊘ldal, western Norway – vegetation classification and patterns in species turnover and richness . Plant Ecology , 170 ( 2 ) : 203 – 222 .
- \Voldoire , A. , Eickhout , B. , Schaeffer , M. , Royer , J.F. and Chauvin , F. 2007 . Climate simulation of the twenty-first century with interactive land-use changes . Climate Dynamics , 29 ( 2–3 ) : 177 – 193 .
- Walter , H. 1968 . Die Vegetation der Erde in Öko–physiologischer Betrachtung. Band II: Die Gemäßigten und Arktischen Zonen , Jena : Gustav Fischer Verlag .
- Wehberg , J. , Thannheiser , D. & Meier , K.-D. 2005 . Vegetation of the mountain birch forest in northern Fennoscandia Wielgolaski , F.E. Plant Ecology, Herbivory and Human Impact in Nordic Mountain Birch Forests , 35 – 52 . Ecological Studies 180. Springer Verlag, Berlin .
- Wielgolaski , F.E. 2005 . History and environment of the Nordic mountain birch . Wielgolaski , F.E. Plant Ecology, Herbivory and Human Impact in Nordic Mountain Birch Forests , 3 – 18 . Ecological Studies 180. Springer Verlag, Berlin .
- Wyatt , B.K. 2000 . Vegetation mapping from ground, air and space – competitive or complementary techniques? Alexander , R. & Millington , A.C. Vegetation Mapping , 3 – 15 . John Wiley & Sons , Chichester .
- Zerbe , S. 1998 . Potential natural vegetation: Validity and applicability in landscape planning and nature conservation . Applied Vegetation Science , 1 ( 2 ) : 165 – 172 .