
ABSTRACT
The Norwegian area frame survey of land cover and outfield land resources (AR18X18), completed in 2014, provided unbiased statistics of land cover in Norway. The article reports the new statistics, discusses implications of the data set, and provides potential value in terms of research, management, and monitoring. A gridded sampling design for 1081 primary statistical units of 0.9 km2 at 18 km intervals was implemented in the survey. The plots were mapped in situ, aided by aerial photos, and all areas were coded following a vegetation type system. The results provide new insights into the cover and distribution of vegetation and land cover types. The statistic for mire and wetlands, which previously covered 5.8%, has since been corrected to 8.9%. The survey results can be used for environmental and agricultural management, and the data can be stratified for regional analyses. The survey data can also serve as training data for remote sensing and distribution modelling. Finally, the survey data can be used to calibrate vegetation perturbations in climate change research that focuses on atmospheric–vegetation feedback. The survey documented novel land cover statistics and revealed that the national cover of wetlands had previously been underestimated.
Introduction
Land cover mapping
Land cover mapping is the description of the surface of the earth through classification of its physical characteristics, including its biophysical characteristics. The resulting land cover maps and derived land cover statistics are needed to address various societal and environmental challenges. Present and future climate changes (Bontemps et al. Citation2012), an expanding bioeconomy (Hertel et al. Citation2013), land use changes (Mellino & Ulgiati Citation2015), and environmental management (Mulvihill & Ali Citation2017) are all issues calling for reliable information on land cover and land cover change. The need for land cover knowledge is therefore growing (Giri et al. Citation2013).
The cost of acquiring land cover information is closely linked to the size of the area and the amount of detail required. Land cover information for large areas therefore tends to lack either pivotal land cover classes or spatial precision (Foody Citation2002; Selkowitz & Stehman Citation2011; Wickham et al. Citation2013). Only small fractions of the earth have been mapped through field surveys (Alexander & Millington Citation2000). In particular, this is the case for the vast areas with low population densities at high latitudes. The extent of detailed land cover maps based on field surveys for these areas is low (Ullerud et al. Citation2016). The challenge is most apparent on the global scale, where the solution frequently has been to employ satellite remote sensing (RS), such as the MODIS Global Land Cover (MOD12Q1) (Friedl et al. Citation2010) or the database of European Commission’s Global Land Cover 2000 Project (GLC 2000) for the year 2000 (Mayaux et al. Citation2004; Bartholomé & Belward Citation2005).
The number of coarse-scaled land cover maps with few classes based on RS has increased tremendously since the late 1980s (Wang et al. Citation2009; Hussain et al. Citation2013). However, particularly for mountainous regions at high latitudes, such as in Norway, where topography, low sun angle, frequent clouds, few validation plots, and a short growing season combine to make RS difficult, RS methods have so far not been able to map vegetation and land cover with the geometric and thematic accuracy required for many research and management purposes (Erikstad et al. Citation2009; Strand Citation2013; Benjaminsen et al. Citation2015).
Area frame surveys and land cover maps of Norway
In Norway, a number of fairly detailed land cover map series based on field surveys exist, but none of these covers the entire country or is in any way representative of the regional variations in Norway. The most frequently used vegetation mapping system in Norway (Rekdal & Larsson Citation2005) has been operational since the early 1980s and according to the most recent data it now covers c.10% (30,000 km2) of the land area (Rekdal & Bryn Citation2010). The progress is project-based, and thus highly inclined toward specific regions of Norway. The national land resource mapping of Norway at a scale of 1:5,000 (Arealressurskart i målestokk 1:5000, abbreviated as AR5), which has been running since the 1960s, covers c.57% (185,000 km2) of Norway (Ahlstrøm et al. Citation2014), but further enlargement of the coverage is not anticipated. The land below the treeline is covered, and detailed land resource mapping is not needed for the mountains. However, the land cover classes used in AR5 do not provide the information needed for some purposes, such as the planning of domestic grazing in outfieldsFootnote1 or environmental management (Straume Citation2013).
The standard topographic maps (N50) (Statens kartverk Citation2014) provide land cover information for the entire country. There are several concerns regarding this map layer. First, the classification system suitable for topographic mapping at scale 1:50,000 is coarse. Second, details are kept or removed selectively, for cartographic reasons. Third, and lastly, the main source for N50 is aerial photo interpretation without field validation. For example, most of the mountain regions are left without any land cover information. The only land cover class present in the mountains (except for infrastructure features such as roads, paths, and houses) is patches of wetland. Some authors have questioned the information, claiming that the area of wetlands in Norway is severely underestimated by N50 (Bryn et al. Citation2013; Moen et al. Citation2017).
Parallel with the wall-to-wall map series, there are a number of sample based mapping projects in Norway. The mapping of nature types (DN Citation2007), which has been running since the late 1990s, only includes a selection of specific land cover types. In addition, the mapping design is purposive in the sense that the selected land cover types are mapped incidentally (i.e. if they are found), without any further information about the areas without any registration. It is therefore impossible to extract unbiased land cover information from these maps. With the exception of area frame surveys focusing on particular ecosystems or economic land cover categories, such as the National Forest Inventory (NFI) (Tomter et al. Citation2010) and the National Agricultural Monitoring Programme (Tilstandsovervåking og resultatkontroll i jordbrukets kulturlandskap, abbreviated as 3Q) (Dramstad et al. Citation2002), there have been no area frame surveys covering the entire area of Norway in order to provide unbiased land cover statistics.
The need for improved land cover information
The need for national land resource statistics in Norway was articulated in the 1970s (NOU Citation1972: 44). However, for various reasons, no survey was finalized and land resources were generally absent from the political agenda in Norway throughout the 1980s and 1990s. Since the turn of the century, many Norwegian Official Reports (NOUs) and Government White Papers have again raised the issue (Strand Citation2013, 26). National authorities, policymakers, and the interested public in general are all demanding better information about the situation and scenarios for future land use (Rogstad et al. Citation1997). Various interest groups, including farmers, foresters, pastoralists, developers, tourist industry, hikers, and environmentalists, are taking an interest in land management, resulting in conflicts over the use and protection of land resources (Skre Citation2017).
To meet the assembled societal need for precise, detailed, unbiased, and extensive land cover information at a national scale, the ‘Norwegian land cover and land resource survey of the outfields’ (‘Arealregnskap for utmark’, abbreviated as AR18X18) was initiated in 2004 (Rekdal & Strand Citation2005). An area frame survey, providing land cover information based on a representative and unbiased sample of wall-to-wall mapped plots can provide precise, detailed, and extensive land cover data at low cost. The survey design and method implemented in AR18X18 has previously been reported by Strand (Citation2013). The field survey has since been completed after more than 10 years of fieldwork (2005–2014). In this article, we present and discuss the main results.
The purpose of this article is to report the new land cover statistics for Norway and to compare the results with other commonly used sources for land cover information. Furthermore, we discuss major differences between earlier and new statistics, with a particular emphasis on wetlands. Potential errors and uncertainties are discussed too, and finally we address the potential value of this new data set for research and management purposes.
Study area
Biophysical conditions
The AR18X18 survey covered mainland Norway and islands along the coast. The study area covered c.324,000 km2, including inland waterbodies (), and ranged from 58°N to 71°N and from 5°E to 31°E. Norway is positioned along the north-west Atlantic coast of the Eurasian continental landmass and forms a part of the Scandes mountain chain. The topography ranges from sea level up to 2469 m a.s.l. The landscape of Norway is almost as varied as the combined variations within all of the Nordic countries with respect to latitude, longitude, altitude, climate conditions, geology, bioclimatic zones, and topography (Moen Citation1999; Bakkestuen et al. Citation2008). The landforms vary from gently undulating paleic plateaus in south-east and north-east Norway, to steep and alpine younger landscapes in western parts of the country (Puschmann Citation2005). Deep fiords cut into the western parts of the country, whereas long valleys intersect the paleic landscapes of interior south Norway.
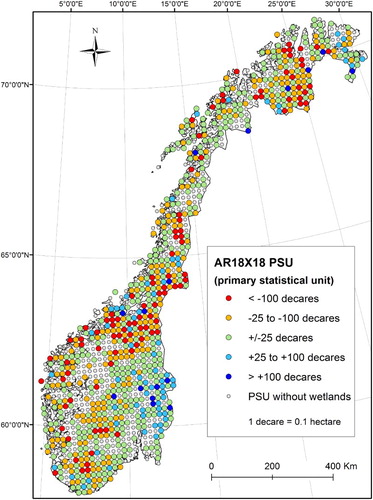
Fig. 1. The study area with all PSUs marked as cells; the cell colours show deviation in wetland areas among AR18X18 and N50; blue cells have too much wetland in N50 compared with AR18X18, whereas red and yellow cells have too little wetland; green cells have only minor deviations (< 25 decares or < 2.5 ha)
The geology of Norway is dominated by old Precambrian rocks of the Baltic shield, mainly slow weathering quartzite- and/or feldspar-dominated granites and gneiss (Ramberg et al. Citation2007). Layers of faster weathering rocks, supporting a more diverse and productive biota, appear scattered in areas dominated by younger bedrock. The bedrock is mainly covered by thin and discontinuous layers of till dating from the last ice age, but large areas in eastern Norway have thick and continuous layers of till (NGU Citationn.d.). Boulder fields and bare rocks dominate at high altitudes and along the outermost coast. In regions below the previously higher marine limit, marine clays cover extensive areas from the south to the north of Norway. Organic soils are present in all vegetated parts of Norway, and podzols are the dominating soils in the boreal region (Moen Citation1999).
For Norway, at least two main environmental gradients are believed to regulate the spatial structure of the biota: a west–east gradient from coastal humid regions to inland continental regions, and a south–north gradient from warmer low latitudes to colder high latitudes. The latter gradient is paralleled by the lowland–highland altitudinal gradient, causing a general shift from nemoral to alpine bioclimatic zones (Bakkestuen et al. Citation2008).
Land use history
The land use history of Norway is closely related to the available natural resources and general socio-economic development. The historical land use is thus as varied as the nature, including a wide range of traditions that have affected the distribution and structure of the biota throughout the country. Domestic animals and agriculture spread from the Fertile Crescent of the Middle East to Norway around 3700 BC and paved the way for increased land use (Diamond Citation2002; Emanuelsson Citation2009). By 1000 BC, agriculture had consolidated in the coastal regions of northern Norway, but then in combination with extensive fishing or hunting activities (Almås et al. Citation2004). Through centuries of varied agricultural activities, such as land cultivation, domestic grazing, forest logging, heath burning, and outfield fodder collection, the forested area in Norway slowly decreased (Aas & Faarlund Citation1995; Bjune Citation2005). The agricultural land use also led to extensive areas dominated by semi-natural vegetation types (Norderhaug & Johansen Citation2010). During the 20th century, most of the agricultural use of natural resources in outfields gradually declined, and today the use of outfield resources in Norway is at a historically low level (Almås et al. Citation2004; Ross et al. Citation2016). Approximately 16% of the country is deforested (Bryn et al. Citation2013), and forest regeneration now dominates the landscape development of outfields in Norway (Moen et al. Citation2006; Bryn & Hemsing Citation2012; Hofgaard et al. Citation2013; Potthoff Citation2017).
Material and methods
Area frame survey design
The survey sampling design has been reported and discussed in full detail by Strand (Citation2013), and only the main components are provided here. The sampling design followed the first generation of the LUCAS (Land use/cover agricultural survey) programme, carried out in the EU countries by the European Statistical Agency (Eurostat Citation2003). The sampling units were centred on points located at the intersections of an 18 × 18 km grid. Each of these points was the centre of a Primary Statistical Unit (PSU) of 1500 × 600 m. Each PSU of 0.9 km2 was mapped wall-to-wall, delineating polygons of all areas.Footnote2
The data collected by the area frame survey was a systematic random sample: the random element was that the starting point of the survey was a random location; the systematic element was that the sampling units were located at 18 km intervals in both cardinal directions from the starting point. This sampling strategy shared the properties of a cluster sample whereby a single cluster of sampling units was selected from all possible 18 × 18 km configurations in a specific partition of the land surface, and where every element in the cluster was included in the sample. The selected sampling units constituted the systematic part of the sample, and the selection of the cluster was the random part.
The partition of the land surface into sampling units covering 0.9 km2 (1500 × 600 m) sampled at 18 km intervals resulted in 360 different clusters that could be selected as the sample:One of these clusters was selected by choosing a random starting point, and all the units in that particular cluster were included in the survey. The sampled population was thus N = 360 and the sample size was n = 1, since one out the 360 possible clusters was selected.
Spatial autocorrelation is a common characteristic of spatially distributed phenomena, including land cover and vegetation. Behind the term ‘spatial autocorrelation’ is the effect that places located near each other tend to be more similar than those separated by some distance (Cressie Citation1991; Haining et al. Citation2010). Systematic sampling is a particularly efficient sampling strategy for spatial surveys in the presence of autocorrelation (Thompson Citation2002). The strategy increases the prospect that the variance within the selected cluster will be high compared with the variance between the clusters. As a result, there is high likelihood that the sample will reflect much of the variation found in the population.
To profit from the sampling strategy, it is important to include all the elements of the ‘cluster’ in the sample. The practical implication is that sample plots falling partially outside the population are included. In the area frame survey, all sample plots partly located in Sweden or covering a substantial area of ocean were included as long as they contained part of the Norwegian mainland, but only the part of the sample unit falling inside Norway was actually mapped.
Mapping of vegetation types and land cover classes
The survey was carried out following a standard vegetation type mapping system (VK25) used by NIBIO, the present form of which has existed since the mid-1980s (Rekdal & Larsson Citation2005; Rekdal & Bryn Citation2010). Vegetation types represent more or less stable entities of plant communities characterized by physiognomy, plant species composition, indicator species, or a combination of all three, and are influenced by a number of ecological processes through time and space (Alexander & Millington Citation2000; Biondi et al. Citation2004). Each vegetation type reflects a specific ecological space that ‘sums up’ the ecological processes that structure the pattern of vegetation for the intended spatial scale of the applied mapping system (Pedrotti Citation2013). A vegetation map therefore represents a spatial simplification of the vegetation structure, classified into predefined types that are intended to mirror the underlying ecological processes at a given spatial scale.
The VK25 mapping system consists of 54 basic classes (described in Supplementary Appendix 1), of which 45 are defined by vegetation. The other classes comprise various land cover or land use characteristics, such as boulder fields, built-up areas, and water bodies. In addition, a number of ancillary registrations can be added to the basic observations, resulting in a key with c.2650 unique classes. Examples of ancillary registrations include the presence of exposed bedrock, a cover of willows and lichens, dominance of ferns, or a high cover of grasses suitable for domestic grazing () (for descriptions of the ancillary features listed in , see Supplementary Appendix 2).
Table 1. Ancillary registration of the basic classification
The VK25 mapping system is adapted to an intermediate scale (between 1:20,000 and 1:50,000, with a minimum polygon size of 0.5 ha. The practical delineation of polygons is done in situ, guided by aerial photos and a ×2.5 magnifying lens stereoscope. Black and white, colour, and infrared (IR) photos can be used for mapping vegetation (Ihse Citation2007), but IR photos have rarely been available. Vegetation polygons are delineated directly onto the aerial photos. The photos are subsequently scanned and geometrically rectified, and polygon borders digitized using GIS (geographic information system) software.
The guidelines for VK25 mapping include detailed instructions for a number of difficult aspects, such as drawing lines between fuzzy borders, deciding on vegetation type among closely related types, and recording the cover of species important for the separation between types (Bryn et al. Citation2015). A mosaic of two different land cover classes can be registered for a polygon when each class covers at least 25% of the area, and if the areas of unique land cover classes are below the minimum size for polygons (for these mapping rules and others, see Rekdal & Larsson Citation2005). For statistical purposes, the dominant land cover class is counted as covering on average 62% of each polygon, whereas the secondary class is counted for the remaining 38%.
Validation and reclassification
The estimated national cover of each vegetation type and land cover class was compared with results reported by other sources (). Reclassification and aggregation was required because the different surveys use different classification systems.
Table 2. Surveys and topic maps used to validate and/or for comparison with AR18x18
The forest statistics provided by the National Forest Inventory (NFI) in Norway was used to test the reliability of the survey. The NFI is a sample-based monitoring system covering all forested areas of Norway with c.12,000 plots (Tomter et al. Citation2010). The forest types, and a number of forest parameters, are registered within circular plots of 250 m2, dispersed within a national grid of 3 × 3 km ().
Land cover statistics derived from the standard topographic map covering the entire area of Norway at a scale of 1:50,000 (N50) (Statens kartverk Citation2014), was compared with aggregated land cover classes from AR18X18. Finally, the AR18X18 results were compared with a raster-based map of biogeographic regions in Norway.
The 54 classes used in AR18X18 were aggregated to mirror the broader classes provided by N50. The reclassification was straight forward: all forested vegetation types (e.g. bilberry spruce forest (7b) and meadow birch forest (4c)) were merged into one broad class of Forest (B), directly comparable with the forest class in N50 (and the NFI). Similarly, all bogs (9a), fens (9c), and other wetland types were merged into a broad wetland class, also directly comparable with the wetland class of N50 (see Supplementary Appendix 3 for the reclassification table).
For the analysis of land cover deviations between AR18X18 and N50, a full overlay analysis was performed using PostgreSQL (version 9.5.2) with POSTGIS (version 2.2.2, function: st_intersection). Other GIS operations were run using ArcMap (version 10.3).
In order to test for systematic differences between AR18X18 and N50 with respect to land cover classes where the two datasets disagreed (wetland in particular), all polygons from both datasets were attributed PCA (Principal Component Analysis) values from a stepless biogeographic region map (Bakkestuen et al. Citation2008), which was updated and downscaled to 1 × 1 km in 2017. The non-parametric Mann-Whitney U test was used to check whether any of the five wetland classes in AR18X18 deviated in bioclimatic sections (PCA1) and zones (PCA2) from the wetlands provided by N50. The Mann-Whitney U test was also used to check whether the aggregated wetland polygon sizes in AR18X18 differed from the overall wetland polygon sizes of N50 within the PSUs.
Estimating land cover statistics
The land cover statistics provided by the area frame survey was estimated for the entire country. The calculation of statistics based on the systematic sample is straightforward as long as the preconditions presented in the preceding section are observed. An unbiased estimator of the total of any parameter x for a region iswhere m is the number of locations in the sample, 360 is the sampling factor, and xi is the measurement of x for the part of location i falling within the region in question. A pragmatic adjustment can be made when the total area A of the study region is known, by including the measurement ai of the size of the area of each sampling unit falling within the study region
where
will be approximately 360. The ‘region’ can be the entire country or a stratum from one of the thematic partitions, such as a bioclimatic region.
Estimating variance
The AR18X18 survey was a systematic random sample, with the random element as the starting point of the survey. The sample had the same properties as a cluster sample, whereby only one cluster was selected (n = 1) and it was not possible to provide an unbiased estimate of the variance based on the sample itself (Thompson Citation2002). Recommended alternatives are to apply post-stratification using very small strata (Aune-Lundberg & Strand Citation2014) or to use a model-based prediction using values extracted from the semivariogram (Brus & Saby Citation2016). These methods were compared by Strand (Citation2017), who found that both approaches provided acceptable results. We used the method recommended by Aune-Lundberg & Strand (Citation2014) to estimate the uncertainty.
The estimator, , subdivides the sample into small, non-overlapping strata, where each stratum is a 2 × 2 tile sample neighbourhood. The estimation methods from stratified random sampling were then applied to the sample
where k is the number of strata, ni is the sample size in stratum i (valid cases, mostly four),
is the variance in stratum i, Ni is the population size in stratum i (set to 324 × ni since each unit in the sample ‘represents’ 18 × 18 = 324 tiles), and
where Ni is the population size in stratum i as explained above, and N is the total number of potential sample units in the population.
Results
When reclassified into 12 land cover groups, the dominant land cover in Norway is Alpine mountain heaths (; the percentage covers for all groups and classes are listed in ), covering c.24%. The least common land cover group is Broad-leafed deciduous forest, covering c.0.5% of Norway. The average land cover of all 12 groups is 8%, which is fairly close to the estimated area of Wetlands (8.9%).
Fig. 2. Estimated percentage cover of 12 land cover groups in Norway, based on the area frame survey
Table 3. Estimated area of all land cover groups and classes based on 1081 PSU of 0.9 km2
The dominant land cover class among the detailed VK25 classes is Dwarf shrub heath, estimated to cover c.12.1% of Norway (). Dwarf shrub heath is followed by Lichen and heather pine forest, estimated to cover c.8.1% of Norway. The least common land cover classes, covering less than 0.01%, are Birch forest on lime soils, Sand dunes and gravel beaches, and Floodplain shrubs. All three land cover classes are rare and have spatially clustered distributions.
The estimated area of the classes can vary considerably within the land cover groups (). The least common class among the Alpine heath communities is Dry grass heath (covering c.0.5%), whereas the most common class in this group is Dwarf shrub heath (covering c.12.1%) ().
When converted into a classification comparable with the standard topographic map (N50) of Norway (see Supplementary Appendix 1), the land cover groups from AR18X18 revealed a number of prominent differences (). Open area (A) is estimated to be overrepresented by c.7932 km2 in N50, whereas Wetland areas (C) are estimated to be underrepresented by c.10,068 km2. Furthermore, N50 reports c.3056 km2 more Forest (B) than the estimates from AR18X18, but lacks c.2639 km2 of Agricultural land (D). The N50 figures for Forest (B) are within the 95% confidence interval of the AR18X18 estimate, while the N50 figures for Open areas (A), Wetland (C), and Agricultural land (D) all are outside the 95% confidence intervals.
Table 4. Comparable land cover statistics of aggregated groups from the standard topographic map of Norway (N50) and the land cover survey (AR18X18); the estimate based on AR18X18 is shown as a percentage with the associated variance of the estimate, and a total area (in km2) together with a 95% confidence interval
A similar comparison between AR18X18 and the National Forest Inventory (NFI) (Tomter Citation2014) is presented in . The sample size is thus considerably larger than in AR18X18, but the plots are smaller (250 m2 in the NFI compared with 0.9 km2 in AR18X18). However, the two figures of forest land are almost identical and well within the 95% confidence interval of AR18X18.
Table 5. Comparable land cover statistics of forests in Norway, based on estimates from two grid-based sampling sources: the National Forest Inventory (NFI) (Tomter Citation2014) and the land cover survey (AR18X18); the estimate based on AR18X18 is shown as a percentage with the associated variance of the estimate, and a total area (in km2), together with a 95% confidence interval
The estimated cover of wetlands in Norway is 10,068 km2 more than the figure provided by N50. The differences in the distribution of wetland cover are not located randomly across Norway (). The areal deviance in wetlands compared within each PSU (wetland N50 minus wetland AR18X18), clearly shows that central and northern Norway have more wetlands than provided by the standard maps of Norway (N50). In some regions of south-east Norway, N50 has more wetland than AR18X18.
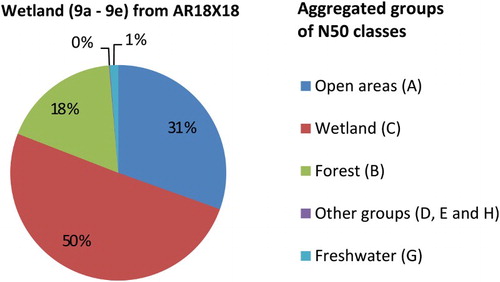
In AR18X18, both Open areas (A) and Wetlands (C) are present geographically throughout Norway, although Wetlands (C) are missing in the uppermost alpine parts. Of the total Wetlands (C) registered by AR18X18, 50% were found within the same group in N50 (), but 18% were registered as Forest (B) in N50. Of the new wetland registered by AR18X18, 62% were found within the Open areas (A) of N50, whereas c.36% were registered within Forests (B) of N50.
Fig. 3. The percentage of aggregated N50 land cover groups registered as wetlands by the AR18X18 survey; groups D, E, and H each cover less than 1%
The wetland areas missing in N50, identified as new wetland areas in AR18X18, are located within the same bioclimatic sections and regions as those that already exist in N50. The results of a Mann-Whitney U test revealed no average differences in either PCA1 or PCA2 values within any of the wetland types when the new areas from AR18X18 were compared with the existing wetland areas (N50).
The average polygon size within the PSUs of the existing wetlands from N50 (15.2 ha) were almost equal in size as the new aggregated wetland group from AR18X18 (c.17.5 ha). The 300 smallest wetland polygons in N50 were on average c.0.12 ha, whereas they were c.0.58 ha in AR18X18. The 300 largest wetland polygons were c.109 ha and c.115 ha, respectively.
Discussion
New and detailed land cover statistics
The results provided by the AR18X18 survey (listed in ) are unbiased and detailed land cover statistics that have never published before. Since the first wall-to-wall vegetation map from Norway was published in 1937 (Mork & Heiberg Citation1937), several thousand square kilometres have been mapped, following various classification systems (Bryn Citation2006). None of these vegetation mapping systems has been sampled to represent unbiased statistics of the entire country.
Previous land cover statistics, including those for the entire area of mainland Norway, have been based on mapping systems with few classes, none of which are relevant for outfield nature management and resource planning. With regard to such classes, most land cover information in, for example, N50 is given by three main land cover classes (see ): Open areas, Forests and Wetlands. These three classes from N50 are now reported with a much more informative classification system, providing 22 classes within Open areas (A), 20 classes within Forests (B), and 5 classes of Wetlands (C).
In addition, each class within AR18X18 is further described by a number of ancillary features (), giving in total 2644 unique polygon signatures from the entire survey. As an example, the land cover of basophilic mires can be extracted through a simple GIS query. Hence, based on the survey data, the estimated land cover of basophilic Fens (9c) in Norway is c.1196 km2, with c.891 km2 of those above the treeline. In essence, this analysis confirms that basophilic and species-rich mires below the treeline in Norway are rare (Moen et al. Citation2001), covering less than 0.1% of the land area, and that probably the conservation focus on this vegetation type is justified based on the very restricted distribution (Moen & Øien Citation2011).
General comparison with previous maps and statistics
The new land cover statistics for Norway are partly confirmed by previously published maps and statistics (e.g. Moen Citation1999; Statens kartverk Citation2014; Tomter Citation2014), but some of the aggregated land cover groups and vegetation types have varying degrees of area deviations from these publications ( and ). The causes of the deviations in the statistics vary. In this subsection, we discuss the most important aspects, starting with the most common groups and types.
Following Moen (Citation1999, 117), the cover of alpine zones in Norway sums up to c.32%. This is approximately equal to the estimates provided by AR18X18 () when the area of all alpine vegetation groups was summed (32.3%). However, the total alpine areas above the empirical forest line estimated by AR18X18 include deforested areas in the subalpine zone (Bryn et al. Citation2013; Citation2014), as well as large areas of Boulder fields, Exposed bedrock, and Wetlands. The alpine area in AR18X18 sum up to 42% of Norway. AR18X18 thus included large areas deforested by centuries of land use (Bryn & Daugstad Citation2001), whereas Moen’s estimate refers to areas strictly above the climatic forest line. Also, Moen’s estimates were adapted to a coarser scale, and are therefore not directly comparable.
In total, the estimated forested area of Norway from AR18X18 seems reliable and is in close agreement with estimates from NFI (Tomter Citation2014). The NFI has estimated the forest cover in Norway as c.120,780 km2 (), which is only 1827 km2 less than the estimate from AR18X18, and within the expected degree of uncertainty of the survey. According to N50, the forest cover in Norway is slightly higher (125,663 km2) (), and is probably mainly due to the methods implemented for mapping N50, and partly because the definition of forests varies slightly between south and north Norway in N50 (Statens kartverk Citation2014, 62). For example, it is difficult to map birch forests from black-and-white photos (Ihse Citation2007) as is done in N50. It is particularly difficult to separate areas with small and scattered trees and bushes from areas that fit the definition of forest. The guidelines for N50 also point out that belts dominated by Salix species in northern parts of Norway are included as forests (Statens kartverk Citation2014, 62). The Salix belts, unless higher than 2.5 m, are not part of the forest definitionFootnote3 in AR18X18.
Compared with AR18X18, N50 lacks c.2639 km2 of Agricultural land (D) (). However, the aggregated group D in AR18X18 includes Pastures (11b), which is not included in the Agricultural land in N50. When the area of Pastures is removed from AR18X18, the land cover statistics of Agricultural land are almost equal to those in N50. Also, the area of Cultivated land and Pastures in AR18X18 is almost equal to the area provided for the two classes by AR5 (NIBIO Citation2016).
The least common land cover group in AR18X18 is Broad-leafed deciduous forest (0.5%), which is dominant within the nemoral zone, and was estimated by Moen to cover c.0.5% (Moen Citation1999, 99).
Implications of new land cover statistics: the case of wetlands
Wetlands in Norway have recently received renewed attention, partly because of their ability to store carbon and the proposed moratorium against turf exploitation (e.g. Moen et al. Citation2017) and partly because of ongoing wetland restorations projects (e.g. Joosten et al. Citation2015), but also because of the ecosystem services they provide (Joosten et al. Citation2017; Skre Citation2017). It is therefore important for the management authorities to have reliable estimates of the cover of wetlands. The cover of wetlands documented through the AR18X18 survey, shows that the previous numbers (N50) underestimated the cover of wetlands in Norway by more than 10,000 km2 compared with N50 ().
The added wetlands registered in Norway through AR18X18 are located within the same bioclimatic sections and regions as those wetlands that already exist within N50 (PCA test). Consequently, with the exception of south-east Norway and a few other smaller regions, there is a general underrepresentation of wetlands in N50. However, the difference within each PSU clearly shows that central and northern Norway have far more wetlands than documented by N50 (). These wetlands stem from both Open areas (A) and Forests (B) in N50 (). In other regions, such as south-east Norway (), N50 reports more wetlands than AR18X18. These areas are typically registered as peatland forests in AR18X18. If interpreted with early season black-and-white aerial photos, before leaf sprout of deciduous trees, such forests could easily be confused with open wetland and mapped as such in N50.
The geographical presence of Open areas (A) and Wetlands in most parts of the country results in statistics with very high reliability (). Previous field studies conducted as part of the long-term peatland survey (for estimates of peatland cover see e.g. Gjelsvik et al. Citation1945; Løddesøl Citation1948) have confirmed that the area of wetlands probably has been largely underestimated in N50 (Moen et al. Citation2017). Løddesøl (Citation1948) estimated the area of wetlands covered c.30,000 km2, which is somewhat more than the AR18X18 survey estimate of 28,777 km2 (). However, since Løddesøl’s estimates were published in the 1940s (Gjelsvik et al. Citation1945; Løddesøl Citation1948), some of these areas have been cultivated for agriculture or drained for forestry (Johansen Citation1997; Moen et al. Citation2017). Therefore, a reduction in estimated wetland areas since the 1940s should be as expected.
Many of the wetland statistics previously reported for Norway have been based on AR5 (e.g. Grønlund et al. Citation2010; Rusch Citation2012; Statistisk sentralbyrå Citation2017), which defines wetlands as having a peat depth of more than 30 cm (Ahlstrøm et al. Citation2014). Following this definition, Grønlund et al. (Citation2010) estimated the total wetland in Norway covered c.18,800–21,700 km2. However, AR5 only covers regions below the treeline. Therefore, the estimate provided by Grønlund et al. (Citation2010) is probably too low, both below the treeline and particularly above it. Either way, based on AR18X18, the estimated cover of wetlands in Norway is of ecological wetlands defined by the dominance of wetland plant species (including bryophytes) or barren peat (9d), irrespective of peat depth. Differences between the economically defined wetlands mapped following AR5 and the ecologically defined wetlands mapped following AR18X18 should therefore be expected.
The main reason for more wetlands in AR18X18 is not that smaller patches of wetlands have been mapped, but rather that new locations were documented and that existing polygons were enlarged. According to the mapping guidelines, the minimum polygon size of wetlands in N50 is > 0.4 ha (Statens kartverk Citation2014), whereas the minimum polygon size in AR18X18 is > 0.5 ha. This is confirmed by slightly smaller average wetland polygon sizes in N50 (c.15.2 ha) than in AR18X18 (c.17.5 ha). More precisely, our analysis of the 300 smallest and largest polygons of wetlands in N50 and AR18X18 showed that the smallest polygons had increased more in size (per cent increase) than the largest. The results of both N50 and AR18X18 are therefore probably restricted by the defined minimum polygon sizes. The 10 Secondary Statistical Unit (SSU) points gathered within each of the 1081 PSUs can be used to test such issues, but that is beyond the scope of this article (for an example of such an analysis see Aune-Lundberg & Strand Citation2017).
Approximately 36% of the new wetland documented by AR18X18, but not registered as wetland in N50, was found within Forests (B) in N50. This was not surprising, since small forest patches in N50 can be merged into larger polygons of forests. Especially in central Norway, which has the highest area of both existing and new wetlands, large areas of small and scattered tree species will influence both the interpretation of wetlands as well as the cartographic solutions.
Uncertainty in vegetation mapping
Whereas the uncertainty of the sampled-based approach has been reviewed recently (Strand Citation2017), the uncertainty resulting from the mapping process itself is far less known. The mapping process uncertainty, including vegetation-type classifications, polygon delineations, and rules for scale generalizations, is a major concern in vegetation mapping (Hearn et al. Citation2011). Misclassification of vegetation types, scale generalization of types appearing with small areas, and spatial displacement of fuzzy boundaries are all examples of challenges addressed by studies of uncertainty in vegetation mapping (Cherrill & McClean Citation1995; Hearn et al. Citation2011; Ullerud et al. Citation2018).
In large surveys such as AR18X18, fieldwork is carried out by a team of mappers. Nine fieldworkers were involved in the AR18X18 survey. All of the fieldworkers were skilled mappers and considerable effort was made to harmonize the team members with respect to classification, delineation, and scale generalization. However, studies of inter-observer variations and mapping consistency in vegetation surveys (Cherrill & McClean Citation1999; Cherrill Citation2013; Citation2016) have shown that inconsistencies and uncertainties are unavoidable. In a new study of vegetation mapping consistency (Ullerud et al. Citation2018), implementing the same classification system and mapping guidelines as AR18X18, the average pairwise consistency among fieldworkers was 60.3%. In total, 14.6% of the inconsistencies were explained by misclassification, whereas 25.1% were explained by spatial displacement. The average pairwise area inconsistence (removing the effect of spatial displacement), which is the main concern for area frame surveys such as AR18X18, was therefore only 14.6%. For statistical purposes, this uncertainty is very low. Furthermore, the fieldworkers involved in the study by Ullerud et al. (Citation2018) were not harmonized to the same extent as the permanent staff involved in AR18X18, and therefore the expected uncertainty in AR18X18 was probably lower.
Applications in research, management, and monitoring
The presented land cover data have a number of potential applications. Several application topics are foreseen: environmental and agricultural management, wall-to-wall mapping, climate research, and monitoring of landscape and vegetation changes.
The most direct application of the area frame survey data is to improve environmental and agricultural management of land areas and resources. Stratified to specific administrative regions, the data would provide knowledge of, for example, available grazing resources for livestock (and wild herbivores) in the outfields (Strand & Aune-Lundberg Citation2012; Mysterud et al. Citation2014; Bjørklund et al. Citation2017), the vegetation composition within nature conservation areas of Norway (Bryn et al. Citation2014), or the effects of vegetation cover on tick-borne diseases (Vanwambeke et al. Citation2016).
The gridded distribution and spatially unbiased PSU information means the survey was well suited as a basis for generating training data for two related modelling approaches with the aim of providing wall-to-wall results. Both remote sensing (RS) of land cover and distribution modelling (DM) of vegetation types are currently constrained by the lack of well distributed, spatially precise, and extensive field data. The sampling design of the AR18X18 survey is well suited for verification of wall-to-wall products rolled out by the Copernicus land monitoring service and the results of the survey are well suited as reference data in the production of CORINEFootnote4 Land Cover for Norway (Aune-Lundberg Citation2011).
Plot studies have revealed that topographic variables have high ability to predict the distribution of vegetation types (Oddershede et al. Citation2015). Recent tests with DM techniques, emphasizing topographic variables such as curvature and slope, have shown promising results (Hemsing & Bryn Citation2012; Ullerud et al. Citation2016). However, whether the area survey can be implemented for large-scale DM of vegetation types is still unclear.
In climate research, the impact of atmospheric–vegetation–soil feedback has received increasing attention (Bonan Citation2016). High-latitude regions have been in particular focus because of the expected arctic amplification (Pithan & Mauritsen Citation2014). These regions, including Norway, have a huge potential for future forest and shrub expansion into alpine and arctic regions (Bryn et al. Citation2013; Hofgaard et al. Citation2013). Such changes would have a profound effect on the surface energy budget (de Wit et al. Citation2014; Rydsaa et al. Citation2017). Both static and dynamic vegetation–climate models are currently constrained by a lack of extensive field-validated vegetation data.
The combined effects of climate changes and land use changes have resulted in profound vegetation transitions in all regions of Norway (e.g. Fjellstad & Dramstad Citation1999; Moen et al. Citation2006; Potthoff Citation2017). The mapping system implemented in the presented area frame survey has been shown to capture vegetation-type transitions appearing within recent decades (Bryn & Hemsing Citation2012). The systematic sampling approach can serve as a baseline for landscape change studies, as shown by Kaim et al. (Citation2016). Repeated fieldwork, preferably in combination with 3D aerial photo interpretation (Ihse Citation2007), should therefore enable long-term monitoring of landscape and vegetation changes. Since the implemented mapping system is closely related to the mapping systems used in other Nordic countries (e.g. Andersson Citation2010; Gudjonsson Citation2010), monitoring efforts, as well as statistical reports, could be coordinated and harmonized within the Nordic region. However, to our knowledge, Norway is the only country to have implemented wall-to-wall mapping of the entire PSU as a part of the LUCAS survey (Strand Citation2013).
Conclusions
The presented area frame survey documented new land cover statistics with a more detailed classification system and higher certainty than previously provided for Norway. Compared with previous data covering the entire area of Norway, the cover of wetlands has been underestimated, while the reported cover of, for example, forest has been supported. The uncertainty relating to the results of the survey has been analysed and discussed, and is reportedly low for wetlands. The results of the survey can be used as field validation data for RS and modelling, for climate research, for monitoring purposes, and for improved environmental and resource management.
Supplemental Material
Download MS Word (17.9 KB)Supplemental Material
Download MS Word (18.5 KB)Supplemental Material
Download MS Word (23 KB)Notes
1. Outfields refer to areas outside enclosed farmland. Outfields have not been improved by fertilization, ploughing, or sowing, and do not include built-up areas.
2. Ten additional points, called Secondary Statistical Units (SSUs), located inside each PSU, were visited during the AR18X18 survey and more detailed observations were registered in a c.7 m2 plot around each SSU and along a transect through the five northernmost SSUs of each PSU (for the distribution of SSUs within each PSU, see Strand Citation2013, 25). The SSU results will be reported in a separate article.
3. In AR18X18, forest is defined by trees above 2.5 m tall and a crown cover above 25% (Rekdal & Larsson Citation2005).
4. CORINE is the abbreviated name of the European programme Coordination of Information on the Environment, initiated in 1985 by the European Commission.
Related Research Data
References
- Aas, B. & Faarlund, T. 1995. Forest limit development in Norway, with special regard to the 20th century. AmS-Varia 24, 89–100.
- Ahlstrøm, A., Bjørkelo, K. & Frydenlund, J. 2014. AR5 klassifikasjonssyste: Klassifikasjon av Arealressurser. Rapport 6. Ås: Norsk institutt for skog og landskap.
- Alexander, R. & Millington, A.C. (eds.) 2000. Vegetation Mapping. Chichester: John Wiley & Sons.
- Almås, R., Gjerdåker, B., Lunden, K., Myhre, B. & Øye, I. 2004. Norwegian Agricultural History. Trondheim: Tapir Academic Press.
- Andersson, L. 2010. Geographical vegetation data of Lantmäteriet in Sweden. Bryn, A., Dramstad, W. & Fjellstad, W. (eds.) Mapping and Monitoring of Nordic Vegetation and Landscapes, 9–12. Viten 1. Ås: Norsk institutt for skog og landskap.
- Aune-Lundberg, L. 2011. Nøyaktighet og innhold i de norske CORINE Land Cover 2006 klassene. Kart & Plan 71, 219–223.
- Aune-Lundberg, L. & Strand, G.-H. 2014. Comparison of variance estimation methods for use with two-dimensional systematic sampling of land use/land cover data. Environmental Modelling & Software 61, 87–97. doi: 10.1016/j.envsoft.2014.07.001
- Aune-Lundberg, L. & Strand, G.-H. 2017. Composition and spatial structure of dwarf shrub heath in Norway. Norsk Geografisk Tidsskrift–Norwegian Journal of Geography 71, 1–11. doi: 10.1080/00291951.2017.1291536
- Bakkestuen, V., Erikstad, L. & Halvorsen, R. 2008. Step-less models for regional environmental variation in Norway. Journal of Biogeography 35, 1906–1922. doi: 10.1111/j.1365-2699.2008.01941.x
- Bartholomé, E. & Belward, A.S. 2005. GLC2000: A new approach to global land cover mapping from Earth observation data. International Journal of Remote Sensing 26, 1959–1977. doi: 10.1080/01431160412331291297
- Benjaminsen, T.A., Reinert, H., Sjaastad, E. & Sara, M.N. 2015. Misreading the Arctic landscape: A political ecology of reindeer, carrying capacities, and overstocking in Finnmark, Norway. Norsk Geografisk Tidsskrift–Norwegian Journal of Geography 69, 219–229. doi: 10.1080/00291951.2015.1031274
- Biondi, E., Feoli, E. & Zuccarello, V. 2004. Modelling environmental responses of plant associations: A review of some critical concepts in vegetation study. Critical Reviews in Plant Sciences 23, 149–156. doi: 10.1080/07352680490433277
- Bjørklund, P., Rekdal, Y. & Strand, G.-H. 2017. Arealregnskap i Utmark: Arealstatistikk for Nordland. NIBIO rapport 106. Ås: Norsk institutt for bioøkonomi.
- Bjune, A.E. 2005. Holocene vegetation history and tree-line changes on a north-south transect crossing major climate gradients in southern Norway – evidence from pollen and plant macrofossils in lake sediments. Review of Palaeobotany and Palynology 133, 249–275. doi: 10.1016/j.revpalbo.2004.10.005
- Bonan, G. 2016. Ecological Climatology: Concepts and Applications. 3rd ed. Cambridge: Cambridge University Press.
- Bontemps, S., Herold, M., Kooistra, L., van Groenestijn, A., Hartley, A., Arino, O., Moreau, I. & Defourny, P. 2012. Revisiting land cover observation to address the needs of the climate modeling community. Biogeosciences 9, 2145–2157. doi: 10.5194/bg-9-2145-2012
- Brus, D.J. & Saby, N.P.A. 2016. Approximating the variance of estimated means for systematic random sampling, illustrated with data of the French Soil Monitoring Network. Geoderma 279, 77–86. doi: 10.1016/j.geoderma.2016.05.016
- Bryn, A. 2006. A scenario for vegetation changes in a Norwegian mountain district: The combined effect of regrowth and climate change. Geographia Polonica 79, 41–64.
- Bryn, A. & Daugstad, K. 2001. Summer farming in the subalpine birch forest. Wielgolaski, F.E. (ed.) Nordic Mountain Birch Ecosystem, 307–315. UNESCO Man and Biosphere Series 27. New York: Parthenon.
- Bryn, A. & Hemsing, L.Ø. 2012. Impacts of land use on the vegetation in three rural landscapes of Norway. International Journal of Biodiversity Science, Ecosystem Services & Management 8, 360–371. doi: 10.1080/21513732.2012.737373
- Bryn, A., Dourojeanni, P., Hemsing, L.Ø. & O’Donnel, S. 2013. A high-resolution GIS null model of potential forest expansion following land use changes in Norway. Scandinavian Journal of Forest Research 28, 81–98. doi: 10.1080/02827581.2012.689005
- Bryn, A., Angeloff, M. & Rønningen, K. 2014. Norske verneområder: kulturpåvirkning, avskoging og gjengroing. Kart & Plan 74, 210–222.
- Bryn, A., Kristoffersen, H.P., Angeloff, M., Nystuen, I., Aune-Lundberg, L., Endresen, D., Svindseth, C. & Rekdal, Y. 2015. Location of plant species in Norway gathered as a part of a survey vegetation mapping programme. Data in Brief 5, 589–594. doi: 10.1016/j.dib.2015.10.014
- Cherrill, A. 2013. Repeatability of vegetation mapping using Phase 1 and NVC approaches: Implications for professional practice and surveyors’ training requirements. In Practice 81, 41–45.
- Cherrill, A. 2016. Inter-observer variation in habitat survey data: Investigating the consequences for professional practice. Journal of Environmental Planning and Management 59, 1–20. doi: 10.1080/09640568.2015.1090961
- Cherrill, A. & McClean, C. 1995. An investigation of uncertainty in field habitat mapping and the implications for detecting land cover change. Landscape Ecology 10, 5–21. doi: 10.1007/BF00158550
- Cherrill, A. & McClean, C. 1999. Between-observer variation in the application of a standard method of habitat mapping by environmental consultants in the UK. Journal of Applied Ecology 36, 989–1008. doi: 10.1046/j.1365-2664.1999.00458.x
- Cressie, N.A.C. 1991. Statistics for Spatial Data. New York: John Wiley & Sons.
- de Wit, H., Bryn, A., Hofgaard, A., Karstensen, J., Kvalevåg, M. & Peters, G. 2014. Climate warming feedback from mountain birch forest expansion: Reduced albedo dominates carbon uptake. Global Change Biology 20, 2344–2355. doi: 10.1111/gcb.12483
- Diamond, J. 2002. Evolution, consequences and future of plant and animal domestication. Nature 418, 700–707. doi: 10.1038/nature01019
- DN 2007. Kartlegging av Naturtyper. 2 utgave. DN-Håndbok 13. Trondheim: Direktoratet for naturforvaltning.
- Dramstad, W., Fjellstad, W.J., Strand, G.-H., Mathiesen, H.F., Engan, G. & Stokland, J. 2002. Development and implementation of the Norwegian monitoring programme for agricultural landscapes. Journal of Environmental Management 64, 49–63. doi: 10.1006/jema.2001.0503
- Emanuelsson, U. 2009. The Rural Landscapes of Europe – How Man Has Shaped European Nature. Stockholm: Forskningsrådet Formas.
- Erikstad, L., Bakkestuen, V., Hanssen, F., Evju, M., Stabbetorp, O.E. & Aarrestad, P.A. 2009. Evaluering av Landsdekkende Satellittbasert Vegetasjonskart. NINA-rapport 448. Oslo: Norsk institutt for naturforskning.
- Eurostat. 2003. The Lucas Survey: European Statisticians Monitor Territory. Luxembourg: Office for Official Publications of the European Communities.
- Fjellstad, W.J. & Dramstad, W.E. 1999. Patterns of change in two contrasting Norwegian agricultural landscapes. Landscape and Urban Planning 45, 177–191. doi: 10.1016/S0169-2046(99)00055-9
- Foody, G.M. 2002. Status of land cover classification accuracy assessment. Remote Sensing of Environment 80, 185–201. doi: 10.1016/S0034-4257(01)00295-4
- Friedl, M.A., Sulla-Menashe, D., Tan, B., Schneider, A., Ramankutty, N., Sibley, A. & Huang, X. 2010. MODIS Collection 5 global land cover: Algorithm refinements and characterization of new datasets. Remote Sensing of Environment 114, 168–182. doi: 10.1016/j.rse.2009.08.016
- Giri, C., Pengra, B., Long, J. & Loveland, T.R. 2013. Next generation of global land cover characterization, mapping, and monitoring. International Journal of Applied Earth Observation and Geoinformation 25, 30–37. doi: 10.1016/j.jag.2013.03.005
- Gjelsvik, E., Grendahl, T., Løddesøl, A. & Opsahl, W. 1945. Innstilling fra Utmarkskomiteen. Oslo: Grøndahl & Søns Boktrykkeri.
- Grønlund, A., Bjørkelo, K., Hylen, G. & Tomter, S. 2010. CO2-opptak i Jord og Vegetasjon i Norge: Lagring, opptak og utslipp av CO2 og andre klimagasser. Rapport 162. Ås: Bioforsk.
- Gudjonsson, G. 2010. Large-scale vegetation mapping in Iceland. Bryn, A., Dramstad, W. & Fjellstad, W. (eds.) Mapping and Monitoring of Nordic Vegetation and Landscapes, 51–54. Viten 1. Ås: Norsk institutt for skog og landskap.
- Haining, R.P., Kerry, R. & Oliver, M.A. 2010. Geography, spatial data analysis and geostatistics: An overview. Geographical Analysis 42, 7–31. doi: 10.1111/j.1538-4632.2009.00780.x
- Hearn, S.M., Healey, J.R., McDonald, M.A., Turner, A.J., Wong, J.L.G. & Stewart, G.B. 2011. The repeatability of vegetation classification and mapping. Journal of Environmental Management 92, 1174–1184. doi: 10.1016/j.jenvman.2010.11.021
- Hemsing, L.Ø. & Bryn, A. 2012. Three methods for modelling potential natural vegetation (PNV) compared: A methodological case study from south-central Norway. Norsk Geografisk Tidsskrift–Norwegian Journal of Geography 66, 11–29. doi: 10.1080/00291951.2011.644321
- Hertel, T., Steinbuks, J. & Baldos, U. 2013. Competition for land in the global bioeconomy. Agricultural Economics 44, 129–138. doi: 10.1111/agec.12057
- Hofgaard, A., Tømmervik, H., Rees, G. & Hanssen, F. 2013. Latitudinal forest advance in northernmost Norway since the early 20th century. Journal of Biogeography 40, 938–949. doi: 10.1111/jbi.12053
- Hussain, M., Chen, D., Cheng, A., Wei, H. & Stanley, D. 2013. Change detection from remotely sensed images: From pixel-based to object-based approaches. ISPRS Journal of Photogrammetry and Remote Sensing 80, 91–106. doi: 10.1016/j.isprsjprs.2013.03.006
- Ihse, M. 2007. Colour infrared aerial photography as a tool for vegetation mapping and change detection in environmental studies of Nordic ecosystems: A review. Norsk Geografisk Tidsskrift–Norwegian Journal of Geography 61, 170–191. doi: 10.1080/00291950701709317
- Johansen, A. 1997. Myrarealer og Torvressurser i Norge. Jordforsk Rapport 1. Ås: Jordforsk.
- Joosten, H., Barthelmes, A., Couwenberg, J., Hassel, K., Moen, A., Tegetmeyer, C. & Lyngstad, A. 2015. Metoder for å Beregne Endring i Klimagassutslipp ved Restaurering av Myr. Naturhistorisk Rapport 10. Trondheim: NTNU Vitenskapsmuseet.
- Joosten, H., Tanneberger, F. & Moen, A. (eds.) 2017. Mires and Peatlands of Europe: Status, Distribution and Conservation. Stuttgart: Schweizerbart Science.
- Kaim, D., Kozak, J., Kolecka, N., Ziółkowska, E., Ostafin, K., Ostapowicz, K., Gimmi, U., Munteanu, C. & Radeloff, V.C. 2016. Broad scale forest cover reconstruction from historical topographic maps. Applied Geography 67, 39–48. doi: 10.1016/j.apgeog.2015.12.003
- Løddesøl, A. 1948. Myrene i Næringslivets Tjeneste. Oslo: Grøndahl & Søns.
- Mayaux, P., Bartholome, E., Fritz, S. & Belward, A. 2004. A new land-cover map of Africa for the year 2000. Journal of Biogeography 31, 861–877. doi: 10.1111/j.1365-2699.2004.01073.x
- Mellino, S. & Ulgiati, S. 2015. Monitoring regional land use and land cover changes in support of an environmentally sound resource management. Filho, W.L., Úbelis, A. & Bērziņa, D. (eds.) Sustainable Development, Knowledge Society and Smart Future Manufacturing Technologies, 309–321. Berlin: Springer International.
- Moen, A. 1999. Vegetation: National Atlas of Norway. Hønefoss: Norwegian Mapping Authority.
- Moen, A. & Øien, D.I. 2011. Våtmarkssystemer. Lindgaard, A. & Henriksen, S. (eds.) Norsk Rødliste for Naturtyper 2011, 75–79. Trondheim: Artsdatabanken.
- Moen, A., Skogen, A., Vorren, K.-D. & Økland, R.H. 2001. Myrvegetasjon. Fremstad, E. & Moen, A. (eds.) Truete Vegetasjonstyper i Norge, 105–124. Rapport Botanisk Serie 4. Trondheim: NTNU Vitenskapsmuseet.
- Moen, A., Nilsen, L.S., Aasmundsen, A. & Oterholm, A.I. 2006. Woodland regeneration in a coastal heathland area in central Norway. Norsk Geografisk Tidsskrift–Norwegian Journal of Geography 60, 277–294. doi: 10.1080/00291950601047941
- Moen, A., Lyngstad, A. & Øien, D.-I. 2017. Norway. Joosten, H., Tanneberger, F. & Moen, A. (eds.) Mires and Peatlands of Europe: Status, Distribution and Conservation, 536–548. Stuttgart: Schweizerbart Science.
- Mork, E. & Heiberg, H.H. 1937. Om vegetasjonen i Hirkjølen forsøksområde. Meddelelser fra det Norske Skogforsøksvesen 19, 617–668.
- Mulvihill, P.R. & Ali, S.H. 2017. Environmental Management: Critical Thinking and Emerging Practices. New York: Routledge.
- Mysterud, A., Rekdal, Y., Loe, L.E., Angeloff, M., Mobæk, R., Holand, Ø. & Strand, G.-H. 2014. Evaluation of landscape level grazing capacity for domestic sheep in alpine rangelands. Rangeland Ecology & Management 67, 132–144. doi: 10.2111/REM-D-12-00177.1
- NGU. n.d. Løsmasser – Nasjnal løsmassedatabase. http://geo.ngu.no/kart/losmasse_mobil/ (accessed 8 January 2018).
- NIBIO. 2016. Arealressursstatistikk: Norge. http://kart2.skogoglandskap.no/xml_filer/2016/Norge_arstat_2016.xml (accessed 16 October 2017).
- Norderhaug, A. & Johansen, L. 2010. Semi-natural sites and boreal heats. Lindgaard, A. & Henriksen, S. (eds.) The 2011 Norwegian Red List for Ecosystems and Habitat Types, 87–93. Trondheim: Norwegian Biodiversity Information Centre.
- NOU 1972: 44. Regionalstatistikk: Om statistikkbehovet i Regional Planlegging. Miljøverndepartementet. Oslo: Universitetsforlaget.
- Oddershede, A., Svenning, J.-C. & Damgaard, C. 2015. Topographically determined water availability shapes functional patterns of plant communities within and across habitat types. Plant Ecology 216, 1231–1242. doi: 10.1007/s11258-015-0504-6
- Pedrotti, F. 2013. Plant and Vegetation Mapping. Heidelberg: Springer Verlag.
- Pithan, F. & Mauritsen, T. 2014. Arctic amplification dominated by temperature feedbacks in contemporary climate models. Nature Geoscience 7, 181–184. doi: 10.1038/ngeo2071
- Potthoff, K. 2017. Spatio-temporal patterns of birch regrowth in a Western Norwegian treeline ecotone. Landscape Research 42, 63–77. doi: 10.1080/01426397.2016.1260701
- Puschmann, O. 2005. Nasjonalt Referansesystem for Landskap: Beskrivelse av Norges 45 Landskapsregioner. Rapport 10. Ås: Norsk institutt for jord- og skogkartlegging.
- Ramberg, I.B., Bryhni, I. & Nøttvedt, A. 2007. The Making of a Land: Geology of Norway. Trondheim: Geological Society of Norway.
- Rekdal, Y. & Larsson, J.Y. 2005. Veiledning i Vegetasjonskartlegging. NIJOS rapport 01/05. Ås: Norsk institutt for jord og skogkartlegging.
- Rekdal, Y. & Strand, G.-H. 2005. Arealrekneskap for Norge. Fjellet i Hedmark. NIJOS rapport 06/05. Ås: Norsk institutt for jord og skogkartlegging.
- Rekdal, Y. & Bryn, A. 2010. Mapping of vegetation in Norway. Bryn, A., Dramstad, W. & Fjellstad, W. (eds.) Mapping and Monitoring of Nordic Vegetation and Landscapes, 93–96. Viten 1. Ås: Norsk institutt for skog og landskap.
- Rogstad, L., Schøning, P., Dysterud, M.V. & Homstvedt, S. 1997. Arealstatistikk i Norge: Resultater fra en Brukerundersøkelse. Notater fra Statistisk sentralbyrå 97/27. Oslo: Statistisk sentralbyrå.
- Ross, L.C., Austrheim, G., Asheim, L.J., Bjarnason, G., Feilberg, J., Fosaa, A.M., Hester, A.J., Holand, Ø., Jónsdóttir, I.S., Mortensen, L.E., Mysterud, A., Olsen, E., Skonhoft, A., Speed, J.D.M., Steinheim, G., Thompson, D.B.A. & Thórhallsdóttir, A.G. 2016. Sheep grazing in the North Atlantic region: A long-term perspective on environmental sustainability. Ambio 45, 551–566. doi: 10.1007/s13280-016-0771-z
- Rusch, G.M. 2012. Klima og økosystemtjenester: Norske økosystemers potensial for avbøting av og tilpasning til klimaendringer. NINA Rapport 792. Trondheim: Norsk institutt for naturforskning.
- Rydsaa, J.H., Stordal, F., Bryn, A. & Tallaksen, L.M. 2017. Effects of shrub and tree cover increase on the near-surface atmosphere in northern Fennoscandia. Biogeosciences 14, 4209–4227. doi: 10.5194/bg-14-4209-2017
- Selkowitz, D.J. & Stehman, S.V. 2011. Thematic accuracy of the National Land Cover Database (NLCD) 2001 land cover for Alaska. Remote Sensing of Environment 115, 1401–1407. doi: 10.1016/j.rse.2011.01.020
- Skre, O. 2017. Ecosystem services in Norway. One Ecosystem 2, e14814. doi: 10.3897/oneeco.2.e14814
- Statens kartverk. 2014. Produktspesifikasjon N50 Kartdata: Versjon September 2014. Hønefoss: Statens kartverk.
- Statistisk Sentralbyrå. 2017. Arealbruk og arealressurser. https://www.ssb.no/natur-og-miljo/statistikker/arealstat/aar (accessed 8 January 2018).
- Strand, G.-H. 2013. The Norwegian area frame survey of land cover and outfield land resources. Norsk Geografisk Tidsskrift–Norwegian Journal of Geography 67, 24–35. doi: 10.1080/00291951.2012.760001
- Strand, G.-H. 2017. A study of variance estimation methods for systematic spatial sampling. Spatial Statistics 21, 226–240. doi: 10.1016/j.spasta.2017.06.008
- Strand, G.-H. & Moum, S.O. 2000. Compilation and evaluation of a small-scale land resource map. Norsk Geografisk Tidsskrift–Norwegian Journal of Geography 54, 148–156. doi: 10.1080/002919500448521
- Strand, G.-H. & Aune-Lundberg, L. 2012. Small-area estimation of land cover statistics by post-stratification of a national area frame survey. Applied Geography 32, 546–555. doi: 10.1016/j.apgeog.2011.06.006
- Straume, K. 2013. Monitoring Norwegian farmland loss through periodically updated land cover map data. Norsk Geografisk Tidsskrift–Norwegian Journal of Geography 67, 36–48. doi: 10.1080/00291951.2012.759616
- Thompson, S.K. 2002. Sampling. 2nd ed. New York: John Wiley & Sons.
- Tomter, S.M., Hylen, G. & Nilsen, J.E. 2010. Norway. Tomppo, E., Gschwanter, T., Lawrence, M. & McRoberts, R. (eds.) National Forest Inventories: Pathways for Common Reporting, 411–424. Berlin: Springer Verlag.
- Tomter, S.M. 2014. Skogareal. Tomter, S.M. & Dalen, L.S. (eds.) Bærekraftig Skogbruk i Norge, 43–47. Ås: Norsk institutt for skog og landskap.
- Ullerud, H.A., Bryn, A. & Klanderud, K. 2016. Distribution modelling performance of vegetation types in the boreal-alpine ecotone. Applied Vegetation Science 19, 528–540. doi: 10.1111/avsc.12236
- Ullerud, H.A., Bryn, A., Halvorsen, R. & Hemsing, L.Ø. 2018. Consistency of land cover mapping: Influence of fieldworkers, spatial scale and classification system. Applied Vegetation Science. https://doi.org/10.1111/avsc.12368 (accessed April 2018).
- Vanwambeke, S.O., Artois, J., Davidson, R.K., Meyfroidt, P. & Jore, S. 2016. Forest classes and tree cover gradient: Tick habitat in encroached areas of southern Norway. Experimental and Applied Acarology 68, 375–385. doi: 10.1007/s10493-015-0007-0
- Wang, K., Franklin, S.E., Guo, X., He, Y. & McDermid, G.J. 2009. Problems in remote sensing of landscapes and habitats. Progress in Physical Geography 33, 747–768. doi: 10.1177/0309133309350121
- Wickham, J.D., Stehman, S.V., Gass, L., Dewitz, J., Fry, J.A. & Wade, T.G. 2013. Accuracy assessment of NLCD 2006 land cover and impervious surface. Remote Sensing of Environment 130, 294–304. doi: 10.1016/j.rse.2012.12.001