
ABSTRACT
Christopher Hansteen, professor of applied mathematics at the University of Oslo, was appointed as a part-time director of geodesy at the Geographical Survey of Norway in 1817. He quickly realized that previous measurements of angles using geographical circles did not produce data of required quality for geodetic surveying. Using archival sources, the article describes how Hansteen acquired a theodolite from Germany and applied it to demonstrate to the National Assembly (Storting) that investment in new instruments for the Survey was required. With funds granted in 1824, he ordered theodolites, sextants and chronometers from German instrument makers. He conducted a field operation in 1827 in preparation for a first-time survey and mapping of the entire coast of Northern Norway. The article draws on observation logbooks to reconstruct the triangle arc established with the new theodolites between 1828 and 1842. The triangulation stations served as reference points for plane table mapping. Map orientation and geodetic coordinates were controlled by astronomical observations of latitude and chronometer determinations of longitude at two temporary observatories and through selected field observations. The resulting ten maps were the first production released to the public by the Geographical Survey of Norway.
Introduction
After the first university in Norway had been established in 1811, Christopher Hansteen became its professor of applied mathematics in 1816. Among his duties were lecturing in astronomy as well as computing and editing the official Almanac for Norway, for which the university had exclusive publication privileges. He also taught related sciences to the senior cadets of the Military Academy, the only institution in the early 1800s with a curriculum that included surveying (Collett Citation2011, 195, 205). His expertise in a young nation, with a recently established constitution, led to a part-time appointment as director of geodesy in the Geographical Survey of NorwayFootnote1 (Geelmuyden Citation1884). He was the only civilian in a military organization led by the commanding officer of the Army Corps of Engineers. The initial tasks of the Geographical Survey of Norway, founded in 1773 as a military unit, were to establish the formal boundaries of the nation, survey and map potential war theaters, and provide geographical information for the planning of fortresses, logistic schemes and other defense infrastructure (Harsson & Aanrud Citation2016). The Survey gradually developed to meet civilian challenges, including first-time surveying and mapping of large areas of Norway (de Seue Citation1878).
The field surveyors were young officers with contracts for observational work during a few summer months. Computations and map drawing were done during the winter. Very few military surveyors had permanent appointments. Their formal training had been obtained during their senior years at the Military Academy, many with Christopher Hansteen as lecturer and examiner. Thus, he was able to select among the most motivated and talented cadets when he recruited young officers for appointments at the Geographical Survey of Norway (Harsson & Aanrud Citation2016).
When Hansteen was appointed director of geodesy in 1817, he gained access to all previous observations and surveying results produced with geographical circles of the Borda type. He concluded that their precision was not up to date and that new technology was required. Instrument makers in Germany had developed circle-dividing machines that allowed more accurate angle measurement (Pettersen Citation2002). Such circles were fitted with telescopes to read the azimuth and elevation of their pointing direction (Kost Citation2015, 33). Theodolites and universal instruments were thus available for performing observations in a topocentric altitude-azimuth reference system rather than angle determinations in a plane connecting three corners of a triangle, as was the approach with the geographical circles. In a letter to astronomer Heinrich Christian Schumacher in 1821,Footnote2 Hansteen wrote that he expected significant improvements with the new technology but the waiting lists for acquiring such instruments were long and the payment was required in foreign currency, which was not abundant in young Norway due to the country’s limited exports to the European continent. In this article, I draw on previous little-used source material to document how Hansteen acquired and demonstrated his first theodolite, as well as how he went on to use theodolites to conduct the first triangulation survey of the coast of Northern Norway.
Source material
The primary source material for this article is a set of logbooks of observations and the correspondence between Hansteen, fellow scientists, instrument makers, and military surveyors (see Appendix 1 for details). These handwritten documents are kept in archives at the Norwegian Mapping Authority, the Observatory of the University of Oslo, and Staatsbibliothek zu Berlin, Germany. The material has allowed me to reconstruct the history of how theodolites were introduced into the mapping of Norway. The material has been supplemented by Hansteen’s published results (in Norwegian), after he had first tested the theodolite in a field project. The observation logbooks reveal a major effort of surveying, astronomical positioning and hydrography over more than a decade by military surveyors under the auspices of the Geographical Survey of Norway. The logbooks identify the field observers. Project leadership was based on the technological and scientific expertise of Hansteen. He defined the approach and strategy, he acquired the instruments, and he selected and trained the personnel.
The first theodolite
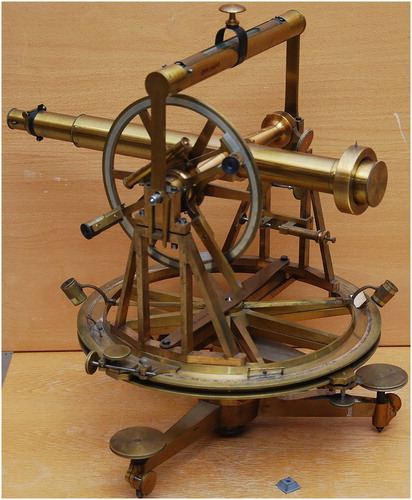
Christopher Hansteen contacted Heinrich Christian Schumacher, professor of astronomy in Copenhagen, in 1816 to obtain advice on the quality of instruments from foreign instrument makers. The university in Christiania (present-day Oslo) had recently established a temporary observatory and required new and improved instruments (Pettersen Citation2002). Schumacher recommended the instrument makers Reichenbach and Ertel in Munich. Hansteen requested Schumacher’s assistance in obtaining an astronomical theodolite. After a visit to Munich in late 1817, Schumacher informed Hansteen that Reichenbach and Ertel had agreed to produce a theodolite with a circle diameter of 30 cm, to be delivered in the summer of 1818. Following a series of delays, it finally reached Schumacher in November 1822. He tested and compared it with other instruments before sending it to Hansteen in Christiania ().
Fig. 1. Theodolite by Georg Reichenbach and Traugott Ertel in München, acquired by Hansteen in 1822 with university funding and used for the demonstration project in Christiania; the 30 cm horizontal circle is divided into 5 arcminutes and may be read using verniers to 4 arcseconds; the 19 cm vertical circle was added in 1899 (Courtesy of the Museum of the Norwegian Mapping Authority)
The demonstration project
During the summer of 1823, Hansteen (Citation1824c) established a short baseline (260.148 m; short thick line on map, ) in the fields southwest of his family residence. An expanded triangle side in the perpendicular direction was determined by measuring angles with the theodolite. A number of monumental buildings and signal stations were then observed.
Fig. 2. Hansteen’s map of Christiania (Oslo) and environs (Omegn af Christiania) showing baselines and geodetic stations; two thick lines identify the baselines on land and on the frozen Christiania Fjord; size of original 27 × 22 cm; scale 1:25000 (Source: Hansteen Citation1824c)
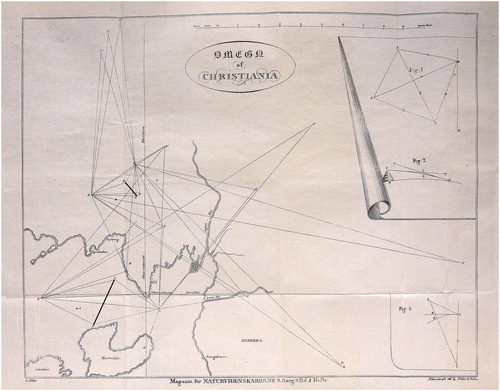
In the following winter, low temperatures caused a thick surface layer of ice to form on Christiania Fjord (Oslofjorden). Hansteen (Citation1824b) arranged for a longer baseline to be measured on the ice. Four officers attached to the Geographical Survey of Norway and the Army Corps of Engineers used pine rods that were 5 m in length to measure a baseline (760.277 m; long thick line on map, ), just west of the university observatory. Two measurements gave a length difference of 2 mm. An extended triangle side in the perpendicular direction was determined by repeatedly measuring angles with the theodolite. The endpoints of the triangle side were also observed with a Reichenbach universal instrument from the nearby observatory. The weather was not favorable, but the triangles closed at 180° with deviations of 4–7 arcseconds. A number of geodetic stations were then observed with the theodolite. Some of the stations were again measured from the shorter baseline in the following summer, in order to connect all of the data in the same reference frame.
Calibrating the baseline lengths
When Norway was separated from Denmark in 1814 at the end of the Napoleonic wars, all references and standards for weights and measures in Copenhagen became inaccessible to Norwegian institutions. Hansteen was appointed by the Norwegian government to a committee tasked with establishing a national system for weights and measures. He proposed that the length unit should be derived from a pendulum, which had a period of exactly one second at sea level at latitude 45°. Lacking his own instrument, he analyzed published observations by French and British scientists, and he derived the Norwegian foot as 0.3137 m (Hansteen Citation1824a). He applied this length definition to calibrate the length of the four pine rods used to establish the baselines. They were placed in a row with the ironclad ends touching each other. At an ambient temperature very close to the freezing point of water, the length was determined as 20.0073 m (Hansteen Citation1824b). The baseline on the frozen Christiania Fjord was 38 rotations of the four rods (i.e., a total of 152 rods = 760.2774 m).
Investigating the precision in the demonstration project
Hansteen (Citation1824b) calculated the length of the short baseline on land, starting with the long baseline on Christiania Fjord and doing the geometry via various combinations of triangles. The result matched the measured length with a root mean square (rms) of ±0.17 m.
Using the vertical circle on the universal instrument made by Reichenbach, Hansteen (Citation1824c) measured zenith distances to several church spires. He corrected for earth curvature and atmospheric refraction to obtain height above sea level. He measured the same church spires from different observing stations and obtained comparable results with an rms of ±0.13 m.
With precise triangular height values at hand for the observation station Ryen (206.22 m a.s.l), ca. 6 km southeast of Oslo city center, Hansteen made repeated measurements of the atmospheric pressure difference between Ryen and sea level with a barometer. His observations were made at different times of day throughout one year. The average height derived by the Laplace formulaFootnote3 was 203.87 ±2.92 m. He concluded that Laplace’s method of barometric height determination worked well at the high latitudes of Norway. Based on this conclusion, Hansteen introduced the method as a standard procedure in the Geographical Survey of Norway, and it was applied in the full-scale test project in 1827 and the coastal mapping in the period 1828–1842.
Introducing theodolites into the Geographical Survey of Norway
In 1824 the National Assembly (Storting) funded the acquisition of new instruments for the planned coastal survey in Northern Norway. Hansteen again asked Schumacher for advice and two theodolites were ordered from the instrument makers Reichenbach and Ertel in Munich. In 1826 optician Joseph Fraunhofer and mechanical engineer Georg Reichenbach died within months of each other and Traugott Ertel took over the company. Schumacher traveled to Munich to make reservations for future instrument orders based on the available Fraunhofer lenses, and he reported to Hansteen that the theodolites were about to leave the workshops. One instrument arrived and was tested by Schumacher at the end of the year before it was shipped to Hansteen in the spring of 1827 after the sea ice had melted in the Christiania Fjord. However, it arrived badly damaged and needed mechanical repair.
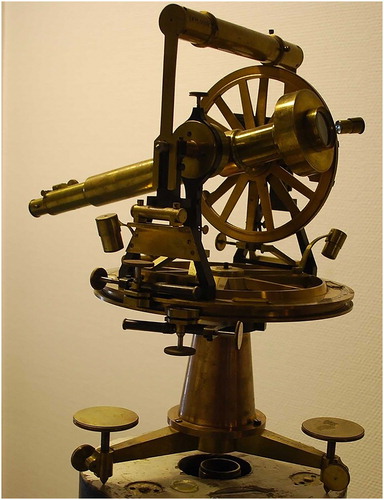
The second theodolite () left Munich on January 26, 1827 and arrived in Christiania in good condition one month later. The horizontal circle allowed reading angles to 10 arcseconds using 4 verniers. Vertical circles were added later. During observations, each angle measurement was repeated four to five times. These instruments were the first theodolites acquired for the Geographical Survey of Norway and served for several decades.
Fig. 3. Theodolite by Ertel, acquired by the Geographical Survey of Norway in 1827 for the coastal survey; the 20 cm horizontal circle is divided into 10 arcminutes and may be read using verniers to 10 arcseconds; the 16 cm vertical circle was added in 1873 (Courtesy of the Museum of the Norwegian Mapping Authority)
A full-scale field project to test new instruments
The 1824–1827 budget of the Geographical Survey of Norway allowed a full-scale surveying project to be carried out in the mountains of southern Norway to test the instruments for measuring large triangles. Captain Theodor Broch established a longitudinal arc between the lakes Femunden (150 km south-southeast of Trondheim) and Bygdin (210 km south-southwest of Trondheim) with an Ertel theodolite. He climbed the highest mountains in the region (many approaching 2000 m a.s.l.) to establish geodetic stations well above the forest line. This allowed triangle sides of tens of kilometers. Heights were determined by Mercury barometers. The starting point was the mountains of Gråhøgda and Elgpiggen, respectively 35 km and 25 km west of the lake Femunden; the linear distance between the two mountains was calculated from earlier triangulations and used as baseline (de Seue Citation1878). Satisfied by the results, Hansteen was ready to survey the coast of Norway from Trondheim to the border of Russia.
The surveying of the coastal regions of Northern Norway
The first proposal to map the coastal regions of Northern Norway had been initiated by Thomas Fasting, Minister of the Navy (Marineminister), and was submitted in 1816 by Benoni Aubert, Director of the Geographical Survey of Norway. After failing to reach the political decision level, the proposal was resubmitted in 1820, having first been revised by Hansteen. He proposed a triangular arc along the coast from Trondheim (63° N, 10° E) to Vardø (70° N, 31° E) to serve as a framework for mapping, supported by astronomical observations at selected sites. Hydrographic data were to be collected near the coast and in fjords leading to safe havens and harbors. Hansteen added a civilian dimension by pointing out that the resulting coastal maps were needed by shipping and fisheries, and that they would provide knowledge about non-mapped areas of Norway, including part of the border region with Russia. The National Assembly rejected funding in 1821, but funded new instruments and initial operation costs in the following three-year budget term beginning in 1824 (de Seue Citation1878, 86–87).
Hansteen’s correspondence reflects that the instruments took time to produce. Field operations in Northern Norway were delayed until the summer of 1828. In addition to the two theodolites (i.e., from Traugott Ertel in Munich), Hansteen also ordered chronometers from Henry Kessels in Altona in Holstein (which arrived in 1825 and 1827) and sextants from Baumann & Kinzelbach in Stuttgart (which arrived in 1826 and 1828).
The project plan for mapping the coastal regions of Northern Norway suggested a 10-year effort at an annual cost of 5000 spesidaler (USD 182,000 today), using a team comprising one surveyor, one plane table mapper and one hydrographer (recruited from the Navy). The latter would supply material for hydrographic descriptions, including topographical profiles as seen from the ocean, to guide sailors into harbors and safe havens. In early May 1828Footnote4 Lieutenants Andreas Vibe and Hans Paludan of the Corps of Engineers and Navy Lieutenant Henrik Stephens Hagerup began triangulation at latitude 63.5° N, starting from the two mountain peaks of Koppern and Jyltingen, respectively 55 km and 65 km northwest of Trondheim (de Seue Citation1878, 111). A previous triangulation suggested that the distance separating them was 18.80 km. The observation logbooks show that the team advanced to latitude 66° N during the first four years. The triangle arc along the coast has been reconstructed from observation logbooks. and show the triangles superimposed on maps of the Norwegian coast produced during the project (i.e., General kart over den norske kyst fra Trondhjems leden til Tromsø (‘General map of the Norwegian coast from Trondheimsleia to Tromsø’) and Kart over den norske kyst fra Tromsø til grændsen mod Russland (‘Map of the Norwegian coast from Tromsø to the border with Russia’)). Detailed plane table mapping and hydrography kept up with triangulation as all three observers undertook plane table mapping in 1830, and excursions were made into Foldenfjord and Namsenfjord (both ca.130 km north of Trondheim, with Foldenfjord to the north of Namsenfjord), where large ships frequently entered to load timber and fish.
Fig. 4. The triangular arc from Trondheim to Tromsø, superimposed on a map (scale 1:750,000) constructed in 1845 from the first six coastal maps published between 1833 and 1842 (Kart over den norske kyst fra Trondhjems leden til Tromsö); the triangulation was carried out by Andreas Vibe 1828–1830, Theodor Broch 1832–1833, and Henrik Stephens Hagerup 1835; longitudes are relative to Ferro and Paris (top), and Greenwich and Christiania (bottom); size of original 70 × 89 cm (Source: https://no.wikipedia.org/wiki/Liste_over_historiske_dokumenter_hos_Statens_kartverks_sjødivisjon (accessed 20 March 2018); original with Sjødivisjonen in Statens kartverk)
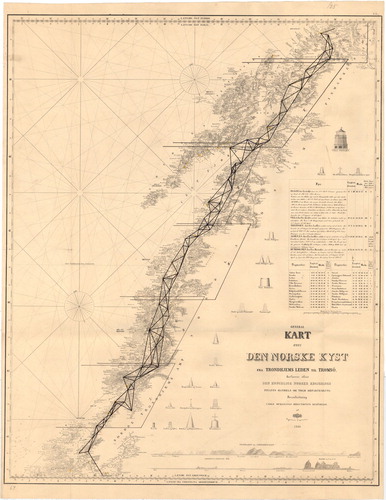
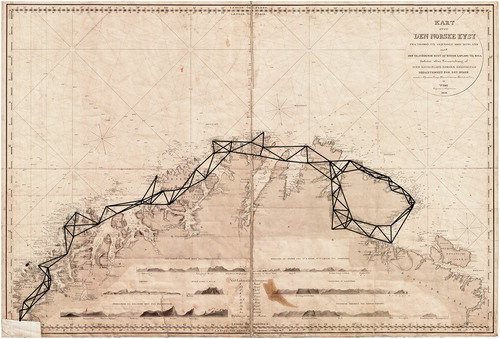
Fig. 5. The triangular arc from Tromsø to Vardø, superimposed on a manuscript map constructed in 1848 from six coastal maps published between 1841 and 1847 (Kart over den norske kyst fra Tromsö til grændsen mod Russland med den tilstödende kyst af russisk Lapland til Kola); the triangulation was carried out by Henrik Stephens Hagerup 1835–1838 and Frederik Klouman 1841; longitudes are given relative to Ferro and Paris (top), and Greenwich and Christiania (bottom); the map sheet also shows topographic profiles of the coast as seen when approaching land from the ocean; original scale not specified; size of original 92 × 62 cm (Source: https://no.wikipedia.org/wiki/Liste_over_historiske_dokumenter_hos_Statens_kartverks_sjødivisjon (accessed 20 March 2018); original with Sjødivisjonen in Statens kartverk)
In 1832 Vibe was transferred from field operations to map construction when Hansteen was appointed director of the Geographical Survey of Norway, following the death of Aubert. Vibe also took over a number of administrative duties in the Survey, since Hansteen continued full-time as professor. During the summer of 1833, Vibe and Hansteen made astronomical observations in Trondheim to improve the azimuth direction of the initial triangle side Koppern–Jyltingen. Compared with earlier data obtained with geographical circles, they recorded deviations of a few arcminutes.
Vibe was replaced in the field by Captain Theodor Broch of the Corps of Engineers. In 1833 Navy Lieutenant Christian Due replaced Hagerup, while Lieutenant Mentz Rynning replaced Paludan (de Seue Citation1878, 112). The surveying and mapping advanced to latitude 68.5° N. The budget was increased to 6000 spesidaler (USD 218,000 today) per year for the next decade.
In 1834 Broch established a meridian arc from the newly inaugurated astronomical observatory in Christiania to the cathedral in Trondheim. It was extended in 1837 to connect to the coastal triangle arc at Koppern–Jyltingen. The orientation of the Christiania–Trondheim arc was determined by the azimuth angle of the triangle side Observatory–Kolsås, measured by Hansteen. The following winter Broch measured a baseline on the frozen Christiania Fjord (3103.567 m)Footnote5 to replace all previous baselines. These efforts ensured an accurate length scale for the calculations and connected the triangular arc in Northern Norway to the new national reference meridian at the university observatory. In 1837 a baseline was measured by Hagerup, Due, and Rynning on the frozen Jægervatnet on the Lyngen peninsula east of Tromsø. It was used to verify the computational result when the primary baseline was transferred along the meridian arc from Christiania to Trondheim and continued along the coastal arc to Tromsø. Since the latter was required to follow the coastline and include nearby islands, the triangles frequently received unfavorable shapes, which reduced precision ( and ). The triangle side Kistefjell–Bergsheia, south of Tromsø, was 40,366.64 m long, compared with 40,336.33 m derived from the data of the Struve arc a decade later (de Seue Citation1878, 104). The difference of 30.3 m corresponds to a relative error of 1:1300.
In 1835 Hagerup returned to the project and surveyed the entire coast from latitude 68.5° N via Tromsø (in 1836), Hammerfest (in 1837) and North Cape (Nordkapp) to Vadsø (in 1838). Hagerup took the geodetic arc inland to reach Vadsø, arguing that there were no islands or natural harbors along that part of the coast. The plane table mapping was completed in 1840. When the National Assembly funded extensive sea-depth measurements off the northeast coast of Northern Norway in 1841, this effort required a triangular arc along the coast for positioning the hydrographic ship. The arc was measured by Frederik Klouman in 1841. The year before, he had established a triangular arc along Altafjord from Hammerfest to Alta to connect the observatory of the French La Recherche Expedition to the coastal survey. An 11.8 km long triangle side near Tana () was common to both Hagerup and Klouman. Their results deviate by 52 m (i.e., a relative error of 1:230). The large biases in the astronomical longitude determinations in the region corroborate a suspicion of erroneous observations and possible computational mistakes (de Seue Citation1878, 105) for geodetic stations east of Tromsø.
Astronomical observations
The geodetic arc measurements with theodolites were latitude controlled by astronomical circummeridian observations of the sun and stars with sextants. Longitude differences were determined by chronometer expeditions. Hansteen had employed these techniques 15 years earlier to determine the astronomical coordinates of the university in Christiania’s observatory (Pettersen Citation2002).
At the beginning of the project, the Geographical Survey of Norway built a small observatory on the naval campus in Trondheim. It was equipped with a transit instrument (belonging to HagerupFootnote6) for time determination. Hagerup made three latitude determinations with a sextant in 1830; they yielded 63° 25′ 53.1″ ±2.5″ (see Appendix 1 for details sourced from logbooks in the Norwegian Mapping Authority). Hagerup and Due observed lunar occultations with a Fraunhofer refractor during their winter residences in Trondheim in the years 1831–1833 (de Seue Citation1878, 104), but it has not been possible to recover these data in any logbooks.
In 1835 Due and Hagerup moved to Tromsø, where a small observatory was built on the premises of present-day Kongeparken. A brick foundation extending from the bedrock to the observatory floor supported two granite pillars for the transit instrument. The horizontal axis carried a tube into which the telescope itself could be entered and secured. Meridian markers were used to monitor changes in telescope direction, which sometimes occurred during temperature changes.
The observation logbooks record two attempts to determine the latitude with a sextant and an artificial mercury horizon. Hagerup and Due collected 48 observations on seven days in the period 1835–1837, yielding an average latitude value of 69° 39′ 14.4″ ±5.4″. In January 1838, Due made 54 latitude determinations on seven nights from observations of stars, mainly Polaris. The average latitude was 69° 39′ 02″ ±14″. During the summer of 1839, Due used a theodolite equipped with a vertical circle to determine the zenith distance of the sun at culmination. A total of 57 observations over the course of six days yielded an average latitude of 69° 39′ 08.3″ ±6.7″. The weighted average of the three results is 69° 39′ 10.2″.
Seven lunar occultations of stars were observed with a Fraunhofer refractor by Due and Hagerup in Tromsø between 1836 and 1838. The observed local times have been compared with predictions in Universal Time (UT), corrected for the equation of time. The average time difference between Greenwich and Tromsø is 1h 12.93m ±5.42m, corresponding to a longitude of 18° 14′ E ±81′.
The uncertainty regarding longitude was too large for an astronomical control of the triangular arc, so Hansteen requested Due to make several chronometer expeditions between Trondheim and Tromsø in 1839. At his disposal was a newly cleaned pocket chronometer Kessels No. 1265 and the box chronometer No. 1259. The time of a meridian transit of the sun was observed in Trondheim on February 28, 1839. A subsequent journey by steamship to Tromsø allowed observations of the sun’s transits on March 8 and 9. After his return to Trondheim, Due observed meridian transits on March 20 and April 2. A new journey to Tromsø yielded transit times on April 19. He then returned to Trondheim for observations on May 3, and made an immediate return to Tromsø for transit timings on May 10, 13, and 15. After spending the summer surveying in Northern Norway, Due observed meridian transits of the sun on the return trip, on September 22 in Tromsø and on October 10 in Trondheim.
The data (in the observation logbooks) from the pocket chronometer No. 1265 yielded an average time difference of 34m 09.8s ±2.4s. By contrast, the box chronometer yielded 35m 11.9s ±48.4s, suggesting erratic behavior or gross errors on one or more journeys. The triangulation data yielded a longitude difference between Tromsø and Trondheim of 8° 34′ 21.0″, corresponding to a time difference of 34m 17.4s. Thus, the chronometer result deviated from triangulation by 2′.
Six years into the project, a partial solar eclipse occurred when Due was in Bodø, on July 16, 1833. He determined the start and end times. From those observations and modern calculations of the eclipse times can be derived a longitude for Bodø of 14° 21.9′′ E ±5.2′, which compares well with the modern value of 14° 22.6′. Sextant observations of the sun the next day yielded a latitude of 67° 17′ 04.1″ ±2.8″. Thus, Bodø served as a control station.
Due and Hagerup used seagoing vessels for hydrography in fjords and near the coast. They also visited selected islands, where latitudes were determined with a sextant. Time differences of meridian transits between sites, calculated using the Kessels chronometers, yielded longitude differences. The observations were made close to lighthouses and churches, which served as geodetic stations in the triangular arc. At those sites, observations were usually made only once, so there was no internal control of gross errors.
Observations at six locations near latitude 64° have been recovered and their coordinates recomputed in a modern reference system. Comparison with modern geodetic coordinates shows latitude deviations of ±20″ rms and longitude deviations of ±37″ rms. The latter has a systematic bias of 1′ 32″ to reconcile with the longitude at Trondheim. Observations have also been recovered at eight locations north of 68.5°, indicating latitude deviations of ±9″ rms and longitude deviations of ±44″ rms. The latter has a systematic bias of 4′ 42″ to reconcile with the longitude at Trondheim.
The total solar eclipse in Bodø and the repeated astronomical observations at the two observatories in Trondheim and Tromsø were superior to those made in the field and were thus used for orienting the maps. Compared with previous astronomical observations by the Geographical Survey of Norway (Pettersen Citation2009), the precision of latitude and longitude improved by an order of magnitude with the new instruments. They were comparable to results for the university in Christiania’s interim observatory in the period 1815–1818 obtained by Hansteen (Pettersen Citation2002), who employed the same methods and similar instruments. The field observations were much less accurate and suffered from biases.
The coastal map series
Coastal maps at a scale of 1:200,000 were issued annually between 1835 and 1847 by the Geographical Survey of Norway, covering the coast of Northern Norway in ten sections. Using a cylinder projection, the maps were constructed by Andreas Vibe (de Seue Citation1878, 121). The cartouche on each map identified the contributing surveyors and hydrographers. Each section of the coast was covered by two printed map versions. The general map identified coal-fired lighthouses and other permanent markers, and it provided digital sea depths in fathoms and letter codes to indicate the nature of the seabed (e.g., clay, sand, gravel, rock). The coastal maps were supplemented by printed booklets describing the nature of the coast and islands, with detailed advice on travel routes for safe passage and locations of lighthouses, safe havens, and harbors. Two maps were also issued at a scale of 1:750,000, covering larger regions of the coast ( and ). For identification purposes, some maps had drawings inserted that depicted named markers and lighthouses, as well as local maps of important harbors, and topographic profiles of the coastline as would be seen by a sailor approaching from the ocean. This series was the first public map production by the Geographical Survey of Norway (de Seue Citation1878, 91). The maps were engraved in polished stone and printed by the lithographic facility of Ludvig Fehr in Christiania. The maps were available in selected bookstores across the country, but sales were low (selected maps are shown in Supplementary Figs. 1–6). Eventually, the Survey established its own sales office. The income was collected by the Treasury and totaled ca. 900 spesidaler (USD 33,000 today) (de Seue Citation1878, 101).
Cartographers not attached to the Geographical Survey of Norway produced also their own maps of Northern Norway based on the individual maps of the coastal map series. They were not original constructions from basic data, but downscaled (e.g., to 1:5,000,000) from the published maps. These private products were sold in bookstores across Scandinavia. Carl B. Roosen’s map General kart over den nordlige deel af Kongeriget Norge (Noregr) (‘General map of the northern part of the Kingdom of Norway’) from 1845 (published in Kristiania)Footnote7 acknowledges the coastal survey in the cartouche, while Gustaf Klint’s map Karta öfver Norriges kust norr om Trondhjem ifrån Froe Öarna till Lofoten (‘Map of the Norwegian coast north of Trondheim from Froan to Lofoten’) from 1839 (published in Stockholm)Footnote8 does not make any such reference.
Conclusions
Christopher Hansteen realized immediately upon his appointment as director of geodesy in the Geographical Survey of Norway that existing instrumentation was outdated, both methodologically and technologically. Improved circle division made German theodolites the desired instrument. This prepared for a methodological paradigm shift in Norway, from obtaining results in the measurement plane of a triangle to obtaining results in a topocentric altitude-azimuth coordinate system.
As a university professor, Hansteen obtained funds to acquire a theodolite from Reichenbach and Ertel in Munich. He employed the instrument to survey stations in Christiania and its surroundings, thus connecting his astronomical results at the university in Christiania’s interim observatory to a few monumental buildings, including church towers. By establishing two baselines, he could compute the length of an accurate linear scale using different combinations of triangles and thus form an opinion of the accuracy that could be obtained in such operations. Hansteen used the results to argue that funds should be made available by the National Assembly for the future projects of the Geographical Survey of Norway.
When new instruments had been acquired, they were tested in a full-scale surveying operation. A longitudinal arc with geodetic stations on very high mountain tops, well above the forest line, was measured using an Ertel theodolite. Heights were measured with mercury barometers and geodetic calculations were performed on the ellipsoid.
Between 1828 and 1842, theodolites, sextants, chronometers, and barometers were used to survey the coast of Northern Norway for the first time. Each geodetic station served for detailed mapping with plane tables. Vessels were used for sea-depth measurements along the coast and in fjords. Ships were the general mode of transport for the observers and provided access to selected islands for obtaining astronomical control coordinates and for drawing topographic profiles as seen by a sailor approaching from the ocean.
Astronomical observations and chronometer expeditions were made to derive latitudes and longitudes. The purpose was to orient the triangular arc and control the geodetic coordinates of selected sites. Temporary astronomical observatories were established in Trondheim and Tromsø. Astronomical field observations were also made at selected geodetic stations along the coast, but they were an order of magnitude less accurate and suffered from biases.
The combination of the best astronomical results for orientation of the geodetic arc, a much improved baseline precision for scale, and improved triangulation with modern theodolites, provided a geodetic basis that superseded earlier results in Norway and prepared for participation in the Struve geodetic arc measurements a decade later. Although the coastal maps were not an economic success, their detail and precision were used as arguments to propose improved coastal maps for southern Norway. That work began in 1849 (de Seue Citation1878, 124).
SGEO_1825523_Supplementary_Material
Download Zip (159.7 MB)Acknowledgements
The author is grateful to reviewers and editors for greatly improving the original manuscript.
Notes
1 The Norwegian name was Den Norske topographiske Opmaaling from 1814 to 1827, after which it had various names until it became Norges Geografiske Oppmåling in 1884; it was renamed Statens kartverk (Norwegian Mapping Authority) in 1986, which since 2012 has generally been known by the short form Kartverket (Harsson & Aanrud Citation2016).
2 Original kept in Staatsbibliothek zu Berlin, Preuss. Kulturbesitz, Germany
3 The Laplace formula is a semi-empirical relationship that allows derivation of the height above sea level for an observation site with known latitude from measured values of temperature and atmospheric pressure.
4 Hansteen left Norway in May 1828 for a two-year geomagnetic expedition to Siberia and he returned in June 1830.
5 Broch measured the baseline length as 4946.043 ells (1 ell = 0.6275 m); de Seue (Citation1878, 105) incorrectly gave this as meters.
6 A letter from H. Hagerup to C. Hansteen dated March 9, 1833 (original in the archives of the Norwegian Mapping Authority) indicates that the transit instrument was transferred to the Geographical Survey of Norway in return for Hagerup receiving a sextant with artificial mercury horizon.
7 Held in the National Library of Norway in Oslo and a copy of that map is accessible at https://commons.wikimedia.org/wiki/File:General_Kart_over_den_Nordlige_Deel_af_Kongeriget_Norge_(Noregr)_-_no-nb_krt_00629.jpg v
8 A copy is accessible at https://no.wikipedia.org/wiki/Fil:Sj%C3%B8kart_over_kysten_av_Norge,_fra_Roan_til_Lofoten,_fra_1839.png According to the web page the original is in Statens kartverk sjø Stavanger (now called Sjødivisjonen, Kartverket).
References
- Collett, J.P. 2011. Universitetet i Oslo 1811–1870: Universitetet i nasjonen. Oslo: Unipub.
- de Seue, C.M. 1878. Historisk Beretning om Norges geografiske Opmaaling. Kristiania: Grøndahl & Søn.
- Geelmuyden, H. 1884. Hansteens videnskabelige virksomhed. Naturen 8, 150–159.
- Hansteen, C. 1824a. Et paa naturen grundet system for maal og vægt. Magazin for Naturvidenskaberne 2(2), 161–194.
- Hansteen, C. 1824b. Opløsning af en opgave i den praktiske geometrie. Magazin for Naturvidenskaberne 2(3), 249–260.
- Hansteen, C. 1824c. Geographiske bestemmelser af nogle punkter i Christianias Omegn. Magazin for Naturvidenskaberne 2(4), 107–136.
- Harsson, B.G. & Aanrud, R. 2016. Med kart skal landet bygges: Oppmåling og kartlegging i Norge 1773–2016. Ringerike: Statens kartverk.
- Kost, J. 2015. Wissenschaftlicher Instrumentenbau der Firma Merz in München (1838–1932). Hamburg: Tredition.
- Pettersen, B.R. 2002. Christopher Hansteen and the first observatory at the University of Oslo. Journal of Astronomical History and Heritage 5(2), 123–134.
- Pettersen, B.R. 2009. The first astro-geodetic reference frame in Norway, 1779–1815. Acta Geodaetica e Geophysica Hungarica 44(1), 67–78.
Appendix 1. Primary sources
Correspondence between Hansteen and Schumacher, and Hansteen and Ertel regarding instruments is kept in the Observatory, University of Oslo, and in Staatsbibliothek zu Berlin, Germany. The letters used are dated as follows:
Letters from H.C. Schumacher to C. Hansteen dated 12 October 1816, 8 December 1816, 20 December 1817, 9 November 1822, 18 November 1822, 2 August 1824, 14 September 1824, 1 November 1825, 2 June 1826, 19 October 1826, 29 December 1826, 11 April 1828. Originals are kept at the Observatory, University of Oslo.
Letters from C. Hansteen to H.C. Schumacher are dated 30 January 1817, 20 September 1821, 17 July 1824, 29 July 1824, 19 August 1824, 12 November 1826, 7 August 1827, 28 March 1828, 14 May 1828, 20 January 1833, 21 April 1835, 4 February 1842. Originals are kept in Staatsbibliothek zu Berlin, Germany.
Letter from T. Ertel to C. Hansteen dated 30 January 1827. Original kept at the Observatory, University of Oslo.
Letter from H. Kessels to C. Hansteen dated 28 October 1825. Original kept at the Observatory, University of Oslo.
Logbooks in the archives of the Norwegian Mapping Authority used as sources for this article are: H.S. Hagerup, D.G.O. II-26; Hagerup 1828–1829, D.G.O. II-27; H.S. Hagerup and Ch. Due 1835–1837, D.G.O. II-37. Ch. Due 1837–1838, D.G.O. II-43; Ch. Due 1839, D.G.O. II-44; Due 1841–1842, D.G.O. II-48. T.C.A. Broch, Trigonometriske Beregninger for Aarene 1835 og 1836.