
ABSTRACT
Tailored products based on climate projections are in demand for climate adaptation planning in different industries. To meet the needs of the tourism industry, the authors applied available datatsets to calculate projections for the distribution of precipitation as rain, sleet, and snow in Norway, using daily average temperature to classify the precipitation phases. Amounts and number of days with precipitation in the different phases were calculated. The projections were based on bias-adjusted output from 10 EURO-CORDEX models under two emission scenarios. In general, total precipitation, as well as temperature, was projected to increase, while the number of days with precipitation was not projected to change significantly. The proportion of rainfall was projected to increase while that of snow was expected to decrease. Sleet ratio was projected to decrease in low lying coastal areas, and to increase in mountainous and inland areas. The results were presented for several tourist destinations. However, the authors found that the bias adjustment method applied in the input dataset led to a bias towards too much rain and too little snow, which should be considered when interpreting the results. They concluded that projections of rain, sleet and snow days were considered less affected by that flaw.
KEYWORDS:
Introduction
In Norway, global warming has led not only to increasing temperatures, but also to increasing precipitation (Hanssen-Bauer et al. Citation2017). The consequences of global warming for snow conditions at different Norwegian localities is thus not obvious, and although snow amounts are already decreasing in coastal areas and at low altitudes, long-term trends have shown an increase at high altitudes, at least until recently (Skaugen et al. Citation2012). This is important not only for the hydropower production capacity in Norway, but also for the tourism sector, as winter and shoulder season tourism is an important economic factor, especially for rural regions and municipalities. Reliable snow conditions are crucial for ski-based tourism during winter and spring. Scott et al. (Citation2020) conducted a risk assessment of climate change for 110 ski destinations in Norway, and Dannevig et al. (Citation2021) studied the adaptive capacity of seven ski resorts in the western part of the country. In the project ClimTour (Impacts of climate change on Norwegian nature-based tourism),Footnote1 scientists worked with practitioners in the tourism industry aiming at tailoring output from climate models to produce products that make a useful basis for long-term planning in the tourism industry. One of the key questions from the practitioners involved in the project was how snow conditions would develop (Antonsen et al. Citation2022, 184). Despite an increase in easily available climate change information on websites, such as the IPCC WGI Interactive Atlas (IPCC Working Group 1 Citationn.d.), and the ‘Mountain’ component of the ‘European Tourism’ Sectoral Information Service, Copernicus Climate Change Services provided by Morin et al. (Citation2021), spatial resolution and systematic errors are still factors limiting the usefulness of these products for practitioners. H. François et al. (Citation2023) analysed the projected impact of climate change on ‘snow reliability’ for ski resorts with and without snowmaking in 28 European countries, based upon regional climate models. However, although the general results are interesting for practitioners, the spatial resolution is still too coarse to be useful for the individual practitioner. As part of the ClimTour project, Mayer et al. (Citation2023) applied post-processed results from regional climate models to develop projections for several climate indicators, including future snow conditions at different altitudes, in a case study focused on one tourist destination, namely in the Lofoten area (area N2 in ). In the study presented here, which was carried out within the CLIMTOUR project, we extended the analysis to produce maps showing projections for future rain, sleet and snow precipitation for the entire Norwegian mainland, as well as distributions of precipitation in the different phases at different altitudes in 11 regions, including several ski destinations used by tourists (). Precipitation may change either because the number of precipitation days changes or because the average precipitation amount per precipitation day changes, or due to a combination of both. Therefore, we analysed the number of days, as well as total amounts of the different precipitation types (snow, sleet, rain). According to stakeholders’ wishes, calculations were performed on an annual basis, as well as for winter and spring, which are the main seasons for ski tourism. Winter was defined as December, January, and February and spring as March, April, and May.
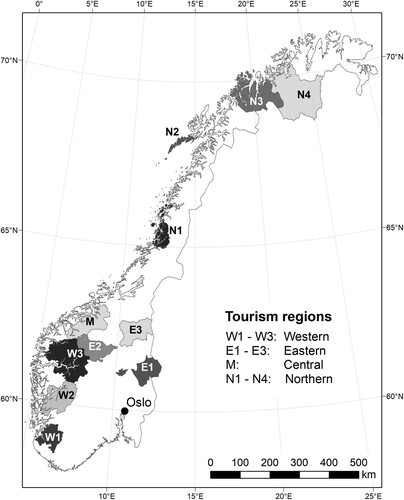
Fig. 1. Study area and selected tourism regions
The main purpose of the study was to use currently available datasets to produce the information requested by the practitioners. In the next section, we describe the study areas, datasets and methods used for calculating the geographical and altitudinal distribution of rain, sleet, and snow under present and projected future climate conditions are described in the next section. Thereafter, we present our results. A fundamental question, however, is whether our available datasets and methods provide a sufficient basis to produce useful information for the practitioners. We thus discuss the reliability of our results, considering the datasets and methods that have been applied, and then present our conclusions.
Study area, data, and methods
Study area
The basic calculations of the distribution between rain, sleet, and snow were performed for the Norwegian mainland. For selected tourism regions (), additional analyses were performed for different altitude intervals, and on a seasonal basis. The selected regions include the following municipalities:
W1: Sandnes, Gjesdal, Strand, Hjelmeland, Sirdal
W2: Etne, Kvinnherad, Ullensvang, Eidfjord, Ulvik, Kvam
W3: Vik, Sogndal, Aurland, Lærdal, Årdal, Luster, Sunnfjord, Gloppen, Stryn
E1: Elverum, Lillehammer, Trysil, Åmot
E2: Skjåk, Lom, Vågå, Sel
E3: Tolga, Tynset, Alvdal, Os, Røros
M: Molde, Rauma, Sunndal, Surnadal, Stranda, Fjord
N1: Bindal, Sømna, Brønnøy, Vega, Vevelstad, Alstahaug, Dønna, Nesna
N2: Røst, Værøy, Flakstad, Vestvågøy, Vågan, Moskenes
N3: Tromsø, Balsfjord, Karlsøy, Lyngen, Storfjord, Kåfjord, Nordreisa
N4: Kvænangen, Alta, Kautokeino, Karasjok
Data
Global projections for future climate from earth system models (ESMs) used in the Fifth Assessment Report of the IPCC (Intergovernmental Panel on Climate Change) (Stocker at al. 2013) have a spatial grid size of around 100 km. In the EURO-CORDEX initiative (Jacob et al. Citation2014), selected global models were downscaled with regional climate models (RCMs) to a resolution of c.12.5 × 12.5 km. The dataset is publicly available at several Earth System Grid Federation (ESGF) nodes (e.g. ESGF-LIU). For the study presented here, we used a subsample of 10 ESM-RCM model combinations ().
Table 1. Model combinations retrieved from the high-resolution Euro-CORDEX data set
The spatial resolution of the EURO-CORDEX data is still too coarse to give an appropriate representation of the Norwegian topography. Furthermore, there are biases in the simulated temperatures and precipitation. Wong et al. (Citation2016) found that the majority of the same 10 model combinations listed in gave a too cold and wet climate in Norway, which in turn affected the snow conditions. They thus post-processed the model results by regridding them in the 1 × 1 km grid that is used in the seNorge_1.1 observation-based dataset,Footnote2 and then adjusted for the biases in every grid cell, using the seNorge_1.1 data for the period 1971–2000 for calibration. The same period was used as a reference period for the climate projections for Norway presented by Hanssen-Baur et al. (Citation2017). Wong et al. (Citation2016) performed the bias adjustments of precipitation and temperature independently. The resulting dataset is available via the Norwegian Meteorological Institute’s data service ‘thredds’ (Norwegian Meteorological Institute Citationn.d.), which includes two greenhouse gas emission scenarios based on the representative concentration pathways RCP4.5 and RCP8.5, comprising a 130-year period from 1971 until 2100. Nilsen et al. (Citation2021) showed that, compared to the raw EURO-CORDEX dataset, the post-processed dataset significantly reduces errors. In accordance with the naming used by Nilsen et al. (Citation2021), we hereafter refer to the post-processed dataset as ‘COR-BA’ (bias-adjusted RCM data for Norway from the EURO-CORDEX initiative. For the analyses presented in this article, we applied data for the periods 1971–2000, 2031–2060, and 2071–2100.
Methods
The bias-adjusted dataset described in the preceding section above includes gridded daily average temperature and daily precipitation sum, but no information on whether the precipitation is liquid, frozen, or a combination of these. As several factors affect the connection between ground temperature and precipitation form, there is no global one-to-one dependence between these variables. Jennings et al. (Citation2018) found that the average air temperature at which rain and snow falls in equal frequency is +1.0 °C, but with considerable spatial variation from -0.4°C to +2.4°C at 95% of almost 12,000 stations in the Northern Hemisphere. They found the lower values at maritime stations. As the maritime influence is considerable in most parts of Norway, we assumed a temperature threshold near 0 °C to be realistic for our study. Therefore, we applied a simple temperature-based climate indicator alluding to whether precipitation falls as snow (mean daily T ≤ -1°C), sleet (-1°C T 1°C) or rain (T ≥ 1°C).
We applied the temperature thresholds for every grid point and for every day to estimate the distribution of precipitation in rain, sleet, and snow for the bias-adjusted dataset for all three time slices. For the reference period, we also did similar calculations directly from the observation-based dataset (seNorge). In the first part of the Results section, we compare the reference period results for the two datasets. The remaining part of the section focuses on the projected future changes. In addition to analyses of the general results, we applied the gridded information on elevation, which is embedded in the datasets, to classify precipitation depending on altitude levels in the 11 selected tourism regions (). The results presented for the different altitude intervals within a specific region are the arithmetic averages for all grid points in the region located within the actual altitude interval.
Results
Results for the reference period 1971–2000
In the reference period 1971–2000, the bias adjustment of the 10 EURO-CORDEX simulations () forced the precipitation and temperature climatology for each model in the COR-BA dataset to fit seNorge_1.1. This was the case not only for the average annual precipitation for Norway (which added up to almost 1600 mm; ), but also for every grid point. However, our analyses show that the relative distribution of precipitation in rain, sleet and snow differs considerably between the COR-BA dataset and the observation based dataset ( ). The amount of rain is overestimated by 9 percentage points, while the amount of snow is underestimated by 10 percentage points in the presented simulations. We found similar differences both in winter and spring.
Table 2. Average annual and seasonal precipitation as rain, sleet and snow, and number of days with precipitation as rain, sleet and snow in Norway during the period 1971–2000, based on the ensemble-mean of 10 bias-adjusted series in the COR-BA dataset, with percentage of total precipitation and number of days with precipitation in the different phases given for the COR-BA dataset and the observation based reference dataset
When considering the number of days with precipitation in the various phases, the differences between COR-BA and the observational based dataset are 1–4 percentage points only (). Consequently, the average precipitation on a rainy day is overestimated, and the average precipitation on a snowy day is underestimated.
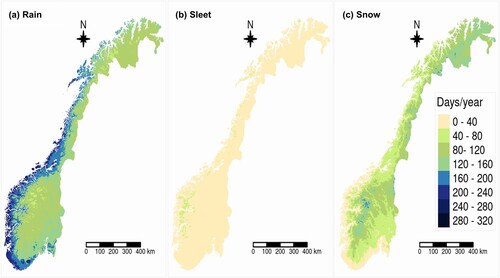
The spatial patterns for the number of days with precipitation in different phases based on the COR-BA dataset in the reference period () shows that the highest numbers of rainy days are found along the western coast, while the highest numbers of snowy days are found in the mountains and in some northern areas. Rainy days dominate in southern Norway, with the exception of some high-altitude inland areas. They also dominate along the west coast of northern Norway. Snowy days dominate in high altitude inland areas, as well as in north-eastern Norway. According to Kuya et al. (Citation2023), who earlier compared the maps based on the COR-BA dataset with on observational-based maps for a technical report, the above-described patterns fit very well with the observation-based maps. Also, for total precipitation (not shown) the patterns show similar main features, but there the areas dominated by rain are somewhat extended when based upon the COR-BA dataset, as compared both to the observation-based map and to the maps showing number of days with precipitation in the different phases (Kuya et al. Citation2023).
Fig. 2. Average number of days per year with (a) rain, (b) sleet and (c) snow during the period 1971–2000, according to the COR-BA dataset
Projected changes for Norway
In this section, we analyse simulated changes in snow, sleet, and rain by comparing the COR-BA results from the reference period 1971–2000 to results for the periods 2031–2060 and 2071–2100 under the emission scenarios RCP4.5 and RCP8.5. Amounts of precipitations, as well as number of days with precipitation in the three phases are compared.
On average for Norway, total precipitation is projected to increase in all seasons towards the mid-21st century, as well as towards the end of the century (Hanssen-Bauer et al. Citation2017). This is confirmed by the present analysis when adding up the precipitation totals in all phases (). However, while the annual amount of rain is projected to increase, the amounts of sleet and snow are projected to decrease. indicates that annual rainfall is projected to increase 20–52%, depending on time horizon and scenario, whereas the amount of sleet is projected to decrease by 8–31%, and snow by 32–63%. In winter and spring, the projected relative increase in rainfall is even larger (33–105% in winter, and 28–74% in spring). For snowfall, the relative reduction in winter is slightly less dramatic than the annual values (-26% to -54%), whereas the values for spring are rather similar to the annual values.
Table 3. Average values (mm) of the annual and seasonal amounts of rain, sleet, snow, and total precipitation in Norway during the reference period 1971–2000 and for the two scenario periods 2031–2060 and 2071–2100 under RCP4.5 and RCP8.5, with all values as ensemble medians based on the COR-BA dataset, and change from reference period (in %) given for the scenarios
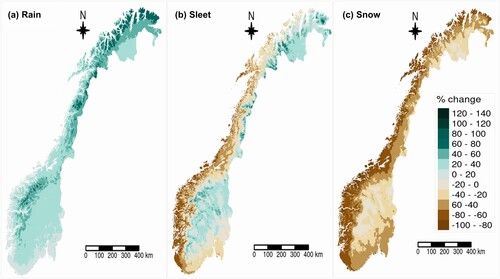
The geographical patterns concerning the projected changes towards the end of the 21st century under scenario RCP4.5 show that the average amount of rain is projected to increase practically everywhere (a). Although the largest increase in mm is projected in western and north-western areas of Norway, in the maximum precipitation zone, 10–50 km inland from the coast (not shown), the largest increase measured in per cent is projected along the northern coast. The average amount of sleet is projected to decrease in a zone along the coast and at low altitudes up to about 70 °N, but to increase farther inland and in mountain areas (b). The average amount of snow is projected to decrease everywhere (c), and most in western coastal areas, where snowfall may be a rare event in the future. The geographical patterns are qualitatively similar for both scenarios and both time slices, although the projected increase in rainfall and reduction of snowfall is smaller for the mid-century scenario and larger for the high scenario (i.e. RCP8.5).
Fig. 3. Change (% of 1971–2000 average) in annual precipitation sums as (a) rain, (b) sleet and (c) snow from the period 1971–2000 to the period 2071–2100 under RCP4.5, according to the COR-BA dataset
The average number of days with rain in Norway is projected to increase annually as well as for winter and spring, whereas the number of days with snowfall is projected to decrease both annually and seasonally (). For sleet, the signals are more mixed seasonally, although the average annual number of days is projected to decrease. When adding up the number of days with rain, sleet and snow, we found a small reduction in the projections. Although this reduction is certainly not statistically significant, we can conclude that the projected increase in total precipitation on average results from increased precipitation per day rather than an increased number of days with precipitation. This is also the case for winter and spring when looking at total precipitation.
Table 4. Average number of days per year or season with rain, sleet, snow, and total precipitation in Norway during the reference period 1971–2000 and for the two scenario periods 2031–2060 and 2071–2100 under RCP4.5 and RCP8.5, with all values as ensemble medians based on the COR-BA dataset
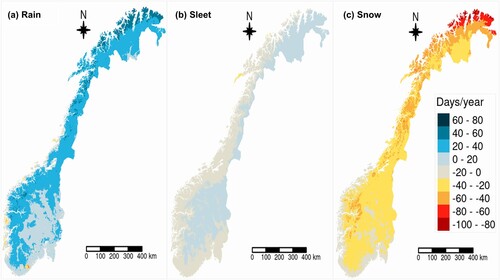
The annual number of rainy days is projected to increase everywhere (a), mostly along the northern coast, but also significant increases are projected in a zone parallel to the coast in areas exposed to north-westerly winds. For sleet (b), small reductions or increases in number of days are projected, following quite closely the patterns for changes in the amount of sleet (b). The annual number of snowy days is projected to decrease everywhere (c). The geographical signature is similar to the pattern for rainy days, but where the number of rainy days increases, the number of snowy days decreases. Thus, the total number of precipitation days is not projected to change much anywhere, but there will be more rainy days and fewer snow days.
Fig. 4. Change in average annual number of days with precipitation as (a) rain, (b) sleet and (c) snow from the period 1971–2000 to the period 2071–2100 under RCP4.5, according to the COR-BA dataset
Projected changes for tourist destinations
As temperature varies with altitude, altitude is important for snow conditions. Ski destinations usually cover terrain over a wide range of altitudes. For 11 tourism regions (), we thus developed projections for rain, sleet, and snow for 300 m a.s.l. altitude intervals (0–300 m a.s.l., 300–600 m a.s.l., and so forth). Based upon the results (winter, ; spring, ), the regions can be categorised in three groups, which are exemplified by one of the members in each group in the following sections. We show the results for RCP4.5 towards the mid-21st century in and , and in . The longer time horizon and the higher RCP8.5 scenario give a larger increase in rainfall and reduction in snowfall.
Fig. 5. Distribution in tourism region W3 of rain, sleet, and snow for different altitude intervals in winter (December, January, February) and spring (March, April, May) in the reference period 1971–2000 (left-hand panels), and projections for the period 2031–2060 (right-hand panels) under RCP4.5, according to the COR-BA dataset
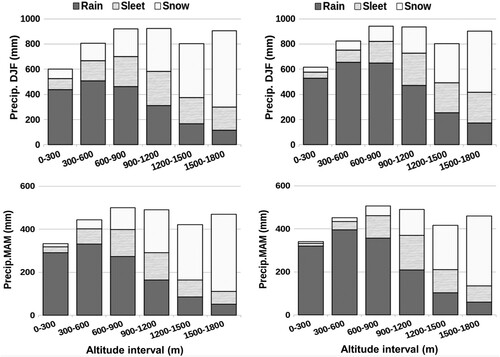
Fig. 6. Distribution in tourist region E3 of rain, sleet, and snow for different altitude intervals in winter (December, January, February) and spring (March, April, May) in the reference period 1971–2000 (left-hand panels), and projections for the period 2031–2060 (right-hand panels) under RCP4.5, according to the COR-BA dataset
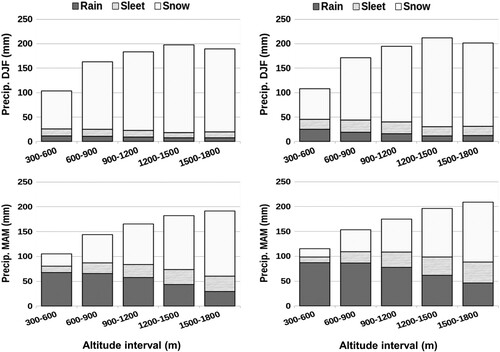
Fig. 7. Distribution in tourism region N4 of rain, sleet, and snow for different altitude intervals in winter (December, January, February) and spring (March, April, May) in the reference period 1971–2000 (left-hand panels), and projections for the period 2031–2060 (right-hand panels) under RCP4.5, according to the COR-BA dataset
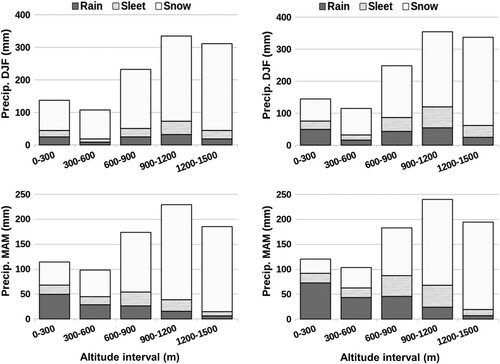
Fig. 8. Annual number of days with precipitation as of rain, sleet, and snow for different altitude intervals in winter (December, January, February) and spring (March, April, May) in the reference period 1971–2000 (left-hand panels), and projected changes to the period 2031–2060 (right-hand panels) under RCP4.5, according to the COR-BA dataset, for tourism regions W3 (panel/row a), E3 (panel/row b), and N4 (panel/row c)
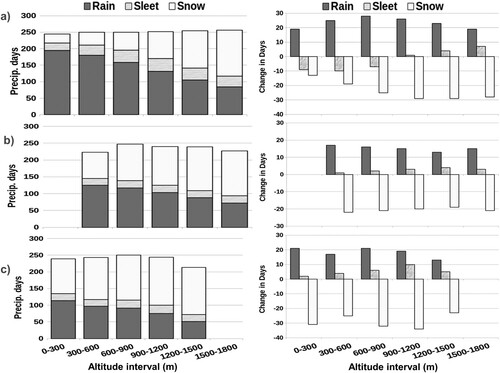
Table 5. Distribution of rain, sleet, and snow in winter (December, January, February) during the reference period 1971–2000 and for the projections for the period 2031–2060 under RCP4.5
Table 6. Distribution of rain, sleet and snow in spring (March, April, May) during the reference period 1971–2000 and for the projections for the period 2031–2060 under RCP4.5, with values given for the 11 tourist regions shown in , and in each region for different 300 m a.s.l. altitude intervals
Western coastal destinations
This group includes the regions W1, W2, W3, M, N1, and N2 (). In this section, the group is represented by region W3 (). Typical for these regions is that annual precipitation is high. The average sum of winter and spring precipitation in these regions is 1000–1600 mm, and winter precipitation is on average 50–100% higher than spring precipitation ( and ). Already in the reference period rain is dominating over snow at the lower two to three altitude intervals, both in winter and in spring, according to the COR-BA dataset, and rain is projected to take over as the dominating precipitation phase in at least one additional altitude interval towards the mid-21st century. For N1 and N2, this implies that rain will dominate over snow almost everywhere towards the mid-21st century. There are higher mountains in the western coastal tourism regions farther south, and snow will still dominate at the highest elevations. The fraction of sleet is projected to decrease at lower altitudes but increase at altitudes above 1200 m a.s.l. in winter (), and above 900 m a.s.l. in spring ().
South-eastern inland destinations
This group includes the regions E1, E2, and E3 (), and is represented by region E3 () in this section. These are rather dry regions: the average sum of winter and spring precipitation is 300–400 mm. In the easternmost regions E1 and E3, total precipitation in winter and spring are similar. Region E2 has considerably more precipitation in winter than in spring at altitudes above 600 m a.s.l., as these are more exposed to weather coming from the west. Typical for the southern inland areas is that snow in the reference period is the dominant precipitation phase in winter at all altitudes (), whereas rain dominates up to at least 900 m a.s.l. in spring (). The projections towards the mid-21st century indicate that although rain and sleet fractions will increase, snow will continue to dominate in winter. At high altitudes, the amount of snow may not even decrease. However, rain in spring is projected to take over as the dominating precipitation phase up to 1200 m a.s.l., and snow amounts are projected to decrease everywhere.
Northern destinations
This group includes the regions N3 and N4 (), and is represented by region N4 (). The average precipitation is, as in the south-eastern regions, rather low, but as in the western regions, there is considerably more precipitation in winter than in spring, especially in N3. In winter, snow is the dominating precipitation phase at all levels, and it dominates in spring at altitudes above 300 m a.s.l. The projections indicate that snow will continue to dominate in winter, as well as above 600 m a.s.l. in spring towards the mid-21st century. Rain and sleet amounts are projected to increase at all levels. The amounts of snow are projected to decrease at lower levels, but they are projected not to change much at the higher elevations.
Discussion
Model-based versus observation-based precipitation climatology
Our comparison of the observationally based dataset and the COR-BA dataset for the reference period 1971–2000 reveals systematic differences in the distribution of precipitation in rain, sleet, and snow. In general, the relative contribution of rain is overestimated in the COR-BA based dataset, while snow is underestimated. This is in accordance with the results reported by Meyer et al. (Citation2019), who show that univariate bias adjustment of temperature and precipitation typically leads to too much precipitation at temperatures above 0 °C, while applying a multivariate bias adjustment approach gives more realistic results . Preliminary results suggest that the COR-BA dataset may be improved in this respect by applying a ‘shuffling technique’, as suggested by Mehrotra & Sharma (Citation2019). However, whereas the application of a multivariate bias adjustment method can clearly improve the results for the reference period, the method may not be able to maintain multidimensional changes from the model (B. François et al. Citation2020). Ongoing research indicates that it may alter, for example, projected monthly or seasonal changes (Andreas Dobler, personal communication 2023). The Norwegian Meteorological Institute is currently conducting further investigations into this aspect with the use of univariate and multivariate adjusted data.
The distribution of the number of days with precipitation in different phases based upon the COR-BA dataset is still rather in line with the observation-based distribution. Thus, the main problem with the modelled values is that, on average, there is too much precipitation per day on rainy days and too little per day on snowy days.
Projections for the tourist regions and whether they can be trusted
The projected changes in the distribution of precipitation as rain, sleet, and snow imply that towards the mid-21st century the conditions for ski tourism will deteriorate at low altitudes, especially in the western coastal regions. In the eastern and northernmost regions, the projected changes are less dramatic, and at high altitudes, snow will continue to be the dominating precipitation phase towards the mid-century. In some mountain areas, the amount of snow may even increase slightly. However, even if the amount of snow is projected to be less affected by climate change at the higher altitudes in all regions, one should be aware of the fact that the amounts of rain and sleet will increase. The water content in the snow will thus increase, and change the conditions for avalanches, from dry snow avalanches towards avalanches in wet snow and slush flows. The latter may occur in less steep terrain, and thus occur in areas that have not previously been prone to avalanches.
A key question is whether we can trust the above-described projections. The projections for future rain, sleet, and snow depend both on the applied EURO-CORDEX models () projections of temperature and precipitation, and on the post-processing of these data performed by Wong et al. (Citation2016).
The EURO-CORDEX projections of temperature and precipitation for Norway and for all Norwegian counties are published by the Norwegian Centre for Climate Services (NCCS). So far, the observed trends in temperature have fitted well with the projected median trends under RCP4.5 and RCP8.5 (which are rather similar on such a short time horizon) on an annual basis, as well as on seasonal basis. According to the projections presented by NCCS, this applies both to Norway as a whole and to different counties/regions. However, the observed annual trend in precipitation for Norway has so far been in the upper part of the EURO-CORDEX-ensemble. In eastern regions, the observed precipitation increase has been even larger than the increase projected by any of the models. This may signal a tendency for the models to be too conservative concerning precipitation. However, the differences may also result from decadal scale variability, which is dominating on such short timescales. Although such regional variations are reproduced by climate models (e.g. Deser et al. Citation2012), the timing is arbitrary. Deviations between models and observations are even larger on a seasonal basis. Annual trends are thus more robust than seasonal trends, and although the modelled trends so far have been smaller than the observed trends in most regions, the projections indicate a trend towards more precipitation in general, which would be in accordance with what we have seen.
Concerning the post-processing, we find that the univariate approach has led to too much rain and too little snow in the reference period 1971–2000. This leads to too much rain in the projections, but it is not obvious whether or not, and how far trends in rain, sleet, and snow are affected. We find, however, that the number of days with precipitation in the various precipitation phases is less affected by this systematic error than total precipitation in the various phases (). Although the practitioners in the tourism industry preferred information of total amounts of snow, rain, and sleet, the signals we see in the projections of the number of days may provide a more robust source of information. shows that the annual number of snowy days in the COR-BA dataset exceeds the number of rainy days above 300 m a.s.l. in region N4, above 900 m a.s.l. in region E3, and only above 1200 m a.s.l. in region W3. indicates that the annual number of rainy days is projected to take over as the dominating phase in one altitude interval in the two southern areas, and two altitude intervals in region N4 towards the mid-21st century. These projections are probably more reliable than the seasonal projections for amounts of rain and snow. The number of days with precipitation in the different phases has, in general, the same direction as the trends for precipitation amounts. However, the total number of days with precipitation shows a small negative trend, whereas the total precipitation shows a positive trend, as precipitation in rainy days is higher on average than in snowy days.
The main problem with the projections of amounts is that the rainfall amounts are overestimated. Taking this into account, the projections may still give useful information of a more general nature. For example, no changes are projected concerning dominating precipitation phase at any altitude interval in winter, except for in the western coastal regions. By contrast , rain is projected to become precipitation phase in one altitude interval in all regions during spring.
Conclusions
For the simulated total precipitation in Norway, we list the following conclusions:
According to the median from an ensemble of ten EURO-CORDEX projections, average annual precipitation in Norway, as well as precipitation in winter and spring, has increased since the end of the 20th century, and will continue to increase during the 21st century.
The projected increase is due to an increase in the average amount of precipitation per precipitation day, while the average number of precipitation days is not projected to increase.
The observed precipitation increase from the end of the 20th century to the present day exceeds the projected increase. However, we cannot conclude whether this is caused by shortcomings in the climate models or by natural decadal scale variability.
For the modelled distribution of precipitation in rain, sleet, and snow, we present the following conclusions:
Due to the independent bias adjustment of temperature and precipitation in the input dataset (COR-BA), a too large percentage of the modelled total precipitation was characterised as rain, while a too small percentage was characterised as snow.
As a consequence of the above point, the geographical area dominated by rain is overestimated by the average model, while the area dominated by snow is underestimated.
For the number of days with precipitation in the different phases, the model results are more in line with the observations.
For the tourist destinations, scenarios for the mid-21st century for different altitude intervals have been projected. For these projections, the above conclusions imply the following:
While the percentage of precipitation falling as rain typically is overestimated and the snow is underestimated in the reference period, the distribution of the number of days with precipitation as rain and snow is in line with the observed climatology.
Total precipitation trends may be underestimated. A robust signal is still that the amounts of rain are projected to increase at all tourist destinations in winter and spring, while the amounts of snow are projected to decrease except for at the highest altitudes in inland areas, where only minor changes are projected in winter.
In eastern and northern inland areas, snow will continue to be the dominant precipitation phase in winter at all altitudes. In spring, rain is already dominating at low altitudes in south-eastern regions. Gradually, rain will take over as the dominating phase at low altitudes, including in the north, and the altitude below which rain dominates will increase. The amounts of sleet are projected to increase at all elevations.
In western coastal regions, rain is already dominating at lower altitudes in winter as well as in spring. The elevations below which rain dominates are overestimated in the present calculations, but a robust signal is that they will increase towards the mid-21st century, and snow will dominate only at high elevations. In these areas, snow conditions in spring may be just as stable as in winter. The amounts of sleet are projected to decrease at lower altitude and increase at highest altitudes.
In all regions, one should be aware that although the average amount of snow is not projected to change very much at high altitudes, the water content in the snow will increase. This may change the conditions for avalanches and slush flows.
Acknowledgements
We thank the CLIMTOUR project, financed by the Research Council of Norway, grant no: 281006, with in-kind contribution from the Norwegian Meteorological Institute (MET Norway) and NORCE. Thanks are due to Andreas Dobler, MET Norway, for discussions concerning post-processing methods, and Ole Einar Tveito, MET Norway, for preparing . We further acknowledge the World Climate Research Programme’s Working Group on Regional Climate, and the Working Group on Coupled Modelling for their coordinating efforts in providing the basic framework for the regional climate simulations used in our study. We also thank the climate modelling groups listed in of this article for producing and making available their model output, and the Earth System Grid Federation for providing the infrastructure hosting the model output and making it available for download. Finally, we thank the two anonymous reviewers, whose feedback helped us to improve the quality of the article.
Disclosure statement
No potential conflict of interest was reported by the authors.
Notes
1 The project, which ran in the period 2018–2022, was led by the Western Norway Research Institute, and was financed by the Research Council of Norway.
2 Unpublished data from document titled ‘New routines for gridding of temperature and precipitation observations for “seNorge.no”’, written by M. Mohr, in 2008 for the Norwegian Meteorological Institute.
References
- Antonsen, K.M., Dale, B. & Mayer, S. 2022. ‘It’s in our DNA’: Climate change and perceived resilience and adaptive capacity in nature-based tourism in Lofoten, Norway. Weather, Climate and Society 14, 177–190.
- Climate Limited-area Modelling Community. n.d. ‘Climate Limited-area Modelling Community’. https://www.clm-community.eu/ (accessed 23 May 2024).
- Dannevig, H., Gildestad, I.M., Steiger, R. & Scott, D. 2021. Adaptive capacity of ski resorts in Western Norway to projected changes in snow conditions. Current Issues in Tourism 24(22), 3206–3221.
- Deser, C., Knutti, R., Solomon, S. & Phillips, A.S. 2012. Communication of the role of natural variability in future North American climate. Nature Climate Change 2, 775–779.
- François, B., Vrac, M., Cannon, A.J., Robin, Y. & Allard, D. 2020. Multivariate bias corrections of climate simulations: Which benefits for which losses? Earth System Dynamics 11(2), 537–562.
- François, H., Samacoïts, R., Bird, D.N., Köbler, J., Prettenthaler, F & Morin, S. 2023. Climate change exacerbates snow-water-energy challenges for European ski tourism. Nature Climate Change 13, 935–942.
- Hanssen-Bauer, I., Førland, E.J., Haddeland, I., Hisdal, H., Lawrence, D., Mayer, S., Nesje, J.E.Ø. et al. 2017. Climate in Norway 2100 – A Knowledge Base for Climate Adaptation. NCCS report no. 1/2017. https://klimaservicesenter.no/kss/rapporter/rapporter-og-publikasjoner_2 (accessed 15 May 2024).
- IPCC Working Group 1. n.d. ‘IPCC WG1 Interactive Atlas’. https://interactive-atlas.ipcc.ch/ (accessed 16 May 2024).
- Jacob, D., Petersen, J., Eggert, B., Alias, A., Christensen, O.B., Bouwer, L.M. & Georgievski, G. 2014. EURO-CORDEX: New high-resolution climate change projections for European impact research. Regional Environmental Change 14(2), 563–578.
- Jennings, K.S., Winchell, T.S., Livneh, B. & Molotch, N.P. 2018. Spatial variation of the rain–snow temperature threshold across the Northern Hemisphere. Nature Communications 9: Article 1148.
- Kuya, E.K., Hanssen-Bauer, I., Mayer, S. & Heiberg, H. 2023 . Rain, Sleet and Snow in Norway 1971-2000: Observations vs. Results from Climate Models. NCCS report 01/2023. https://klimaservicesenter.no/kss/rapporter/rapporter-og-publikasjoner_2 (accessed 15 May 2024).
- Mayer, S., Kuya, E.K., Antonsen, K., Abegg, B. & Hanssen-Bauer, I. 2023. Warmer and wetter: Outlining climate services for snow-dependent tourism in Norway – the case of Lofoten. Climate Services 32: Article 100405.
- Mehrotra, R. & Sharma, A. 2019. A resampling approach for correcting systematic spatiotemporal biases for multiple variables in a changing climate. Water Resources Research 55, 754–770.
- Meyer, J., Kohn, I., Stahl, K., Hakala, K., Seibert, J. & Cannon, A.J. 2019. Effects of univariate and multivariate bias correction on hydrological impact projections in alpine catchments. Hydrology and Earth System Sciences 23(3), 1339–1354.
- Morin, S., Samacoïts, R., François, H., Carmagnola, C.M., Abegg, B., Demiroglu, O.C., Pons, M. et al. 2021. Pan-European meteorological and snow indicators of climate change impact on ski tourism, Climate Services 22: Article 100215.
- Nilsen, I.B., Hanssen-Bauer, I., Tveito, O.E. & Wong, W.K. 2021. Projected changes in days with zero-crossings for Norway. International Journal of Climatology 41, 2173–2188.
- Norwegian Meteorological Institute. n.d. ‘Catalog’. https://thredds.met.no/thredds/catalog/KSS/Klima_i_Norge_2100/utgave2015/catalog.html (accessed 16 May 2024).
- Scott, D., Steiger, R., Dannevig, H. & Aall, C. 2020. Climate change and the future of the Norwegian alpine ski industry. Current Issues in Tourism 23(19), 2396–2409.
- Skaugen, T., Stranden, H.B. & Saloranta, T. 2012. Trends in snow water equivalent in Norway (1931–2009). Hydrology Research 43(4), 489–499.
- Stocker, T.F., Qin, D., Plattner, G.-K., Tignor, M.M.B., Allen, S.K., Boschung, J., Nauels, A. et al. (eds.) 2013. Climate Change 2013: The Physical Science Basis. Contribution of Working Group I to the Fifth Assessment Report of the Intergovernmental Panel on Climate Change. https://www.ipcc.ch/report/ar5/wg1/ (accessed 22 May 2024).
- Wong, W.K., Haddeland, I., Lawrence, D. & Beldring, S. 2016. Gridded 1 × 1 km Climate and Hydrological Projections for Norway. NVE Report no. 59–2016. Norwegian Water Resources and Energy Directorate. https://nve.brage.unit.no/nve-xmlui/handle/11250/2500569 (accessed 15 May 2024).