
Abstract
In this study a series of experiments were performed subjecting surrogate nuclear fuel rods to high-pressure transients to induce fuel dispersion representative of the expected conditions of a fuel rod during a hypothetical loss-of-coolant accident. Experiments were conducted on like-for-like pressurized water reactor geometries in both a single-rod and rod-bundle configuration. In the rod-bundle configuration, a matched index of refraction techniques was employed to provide optical access to the bundle internals and to view the surrogate fuel dispersion event. Both configurations used small lead pellets as a surrogate fuel and were observed with a high-speed camera to capture the transient on a resolved timescale. For the single-rod experiments, the test rod was subjected to pressure transients at 4.0, 8.0, and 12.0 MPa multiple times, and for the rod-bundle experiments, the rod was subjected to 8.0 MPa transients in order to compare mechanical behavior against the single-rod test at 8.0 MPa. For both configurations, the results showed highly variable behavior in both the quantity of fuel dispersed and the mean displacement relative to the burst rod origin, likely due to statistical variations in the internal fuel stack orientation. Measurements of the rod plenum internal pressure showed no discernible difference in depressurization rates at a given pressure, indicating the likelihood that the mass flow rate is limited by the valve orifice in the current experimental configuration. The bundle tests also showed that a 5 × 5 array appears to be too small to capture the full spatial distribution of dispersed fuel, thus future tests will employ a larger bundle size and particle collection technique.
I. INTRODUCTION
Historically, the loss-of-coolant accident (LOCA) has been given great consideration, especially in the context of light water reactors (LWRs) and the performance of Zircaloy-clad UO2 fuel under such conditions.Citation1 This has primarily driven the discussion on emergency core cooling systems and provided the basis for requirements outlined in 10 CFR 50.46 (CitationRef. 2). As part of the industry trend, there has been a steady increase in the allowable burnup limit of reactor fuels, which requires continual assurance that emergency core cooling is satisfied under hypothetical LOCA conditions. As such, a number of integral LOCA tests have been performed to analyze rod performance during a LOCA, ranging from single separate-effects tests to full-size assemblies in reactor cores.Citation3–Citation8 Early tests were performed mostly on unirradiated cladding or low-burnup fuel in facilities such as the Power Burst Facility at the Idaho National LaboratoryCitation9 (INL). While most of the early tests on low-burnup fuel showed coarse fragmentation, more recent tests at the Halden and Studsvik Nuclear Laboratories on higher-burnup fuel have shown significant fuel fragmentation resulting from the transient.Citation10 Here the LOCA conditions may cause the rods to balloon and rupture, ejecting fuel fragments into the coolant channels. This has been referred to in the industry as fuel fragmentation, relocation, and dispersal (FFRD). The current burnup limit in the United States is 62.5 GWd/t, and this appears to be nearing a threshold for the transition of coarse to fine fuel fragmentation, thus significant testing and analysis must be performed before granting further burnup extensions in order to maintain assurance that emergency core cooling is satisfied under possible fuel dispersion conditions.
This paper represents a continuation of tests performed at Oregon State University (OSU) as part of an ongoing investigation into the fuel dispersion component of FFRD under LOCA conditions. This is part of a larger joint project with the INL that is focused on high-fidelity computer simulations of such events. In this experimental setting, like-for-like geometries of standard LWR fuel assemblies are filled with a surrogate nuclear fuel and subjected to high-pressure transients to induce fuel dispersal. Previous tests have shown variation in the dispersion behavior of a single rod versus that of a rod inside a fuel bundle, and this current series of tests aims to expand upon such tests to properly analyze them in the context of FFRD. While a single rod is not representative of a reactor core, most of the previous integral LOCA tests were performed on just a single rod, thus most documented behavior is based on observations from these tests.Citation11 Therefore, it is important to perform dispersion testing on both a single rod and a rod inside an assembly in order to characterize differences between the two.
II. MATERIALS AND METHODS
These series of tests are referred to as static blowdown tests, as they are conducted on rods inside of a clear rectangular glass tank filled with fluid (light mineral oil) in a benchtop lab setting, but do not include the forced convection component of flow as would normally be present in the reactor core imposed by the emergency cooling systems. Such tests are planned in a flow loop in the same lab, however the axial flow component is not necessary for these current tests.
Given the rapid nature of the fuel dispersion transients, the tests are recorded with a Phantom VEO 340L high-speed camera, oriented perpendicular to the rupture, that captures the transient at 800 frames per second at a resolution of 2560 × 1600 pixels. This yields the highest possible resolution with these cameras, while still providing an adequate acquisition rate to capture the transient at a resolved timescale.
The surrogate nuclear fuel used in these tests is standard spherical lead shot with a nominal diameter of 2.032 mm ± 0.245 mm. This was selected initially as the surrogate fuel for this experimental campaign because the density of lead is within 0.9% of the theoretical density of UO2 and thus satisfies density similarity for scaling while also being chemically nonreactive and nonradioactive. With a nominal diameter of approximately 2 mm, these pellets also represent a similar size as the expected average chord length of UO2 fragments at medium-level burnups. The main limitations from this surrogate fuel are that the constant pellet sizes are not representative of the distribution of sizes observed in real integral LOCA tests, in addition to the fact the pellets here are perfectly spherical and smooth. Actual UO2 fragments will have a nonuniform shape and a rough surface. Future tests in this experimental campaign will use HfO2 pellets to satisfy these requirements.
For the rod-bundle experiments, the same burst rod from the single-rod experiments is reused by securing it in the center of a 5 × 5 assembly of typical pressurized water reactor (PWR) geometry (square array, 12.6-mm pitch).Citation12 In order to have optical access to the burst rod in the center of the assembly, the outer 24 slots in the grid spacer are occupied by quartz rods of identical geometry, and the bundle is submerged in a bath of mineral oil. This provides for an optically matched index of refraction (MIR) environment, rendering the quartz rods transparent. The mineral oil used in this case is Drakeol #5 light mineral oil, which has been used in other MIR experiments, is well-characterized in terms of its optical and thermophysical properties, and is a suitable choice for refractive index matching.Citation13,Citation14
The tests are generally conducted by filling the surrogate fuel into the surrogate fuel rod, which has a prefabricated rupture in the cladding. The rod is connected to the gas plenum line and is pressurized to the desired pressure with a compressed nitrogen tank. The gas plenum line is closed off, thus providing a fixed volume of gas that is rapidly injected into the burst rod with the simultaneous activation of the solenoid valve and the high-speed camera. A simplified diagram of the experimental setup is shown in , with selected photos of the setup shown in .
Fig. 1. Diagram of experimental setup.
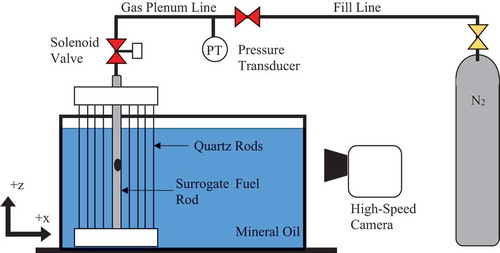
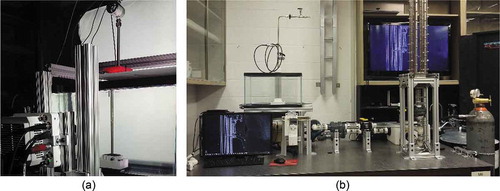
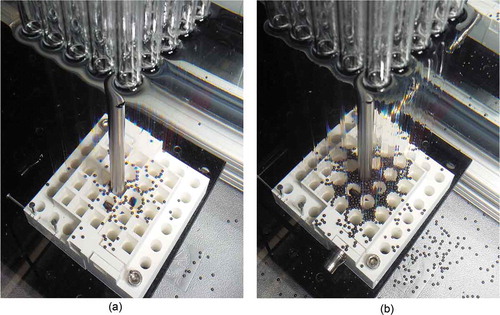
Fig. 2. Photo of (a) bundle in MIR fluid and (b) benchtop setup.
For all of the tests, the rods were subjected to pressure transients at either 4.0, 8.0, or 12.0 MPa, which is consistent with the low, mid, and high range of pressures observed during clad rupture in previous integral LOCA tests.Citation11 The geometries used in these tests are summarized in , some of which are selected for being consistent with typical PWR fuel geometry.Citation12
TABLE I Test Geometries
III. RESULTS
In the first section of the results, data are compared for the blowdown of a single rod at 4.0, 8.0, and 12.0 MPa. Each test was repeated five times (denoted by T1 through T5) at a given pressure, thus comprising a total of 15 single-rod blowdown tests. In the second section of the results, data are presented for the blowdown of a rod-bundle configuration at 8.0 MPa, which is also repeated five times. These data are compared against the data of the single-rod blowdown at 8.0 MPa from the first section of the results.
III.A. Single-Rod Comparison
A comparison of high-speed image snapshots for tests at 4.0, 8.0, and 12.0 MPa at 100 ms after the simulated rupture is shown in , where it can be seen that the higher pressures result in a much wider and farther spread of the surrogate fuel particles at a given time. It is interesting to note that at higher pressures more particles are given an upward velocity component and the spread becomes more isotropic, whereas for the 4.0-MPa snapshot, most of the force appears to be directed downward. This is likely in part due to the Magnus effect, in which the higher gas velocities impose an asymmetric impulse force on the particles, giving them a quick angular rotation and thus a corresponding lift force.
Fig. 3. Snapshot of blowdown at 100 ms for (a) 4.0, (b) 8.0, and (c) 12.0 MPa.
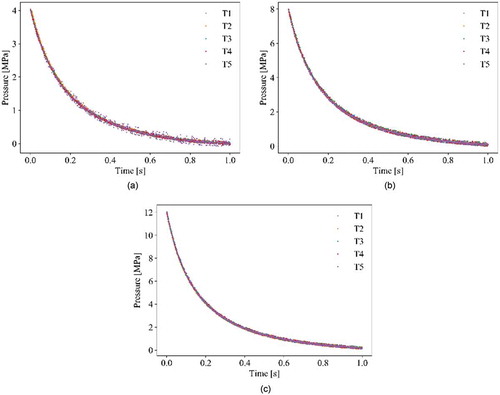
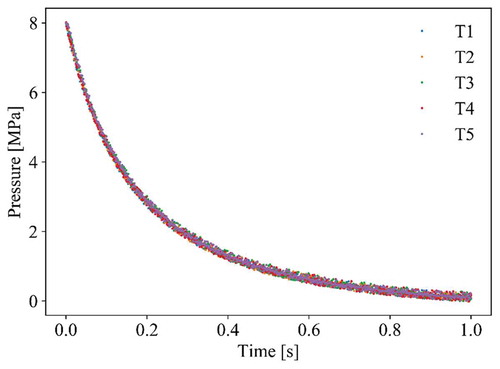
In the context of FFRD, the depressurization of the rods during failure may provide insight into the fuel stack behavior as it is shifting internally.Citation15,Citation16 As such, the depressurization of the rods in each test is shown at each pressure in . It can be seen that for each pressure there is little variation between each of the five tests. This indicates that there is either negligible influence of the fuel stack behavior on the depressurization rate or there is no gas communication between the downstream rod and the upstream pressure transducer. It is likely the latter, since the fuel loss measurements taken in this paper demonstrate a wide range of fuel dispersal from the rod, thus indicating a stochastic behavior on the interaction between the gas and the surrogate fuel. This is consistent with results from integral LOCA testing out of the Studsvik and Halden laboratories, which shows variation in depressurization rates.Citation4,Citation17,Citation18 The primary difference here is that the lead surrogate fuel is comprised of mostly uniform-diameter spheres with a smooth surface, whereas the UO2 fragments in reality have a distribution of sizes and are irregularly shaped with higher surface roughness. These variables will be accounted for in future tests that will use a distribution of HfO2 fragments as a surrogate fuel. To address the issue of downstream gas communication, a second pressure transducer will be added to the fueled section of the rod on the other side of the solenoid valve to measure the internal rod pressure as a function of time. This will likely improve the understanding of the variations in fuel dispersal quantity that are observed in this paper.
Fig. 4. Rod internal pressures for (a) 4.0, (b) 8.0, and (c) 12.0 MPa.
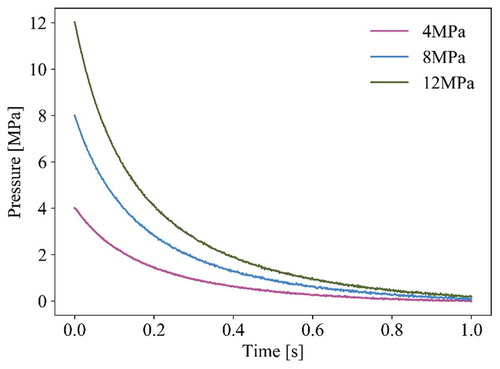
Given the consistent behavior of each of the five tests at a given pressure, the values for each were averaged over time to give a single depressurization plot, and the comparison of internal pressures at 4.0, 8.0, and 12.0 MPa are shown in . In it can be seen that regardless of the initial pressure, the entire rod tends to be nearly fully depressurized after approximately 1 s. This is expected, as the initial volume of the gas is the same in each case. Furthermore, it is noted that the diameter of the solenoid valve orifice (0.79 mm) is much smaller than the diameter of the burst hole in the rod (6.34 mm), indicating that the mass flow rate through the system is limited by the valve. Thus, pressure variations from the internal fuel stack configuration would not likely show up on the upstream pressure transducer. Hence this reiterates the previous observation that a downstream pressure transducer should be added to the system to improve the understanding of the transient progression as it relates to the quantity of fuel loss in each test.
Fig. 5. Comparison of averaged rod internal pressures at 4.0, 8.0, and 12.0 MPa.
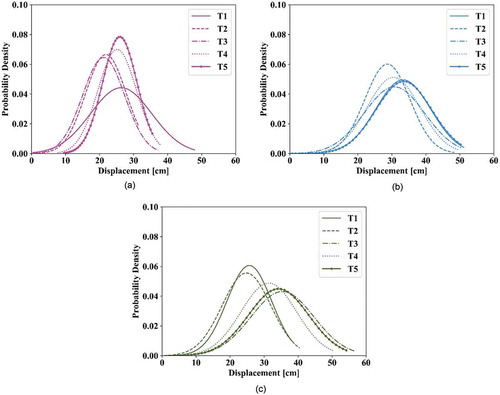
Post processing of the images was performed to obtain the final deposition location of the fuel particles as they came to rest, relative to the burst rod origin. Hence the displacement histograms in are in reference to the positive x-direction in accordance with the coordinate system in . The 4.0-MPa burst in shows three distinct behaviors ranging from a very broad distribution of fuel dispersion reaching to almost 50 cm to a very short full-width half-maximum burst with more fuel centered on the mean. For the burst at 8.0 MPa in , the distributions are more clustered together and are generally more broad and far reaching than in the 4.0-MPa tests. Last, the 12.0-MPa tests in show two general behaviors, with a few tests resulting in shorter, more clustered fuel distributions and a few tests with the more broad distributions. In all cases, this dispersion behavior appears to be highly variable and shows the need for repeat testing in these experiments. These results are important in the context of FFRD because they show that not only the total distance traveled but also the quantity of fuel dispersed from a single rod is essentially random, most likely the result of the internal fuel stack packing behavior. This behavior will likely be more pronounced in future tests using HfO2 fragments as the surrogate fuel.
Fig. 6. Fuel distributions at (a) 4.0, (b) 8.0, and (c) 12.0 MPa.
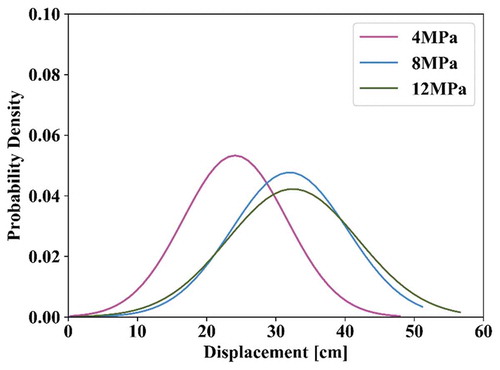
The averages of the distributions from the five tests at each pressure are combined into one normalized distribution and compared in , which shows the aggregate fuel distribution at each pressure with a shorter mean displacement for the 4.0-MPa tests, followed by two very similar fuel distributions at 8.0 and 12.0 MPa. It should be noted, however, that the higher pressure tests may be affected by the boundaries of the tank walls, which might necessitate future testing in a larger tank size.
Fig. 7. Comparison of averaged fuel distributions at 4.0, 8.0, and 12.0 MPa.
After each test, fuel was collected and the volumes were measured to determine the approximate percentage of fuel that was dispersed during the blowdown transient, with the results shown in . In all tests, the upper-limit maximum of fuel dispersion appeared to be just over 40%, which corresponds to the entire upper-fuel stack (above the rupture location). On average, the highest quantity of fuel dispersed was during the 8.0-MPa tests, with the 4.0-MPa tests having the second highest, and the 12.0-MPa tests having the least amount of fuel dispersed. It is possible that the impulse force imparted by the high-pressure test (12.0 MPa) resulted in less dispersion due to the rapid compacting of the fuel stack faster than the fuel could exit the rupture. Nonetheless, the results from each test were highly variable, as observed in the displacement histograms and as can be seen by the very similar upper and lower bounds of fuel loss.
Fig. 8. Fuel loss statistics for 4.0, 8.0, and 12.0 MPa.
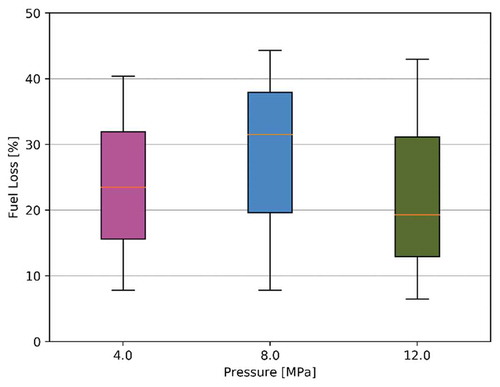
The individual results and total averaged results for the single-rod tests are reported in . For each pressure and subsequent test, the percent fuel loss is reported in addition to the mean displacement μx relative to the burst origin and corresponding standard deviation σx. The average values of the individual tests from each pressure are then averaged to provide a total comparison between each pressure. These values provide numerical context to the results seen in , , and . For the 4.0-MPa tests, it can be seen that fuel loss ranged from 9.1% to 39.1% with a mean value of 23.5%. Likewise, for the 8.0-MPa tests, fuel loss ranged from 9.1% to 43.0% with a mean of 31.5%, and for the 12.0-MPa tests, fuel loss ranged from as low as 7.8% to as high as 41.7% with a mean of 19.3%. For the average mean particle displacement, the 4.0-MPa tests are observed to have the lowest range at 24.0 cm, while the 8- and 12.0-MPa test have a nearly identical average means at 32.0 and 32.4 cm, respectively.
TABLE II Individual and Averaged Results for Single-Rod Tests
III.B. Rod-Bundle and Single-Rod Comparison
A snapshot of the 8.0-MPa rod bundle blowdown at 50, 100, 150, and 1500 ms after simulated rupture is shown in , where the distinct difference in blowdown behavior inside of a 5 × 5 bundle versus that of a single rod from can be seen. As the plume of gas exits the clad rupture, it immediately rises up through the bundle vertically, which acts to simultaneously push any dispersed fuel fragments directly downward into the adjacent subchannels, with some of the particles being carried out of the bundle itself. It was observed during the high-speed video playback that as the fuel begins to collect on the lower grid spacer, it will begin stacking until the weight of the stack collapses on itself and pushes the particles into further adjacent subchannels. In fact, it was noted during these tests that under current experimental conditions the 5 × 5 array appears to be insufficient to capture the total effect of fuel dispersion, as a large quantity of the fuel was pushed outside of the array boundary where it could no longer interact with the rods. Thus, future experiments will be conducted on a much larger array size (17 × 17) in an attempt to capture a more realistic scenario.
Fig. 9. Snapshot of 8-MPa rod bundle blowdown at (a) 50, (b) 100, (c) 150, and (d) 1500 ms.
As in the first series of tests with the single rod, the internal pressure of the rod plenum in the bundle configuration is measured for each test and the results are overlaid in . Similarly, for these tests there appears to be no significant deviation in the plenum depressurization rate between tests.
Fig. 10. Rod internal pressures for rod bundle tests at 8 MPa.
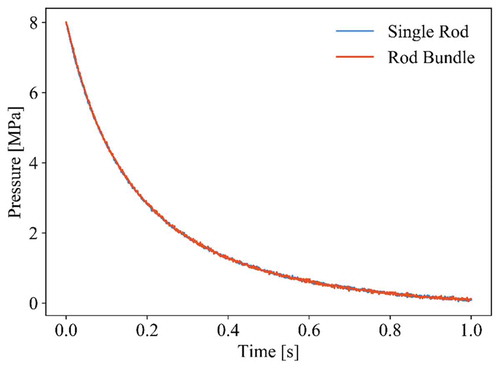
As in the single-rod tests, these data are compared against the depressurization rate of the single rod at 8.0 MPa. The purpose of this comparison is to identify if the adjacent rods in the bundle apply a flow restriction to the gas, inducing a backpressure in the system. As with the first series of tests, the temporal average of the values from all five tests in are averaged and combined into one pressure trace. This is overlaid with the averaged pressure trace of the single rod at 8.0 MPa in , where it can be seen that there is negligible difference between the two. However, this still does not account for the downstream effects that were mentioned in Sec. III.A. Hence there is not expected to be any variation between the single rod and the rod bundle at these conditions.
Fig. 11. Comparison of averaged rod internal pressures for single rod and rod bundle.
In the fuel loss statistics for the single rod versus the rod bundle at 8.0 MPa are compared, where it can be seen that, as in the other tests, there is not a significant difference in fuel dispersion quantities between a single-rod and rod-bundle configuration. Hence, the current experimental parameters don’t appear to influence the average quantity of fuel dispersed into the coolant.
Fig. 12. Fuel loss statistics for single rod and rod bundle at 8 MPa.
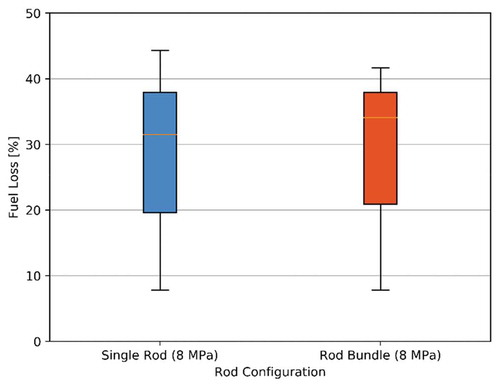
The individual and averaged values for the percentage of fuel dispersed is reported in , where it can be seen that in all but the first test, there was full dispersion of the upper fuel stack (above the rupture location), resulting in approximately 40% fuel dispersion. While this results in an average of 34.1% over the five tests, it is still interesting to note that the final four tests had such similar behavior. This behavior is similar to the single-rod test in which three tests resulted in a near complete upper fuel stack loss. This is compared against the 4.0-MPa single-rod tests in which only two tests resulted in complete upper fuel stack loss, and only one test in the 12.0-MPa single-rod configuration. Thus, from the ten total tests at 8.0 MPa between the single-rod and rod-bundle configuration, 70% of them resulted in complete upper fuel stack loss. Such behavior is significant enough to warrant further tests at this pressure, especially considering the fact that this pressure is also consistent with a large number of observed rupture pressures from previous integral LOCA tests.
TABLE III Individual and Averaged Results for Rod-Bundle Tests
As outlined in and seen in , four of the five bundle tests at 8.0 MPa experienced significant fuel dispersal that resulted in a large debris bed on the lower grid spacer. Thus the same techniques for analyzing particle displacement from the single-rod tests could not be applied for these tests. The differences in the low- and high-percentage dispersion tests are shown in , in which it can be seen that in the case of full upper fuel stack dispersal () the debris bed extends to the edge of the 5 × 5 assembly, with a significant amount of fuel dispersed well past the boundary.
Fig. 13. Bundle tests at 8 MPa with (a) 9.1% and (b) 40.4% fuel dispersion.
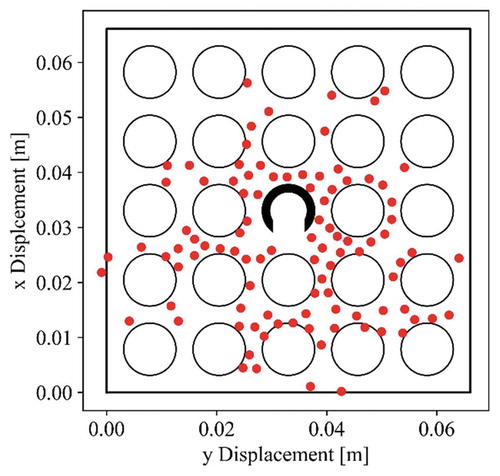
Given the small quantity of fuel dispersed in the first test (), the posttest images could be processed to obtain an approximate in-plane (x-y) fuel distribution on the lower grid spacer. This is shown in with the burst rod in the center and the orientation of the rupture opening. It can be seen more clearly from that most of the fuel was deposited in the adjacent subchannels to the burst rod, with a larger percentage of the fuel in front of the burst and with a small percentage of reflection.
Fig. 14. Approximate x-y fuel distribution on lower grid spacer for bundle test 01.
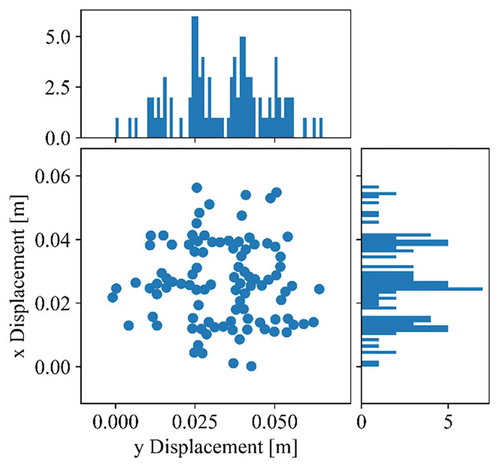
The x-y data from are then synthesized to produce the x and y histograms for particle deposition in , where it can be seen that the particles have a fairly normal spatial distribution with a slight leftward skew in the y-plane and a slight forward skew in the x-plane relative to the burst orientation. This distribution is expected given that the burst orientation was toward the immediately adjacent rod, however this will provide for an important comparison in future tests in the bundle to characterize fuel deposition as a function of burst angle.
Fig. 15. Approximate x-y fuel distribution with histograms for bundle test 01.
IV. SUMMARY
This paper represents a series of tests conducted at OSU as part of an ongoing investigation into the fuel dispersion aspect of rod failure during a LOCA. Previous experimental results showed differing behavior between the quantities of fuel dispersed in a single-rod and rod-bundle orientation, thus this series of testing aimed to expand upon those results and answer some of the questions that arose from testing. Five tests were repeated each at 4.0, 8.0, and 12.0 MPa for a single-rod configuration, and the pressure transducer instrumented on the gas plenum line showed a negligible difference in depressurization rates between tests. It was noted, however, that the relatively small size of the solenoid valve orifice connecting the gas plenum to the fuel rod may influence gas communication between the two volumes, which necessitates modifications to the experimental setup to add a downstream pressure transducer. Measurements on the radial displacement of surrogate fuel particles showed significant variation at each pressure and also between repeated trials at each pressure. This indicates that there is a stochastic component to the interface between the gas and the fuel upon depressurization, likely due to the randomness of the fuel packing within the rod. Similarly, five tests were performed in a rod-bundle configuration that were consistent with the results from the single-rod tests, indicating a variable amount of fuel dispersion between tests but no change in depressurization rates. Hence it appears that the random nature of fuel stacking within the cladding appears to mostly affect these parameters. Testing in the bundle configuration also showed that a 5 × 5 array size proves to be too small to capture the full spatial effect of fuel dispersion, as a large amount of fuel was deposited well past the assembly boundary. Furthermore, the height of the debris bed and large local concentration of surrogate particles on the grid spacer could not be analyzed for individual particle displacement by the same techniques as in the single-rod tests, so a new technique will be employed in future testing that includes a larger array size.
Acknowledgments
This work was funded under U.S. Department of Energy contract DE-NE0008441 through a Laboratory Directed Research and Development Award in collaboration between OSU and INL, release number 38. The authors would like to extend their gratitude to the reviewers of this manuscript for their insightful observations and suggestions. Their recommendations significantly improved the quality and content of this manuscript relative to its original form, and for that the authors are grateful.
References
- “Nuclear Fuel Behaviour in Loss-of-Coolant Accident (LOCA) Conditions,” 6848, Nuclear Energy Agency (2009).
- W. K. ERGEN et al., “Emergency Core Cooling,” 24226, U.S. Atomic Energy Commission (1968).
- M. E. FLANAGAN, P. ASKELJUNG, and A. PURANEN, “Post-Test Examination Results from Integral, High-Burnup, Fueled LOCA Tests at Studsvik Nuclear Laboratory,” NUREG-2160, U.S. Nuclear Regulatory Commission (2013).
- T. MANNGÅRD and J. STENGÅRD, “Evaluation of the Halden IFA-650 Loss-of-Coolant Accident Experiments 5, 6 and 7,” 2014:19 ISSN: 2000-0456, Swedish Radiation Safety Authority (2014).
- G. E. RUSSCHER et al., “LOCA Simulation in the NRU Reactor—Materials Test 1,” NUREG/CR-2152-V1 U.S. Nuclear Regulatory Commission (1981).
- B. ADROGUER, C. HUEBER, and M. TROTOBAS, “Behaviour of PWR Fuel in LOCA Conditions—PHEBUS Test 215,” IWGFPT–16, CEA, Cadarache, France (1983).
- M. BRUET et al., “High Burnup Fuel Behavior During a LOCA Type Accident: The FLASH-5 Experiment,” IAEA-TECDOC–706, CEA, Grenoble, France (1982).
- E. H. KARB et al., “KfK In-Pile Tests on LWR Fuel Rod Behavior During the Heatup Phase of a LOCA,” KfK 3028, Keinforschungszentrum Karlsruhe (1980).
- J. R. LARSON, D. R. EVANS, and R. K. McCARDELL, “Results of the First Nuclear Blowdown Test on Single Fuel Rods (LOC-11 Series in PBF),” CONF-781022-35, Idaho National Engineering Laboratory (1978).
- “Report on Fuel Fragmentation, Relocation, Dispersal,” NEA/CSNI/R(2016)16, Nuclear Energy Agency (2016).
- P. A. C. RAYNAUD, “Fuel Fragmentation, Relocation, and Dispersal During the Loss-of-Coolant Accident,” NUREG 2121, U.S. Nuclear Regulatory Commission (2012).
- N. E. TODREAS and M. S. KAZIMI, Nuclear Systems Volume 1: Thermal Hydraulic Fundamentals, 2nd ed., CRC Press (2012).
- C. STOOTS et al., “A Large-Scale Matched Index of Refraction Flow Facility for LDA Studies Around Complex Geometries,” Exp. Fluids, 30, 391 (2001); https://doi.org/10.1007/s003480000216.
- R. BUDWIG and R. WESTIN, “Measurement of Oil Properties,” University of Idaho (2011).
- S. J. DAGBJARTSSON et al., “Axial Gas Flow in Irradiated PWR Fuel Rods,” TREE-NUREG–1158, EG&G (2011). ( 1977).
- W. WIESENACK, L. KEKKONEN, and B. OBERLÄNDER, “Axial Gas Transport and Loss of Pressure After Ballooning Rupture of High Burn-Up Fuel Rods Subjected to LOCA Conditions,” presented at the Int. Conf. Physical Reactors, p. 1, Interlaken, Switzerland (2008).
- T. MANNGÅRD, A. MASSIH, and J.-O. STENGÅRD, “Evaluation of the Halden IFA-650 Loss-of-Coolant Accident Experiments 2, 3, and 4,” 2014:18 ISSN: 2000-0456, Swedish Radiation Safety Authority (2014).
- M. FLANAGAN, “Mechanical Behavior of Ballooned and Ruptured Cladding,” NUREG-2119, U.S. Nuclear Regulatory Commission (2012).