
Abstract
The Kilowatt Reactor Using Stirling TechnologY (KRUSTY) was a prototypic nuclear-powered test of a 5-kW(thermal) Kilopower space reactor. This paper presents results from the KRUSTY nuclear system test, which operated the power system at various temperatures and power levels for 28 consecutive hours. The testing showed that the system operated as expected and that the reactor is highly tolerant of possible failure conditions and transients. The key feature demonstrated was the ability of the reactor to load-follow the demand of the power conversion system. The thermal power of the test ranged from 1.5 to 5.0 kW(thermal), with a fuel temperature up to 880°C. Each 80-W(electric)–rated Stirling converter produced ~90 W(electric) at a component efficiency of ~35% and an overall system efficiency of ~25%.
I. INTRODUCTION
The Kilowatt Reactor Using Stirling TechnologY (KRUSTY) was designed to be representative of a 5-kW(thermal) Kilopower space reactor.Citation1 KRUSTY was designed, developed, manufactured, and tested for <$20 million, with final testing completed in March 2018.
Kilopower reactors are designed, via simplicity, as load-following systems; i.e., the reactor will first-order provide whatever thermal power is demanded from it. The passive response of the reactor is similar to a household thermostat: If the temperature gets too cold, the fission power/heat kicks on and vice versa. The temperature or thermostat setpoint is determined by the amount of reactivity insertion (i.e., the control rod position) and the passive temperature feedback of the reactor.
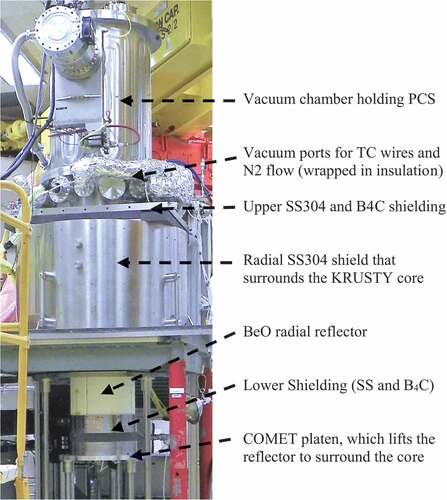
KRUSTY was designed with flight prototypic materials and full-scale components to study the reactor dynamics at full power. The design allowed the testing of several nominal and off-nominal conditions, which ultimately verified that the reactor could tolerate any credible worst-case conditions without active reactor control. Accompanying papers in this special issue provide additional detail about the reactor design,Citation2 power conversion systemCitation3 (PCS), regulatory approvals,Citation4 and KRUSTY testing prior to the full nuclear system test.Citation5–Citation7 These references include numerous design drawings and hardware photographs. A few photographs are included in this paper to provide the basics of the KRUSTY design. shows the KRUSTY core, shows the PCS, shows the KRUSTY in-vacuum and ex-vacuum subassemblies prior to mating, and shows the fully assembled KRUSTY configuration the morning of the test.
Fig. 1. KRUSTY core assembly. (a) Heat pipes fit within the slots in the HEU UMo fuel. (b) Core after the installation of the Haynes 230 rings that clamp the heat pipes to the fuel (via interference fit). White BeO axial reflectors seen on top and bottom. Some parts in the photographs are part of the temporary assembly fixture, which is later removed.
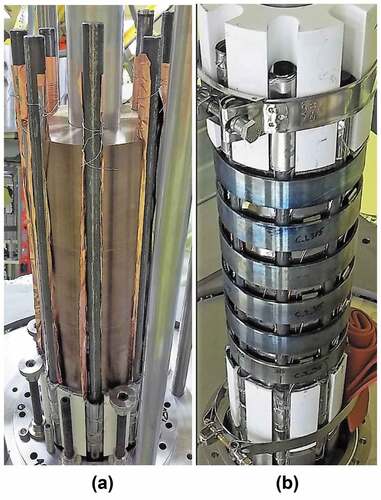
Fig. 2. The KRUSTY PCS consists of two 80-W–rated Stirling converters and six simulators (which mock the thermal behavior of the converters). At the bottom is the flange for the vacuum vessel. Over 100 TC wires and connections are packed between the flange and the PCS.
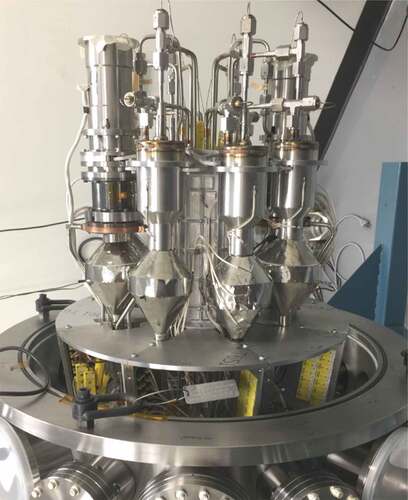
Fig. 3. The vacuum chamber (left) containing the core (inside lower left) and PCS (inside upper left) is lifted to be installed on COMET (right), which holds the large SS304 shield (upper right) and the lower shielding on the platen (lower right).
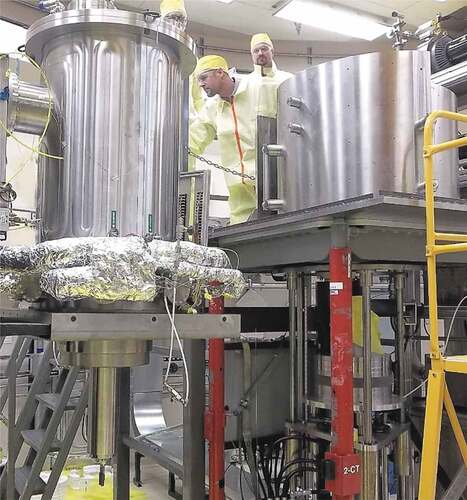
Fig. 4. KRUSTY ready to go the morning of the final test.
II. OBJECTIVES AND TEST PLAN
The overarching goal of the KRUSTY project was to show that a useful reactor power system could be designed, built, and tested quickly and affordably. When KRUSTY was envisioned, one of the biggest obstacles to developing a space fission system was the perception of high cost, based on the results of previously failed programs. There were three high-level objectives for the KRUSTY nuclear system test:
1. Operate the reactor at steady state with a thermal power output of 4 kW at a temperature of 800°C.
2. Verify the stability and load-following characteristics of the reactor during nominal and off-nominal conditions.
3. Provide data to benchmark codes and material data.
There were several testing phases during the 3-year KRUSTY project. In year one, mechanical prototyping and testing were performed in tandem with the system design. In year two, electrically heated testing was performed on various components and system mock-ups. In year three, a full electrical test was followed by cold (zero-power) criticality testingCitation6 and then warm (nuclear-powered) criticals.Citation7 The primary purpose of all of this testing was to prepare for the final nuclear system test.
For the nuclear system test, the goal was to devise a test plan that allowed as many reactor transients as possible while also allowing enough settling time between transients to approach steady state. The testing window was restricted to 28 h to limit activation of the facility and to allow a manageable staffing plan for operators, supervisors, and required facility and safety personnel. The 28-h time limit was not directly imposed by anyone; rather, it was a consensus among the stakeholders that balanced the goals and concerns of all parties.
The test plan itself evolved as electrical, zero-power critical, and warm critical testing proceeded. Following the 60 ¢ run,Citation7 the transient FRINK modelCitation8 was quickly benchmarked to give an informed prediction of typical power/temperature oscillations. The updated FRINK model predicted an oscillation period of ~15 min (depending on the power draw) and that most transients would dampen in three or four oscillations. Thus, it was decided to initiate a new transient every hour, except for a longer period for start-up and the final, loss-of-active-cooling transients.
It was very beneficial to have flexibility in the test plan in order to incorporate knowledge gained on the fly during the criticals and the final test itself. The envelope of the testing was strictly limited within the safety basis (e.g., fuel temperature must stay <900°C), but the actions taken during the 28 h were flexible as long as all actions and readings were authorized within the safety basis. The final test plan was not completed until the night before the test, and even then, changes were made as the 28 h proceeded to try to maximize the benefit of the test as it evolved. None of the changes were major (they mostly involved event timing and sequence), but in the end, the KRUSTY test was more valuable because a rigid test plan/sequence had not been imposed.
III. NUCLEAR SYSTEM TEST
On March 20, 2018, the KRUSTY nuclear system test was conducted at the Nuclear Criticality Experiments Research Center within the Device Assembly Facility (DAF) and the National Nuclear Security Site in Nevada. The nuclear system test investigated the nuclear-powered performance of the fully integrated KRUSTY reactor and PCS and included all events that occurred within a 28-h test window. The nuclear system test is sometimes referred to as the 28-Hour Run or the Full-Power Run, although Full-Power Run can be confusing because the reactor ran at similar fission powers during the warm criticals.
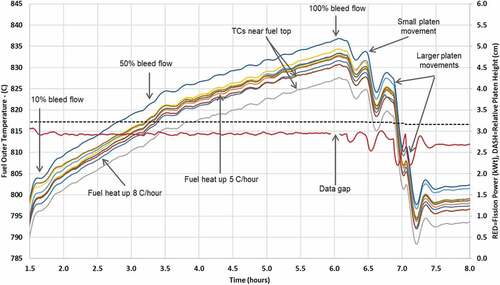
shows a condensed version of the results over the entire 28 h of the nuclear system test. The timescale in and all subsequent plots is in hours, relative to planned test start time “T-0” of 10 a.m. Pacific Daylight Time (PDT).
Fig. 5. Power and temperature data from the 28-h KRUSTY nuclear system test.
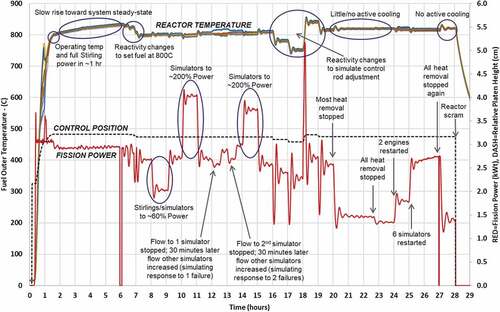
III.A. What Exactly Is Plotted?
and subsequent plots display three types of measurements. The majority of the curves plotted depict fuel thermocouple (TC) data. These TCs are spring-loaded on the outside surface of the fuel, separated by a 0.001-in. layer of Mo to protect the fuel. A careful look at reveals the edges of some of the rectangular spring clips and a few TC wires. During the warm criticals it was discovered that the coupling of the TCs to the fuel is rather poor at low temperature. However, once the core heats to a few hundred degrees Celsius, core expansion appears to create good thermal contact, as evidenced by a <5°C variance between individual TCs in geometrically symmetric positions.
Each plot contains a red line that represents fission power, although the actual measurement is an amp reading from a neutron detector and fission power was later normalized to amps. The fission power is the total prompt energy (i.e., does not include decay power) distributed throughout the entire system: with ~94% to the fuel, ~2% to the reflectors, and ~4% to the shielding. The amount of decay power depends on the prior fission history of the transient. A very rough approximation is that after ~1 min of steady operation, decay power would be ~3% of fission power, after 5 min it would be 4%, after 30 min it would be 5%, and after 24 h it would be 6%. So, for most of the test, the actual thermal power is 5% to 6% higher than depicted by the red fission power curve.
A dotted-black line on each plot depicts the relative platen (lift table) position. KRUSTY’s reactivity is changed by axial movement of the BeO radial reflector on the COMET platen. The value displayed was normalized so it could be cleanly co-plotted along with other variables on a common scale. For reference, a relative platen position of 3.86 cm would represent the platen being fully closed. Specifically, the relative platen position is the distance from the top edge of the BeO on the platen to a plane 4.41 cm below the top of the fuel (when both are at room temperature). Thus, when fully closed, the top of the platen BeO would be 0.55 cm below the top of the fuel.
Some figures in this paper plot other TC readings: for heat pipes, reflector, shield, and PCS components. There were also many specific measurements recorded from the Stirling converters, e.g., voltage, current, displacement, frequency, etc.
IV. START-UP
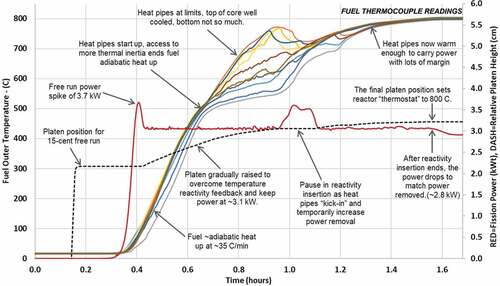
At 10:03 a.m. PDT, the COMET platen was actively lifted to begin the nuclear system test. provides a detailed look at the power, fuel temperature, and platen position for the first 1.7 h of the nuclear system test.
Fig. 6. Start-up data from the KRUSTY nuclear system test.
IV.A. 15 ¢ Reactivity Initial and Adiabatic Heatup
Start-up was initiated in the same manner as the preceding warm criticals,Citation7 i.e., with a 15 ¢ free run.
At T = 0.15, the dotted-black line shows the platen being raised. At T = 0.17, the platen then reaches the position that created 15 ¢ of excess reactivity in the reactor. This amount of cold excess reactivity caused the fission power to increase exponentially at a reactor period of ~50 s; i.e., the reactor power increased by a factor of e (2.718) every 50 s. The starting power (at T = 0.17) was only tens of microwatts. Prior to criticality, the power was dictated by subcritical multiplication of the neutron source. It then took almost 10 min until the power (red curve) reached a level noticeable on a linear, non-log scale. At T = 0.38, sensible heating of the core is indicated by the increase in the fuel TC readings (multiple colors in ). In reality, the heating started a couple of minutes sooner, but as noticed in previous tests, there was a time lag in the TC response. This was because the TCs were not physically bonded to the fuel, and at room temperature, the thermal coupling was rather poor. Fortunately, after the fuel heated up to ≫100°C, the expansion of the fuel created forcible contact between the TCs and fuel, so after that, they achieved a very good thermal bond. After start-up, the readings of the core TCs appear to be relatively accurate.
After T = 0.38, significant heating of the fuel started to create negative reactivity feedback (mostly due to fuel thermal expansion), and at T = 0.41, the power “turned over” after reaching a peak of ~3.7 kW. As planned, this was the same transient profile that was seen in the 15 ¢, 30 ¢, and 60 ¢ runs, which gave the green light for the test to proceed.
Once the power dropped to <3 kW, the COMET operator began to raise the platen. The operator was instructed to raise the platen (by pushing forward the COMET control joystick) whenever the reading from the 3He neutron detector (linear channel ion chamber) dropped below 5.5e-6 amps, which was the value normalized to 3 kW. This was the same procedure used for the 30 ¢ and 60 ¢ runs, except that the operator was instructed to continue reactivity insertion until the fuel temperature reached 800°C. This movement of the platen can be seen in . Starting at T = 0.42, reactivity was inserted slowly and intermittently to keep power at ~3 kW. For the next several minutes, the fuel temperature increased at a rate of ~35°C/min, which is roughly equivalent to the adiabatic heatup rate of the core at 3 kW.
IV.B. Heat Pipe Start-Up
KRUSTY was the first-ever operational heat pipe–cooled reactor, i.e., a reactor in which heat pipes removed a significant fraction of the power. The KRUSTY heat pipes contained a wick only at the lower end, which connected the pool/reservoir region below the fuel to the top of the evaporator region (just above the fueled height of the core). The remainder of the heat pipe operated with thermosiphon action; i.e., fluid return was driven by gravity instead of capillary forces. It would have been preferable to have a full-length heat pipe for several reasons (even for KRUSTY performance because the thermosiphon flooding limit for this design was rather low), but this design was quick and inexpensive to fabricate. Technically, it can be debated whether the KRUSTY devices should be called heat pipes, thermosiphons, and some hybrid designation, but to simplify the discussion they are merely called heat pipes. After start-up, when the heat pipes are operating at temperatures above their throughput limits, the dynamic performance of the system would be similar regardless of heat pipe versus thermosiphon physics; i.e., both would essentially operate as an infinite conductor relative to the rest of the system (as the test data confirmed for the KRUSTY heat pipes). Therefore, all of the system dynamics tested after start-up should be representative of any heat pipe or thermosiphon design that might be used for Kilopower reactors.
At T = 0.63, the core temperature reached 500°C, and the heat pipes began to operate; i.e., at <500°C there was enough Na vaporization within the heat pipes to transfer significant power. After the heat pipes turned on, the core gained access to the thermal mass (mass times specific heat) outside of the core. Consequently, the rise in fuel temperature decreased because reactor power was now shared between the core and material downstream of the core (e.g., shield, condenser, and PCS components).
At T = 0.67, the core TCs started to significantly diverge. The TCs near the bottom of the core resumed a heatup rate close to the adiabatic value (~30°C/min) while the TCs near the top were cooled very well. This is a clear indication that the heat pipe was struggling to remove power from the bottom of the core. The large heat transfer area at the cold condenser end was apparently causing rapid condensation of Na vapor, which maintained low pressure at the condenser and enabled a continued flow of Na vapor. This condition persisted for >10 min because the high thermal mass of the condenser/Stirling region prevented the cold end from heating more rapidly. Meanwhile, the physical properties of the Na liquid at ~500°C did not allow enough return fluid flow to cool the entire core. Any liquid Na that was able to return to the core was evaporating as soon as it reached the upper regions of the core, and no Na was reaching the bottom of the core, which would explain the adiabatic heatup rate. This is the behavior of a heat pipe or thermosiphon that has reached its viscous limit.
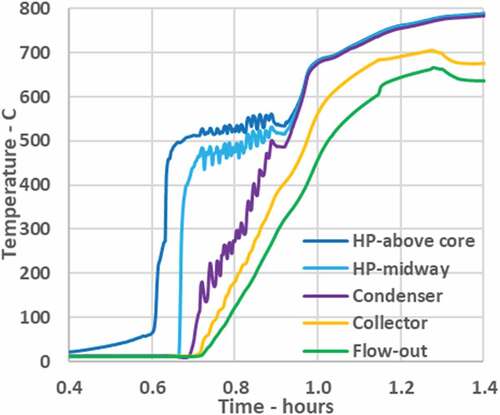
plots the steady-state power limits for the heat pipes based on a mostly empirical throughput model. The heat pipe throughput model was generated in Excel by curve-fitting individual heat pipe test results obtained at Glenn Research Center (GRC) and in some cases extrapolating via Na state equations. shows the average TC reading of the six Stirling thermal simulators. The first TCs to rise in are the TCs attached to the heat pipes just above the core. They were placed close enough to the core to gain heat via thermal conduction, plus a little thermal radiation from the axial reflector and a very small amount of neutron and gamma power deposition. At T = 0.6, the core has reached a temperature of ~400°C, which is warm enough for a small amount of Na vapor to start heating the heat pipe above the core; the viscous limit does not matter yet because the supply of Na in the core/pool is still robust (no return flow is needed).
Fig. 7. KRUSTY heat pipe limits predicted by throughput model.
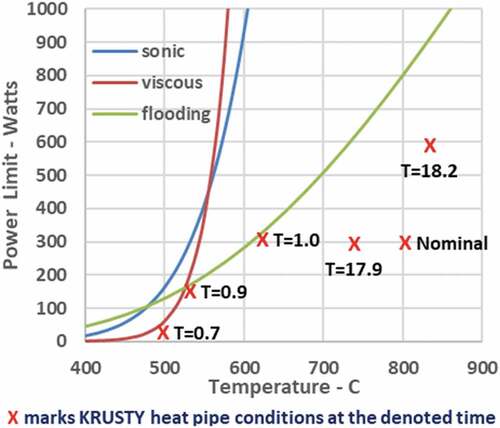
Fig. 8. Average temperatures of all six simulators.
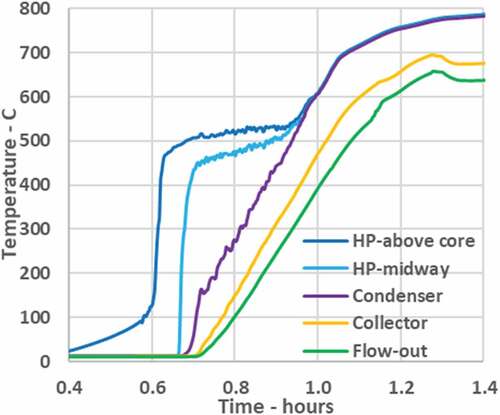
During start-up, the first Na vapor that arrives to a cold, room temperature region will start to freeze (high viscosity to the extreme!). If there is ample Na supply in the evaporator/pool, more vapor deposition will heat that region until it eventually thaws. The heat pipe develops a thaw front, which moves along the heat pipe from the evaporator to the condenser. In , the thaw front reaches the TCs just above the core at T = 0.61, the midway TCs at T = 0.67, and the condenser TCs at T = 0.69; thus, it took ~5 min for the thaw front to travel the length of the heat pipe. Note that each individual heat pipe reached these states at different times and that the data in are the average of six heat pipes. Also note that midway is actually more than halfway from the core to the condenser.
As the thaw front progressed along the tube, more Na fluid started to return, although if needed, the pool could still make up for additional unreturned Na. At T = 0.69, the condenser TCs rose rather quickly for a couple of minutes, but then at T = 0.71, the response from all TCs started to show different behavior. This is the point where there was not enough liquid Na available to the evaporator. Technically, the heat pipe had not reached its viscous limit (which would apply when the heat pipe is near isothermal), but the effect is the same; i.e., not enough Na was returning to the evaporator.
presents a rather clean look at the heat pipe temperatures because this plot shows the average of the six heat pipes attached to Stirling simulators. Some temperature oscillations can be noticed in and between T = 0.7 and T = 0.9, but their magnitudes are dampened due to the averaging. These oscillations were much larger for some individual heat pipes than others. The heat pipe at the 135-deg azimuth had the largest temperature oscillations, and these temperatures are shown in . This heat pipe was experiencing up to 30°C temperature swings approximately every 30 s. Most likely, the condensing Na was too cold/viscous to flow back down the pipe, so the core heated up rapidly and caused an increase in Na vapor flow rate and temperature. This extra energy then warmed up all of the collected Na in the condenser to a point where its viscosity was reduced, and a rather large slug of liquid Na flowed back down the pipe. This cooled everything back down, and the cycle would repeat until the condenser became warm enough that it did not overcool the liquid. At T = 0.92, the temperature of the condenser apparently caught up to the rest of the heat pipe; at this point, the heat pipe would be considered started up.
Fig. 9. Temperatures of the 135-deg simulator.
Despite the irregularity and unpredictability of the heat pipe performance during start-up, the reactor power was successfully transferred from the core to the condenser during this period. There was enough Na inventory margin, and the adiabatic heatup rates were low enough that no significant problems were caused by stressing the heat pipes, except for some anxiety in the control room as some of the fuel TCs were climbing much faster than others and the bottom of the core was reading 200°C higher than the top. If any of the fuel TCs had reached 800°C, then according to procedure the operator would have stopped adding reactivity until the temperatures were <800°C and the power was <3 kW.
In the end, the heat pipes were in line with the KRUSTY philosophy of being “good enough.” Future flight systems can prevent this sort of heat pipe behavior in two ways, via proper heat pipe design (as opposed to quick, inexpensive, and good enough) and/or a slower, less aggressive reactor start-up. Recall that the goal of KRUSTY was to maximize useful data within a 28-h window, so rapid start-up was preferred to allow more time for full-power operations. Actually, the rapid start-up also provided useful data that can help determine what optimum start-up times should be used in the future.
IV.C. Heat Pipe Throughput Limits Increase Significantly
At T = 0.92, after the condenser temperature had finally caught up to the rest of the heat pipe, the heat pipe would technically be considered viscous limited. From this point on, the reactor power starts to uniformly heat up the core and the entire heat pipe and move the heat pipe away from the temperature-limited regime. From T = 0.92 to T = 0.98, the heat pipes warmed from 500°C to 600°C. Very quickly, the strict viscous limit was removed, and the less restrictive flooding limit took over. The steady-state throughput limit increased from ~30 to ~300 W, and the oscillations disappeared.
At T = 0.98, one of the most interesting features of the KRUSTY test occurred: The fission power increased above the 3-kW target for start-up. This represented the first load-following transient of the test. Prior to this point, total power draw from the core did not exceed 3 kW due to the heat pipe limits. At T = 0.98, the total thermal losses from the core through the multilayer insulation (MLI) were likely between 300 and 400 W; therefore, the heat pipes were likely removing ~2.6 kW, or 325 W, per heat pipe. As seen in , the heat pipe temperature at that time was ~600°C, and shows that the throughout model predicted a power of ~300 W (so the model agreed within 10%).
shows that the model predicts that the throughput limit increases from 300 to 500 W when the temperature increases from 600°C to 700°C. This explains the rise in fission power at T = 0.98; as the heat pipe temperature continued to rise above 600°C, the heat pipes could then remove >325 W each. Once the heat pipes (plus thermal losses) were able to remove more power than the reactor was generating, the average fuel temperature started to drop. This increased the core reactivity (mostly caused by decreased neutron leakage due to increased fuel density), so the power started to increase. Power increased for a few minutes, as the core effectively load-followed the increased power removal of the heat pipes. Eventually, the thermal mass of the Stirlings became adequately soaked (i.e., reached a near-equilibrium temperature), so they accepted less power from the condensers, causing power to drop. The irregularities in the power hump between T = 0.98 and T = 1.10 occurred because individual heat pipes kicked in at different times.
The power was >3 kW for ~8 min, so in accordance with the test plan, the platen was not raised at all during this time, as seen in . also shows the core TCs all converging back together as the heat pipes kicked in.
Ultimately, this uncontrolled power increase demonstrates a potential negative of a load-following reactor. If for some reason too much power is demanded, then the reactor will provide that power, with potentially negative consequences—perhaps problematic boiling in heat pipes, increased reactor stresses, increased dose rates to sensitive components, etc. This could occur if the reactor suddenly gained access to a very large amount of thermal mass and the heat pipe throughput limits were much higher than their nominal operating power. Ironically, the heat pipe performance limits play a positive role in mitigating this scenario; as the core heats up, the power transfer to the colder thermal mass is throttled by the heat pipe limits. Even if the core were at full temperature, the heat pipes would still be limited by throughput limits; i.e., they could only exceed nominal power by the margin built into their design. The only risk in this case would be the recoverability of the heat pipe after it reached its limit, which as seen with the results above was not a problem for KRUSTY.
All of the hypothetical issues discussed above can be easily avoided with good design and engineering and/or a slower start-up that would bring up the temperature of potentially well-coupled thermal mass more in unison. The KRUSTY start-up was rather fast but was still a long way from having the potential for an excessive uncontrolled power increase. shows that the power increased from 3 to 3.6 kW, which is a long way from the rated power of 5 kW. Also, given the adiabatic heatup rate, a power >10 kW could have been tolerated for several minutes (although as seen in , even at elevated temperatures the heat pipes’ limits would not have allowed 10 kW to be removed). After start-up there was no possibility of an issue because the Stirlings could not physically remove more power than the reactor could tolerate. In fact, any practical Kilopower system design would be limited by the amount of power the PCS could remove (likely limited by either the converters’ limits or the heat rejection capability), not by how much power the reactor could tolerate.
IV.D. Stirling Converter Start-Up
At T = 1.10, the operator resumed raising the platen because both of the reactivity insertion criteria were met: TCs <800°C and fission power <3 kW. The heat pipes were now operating below their throughput limits, so from this point on they effectively behaved as infinite conductors within the system dynamics; i.e., the Stirlings might as well have been connected directly to the core (except for a small temperature drop and a little thermal mass).
The next key moment was to start up the Stirlings. Note that in this paper and other papers in this special issue, “Stirlings” refers to both the Stirling converters and the Stirling thermal simulators. The words “converter” and “simulator” are used to distinguish between the two when needed. A description of the converters and simulators is provided in Ref. Citation3.
At T = 1.14, the two Stirling converters were turned on as planned, when the hot-end TCs reached >650°C, which is the nominal operating point of the converters. plots the heat pipe, condenser, hot end, cold end, and local fuel temperature for the two KRUSTY converters.
Fig. 10. Temperature data for the Stirling converter modules.
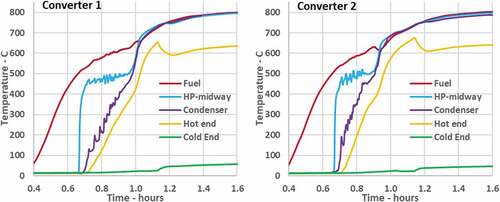
The moment the Stirling converters were turned on is evident by the drop in hot-end temperature at T = 1.14. Note that from T = 0.70 to T = 1.0, Converter 2 warmed up faster than Converter 1 and at T = 1.14, Converter 2 was 25°C warmer at start-up: 675°C versus 650°C. It appears that the heat pipe attached to Converter 1 struggled more during start-up, i.e., had slightly lower throughput limits. The slower heatup could also indicate poor thermal bonding between the components of Converter 1, but that is less likely because the delta-Ts between the fuel and heat pipe, and condenser and hot end are similar.
takes a closer look at the temperature profile from the fuel to the hot end at start-up (note the condenser TC for Converter 1 became unreliable at T = 1.36 and is not plotted after that time). After the converters were turned on and the displacer began to move, the He gas flow within the engine cooled the hot end by ~65°C over the first few minutes. As the system came to equilibrium, a temperature gradient of ~165°C was established between the fuel and the hot end. The temperature difference from the fuel to condenser was only 20°C, which indicates good thermal bonding. The temperature difference from the condenser to the hot end was 145°C, which indicates rather poor thermal bonding. This was expected and was demonstrated in electrical testing because the available (off-the-shelf) Stirling converters were not well suited for mating with a heat pipe (they were designed for heat input from a radioisotope source).
Fig. 11. Temperature and power for the Stirling converters.
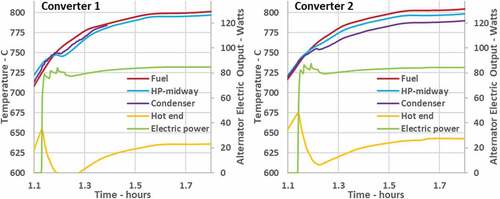
also shows the rise in cold-end temperature after the converters were turned on, as waste heat was transferred across the converter. The cold ends of the converters were held at ~60°C by a chiller. Note that this is likely colder than most practical in-space applications, depending on the mechanism of heat rejection; however, the converters were successfully demonstrated over a wide range of potential in-space cold end temperatures during testing at GRC.
also plots the electrical output of the converters, and the data confirm that both converters were operating smoothly and as expected. The converters were rated at 80 W(electric) for Thot = 650°C and Tcold = 100°C. The converters actually produced more than 80 W(electric) because the chiller was holding Tcold at ~60°C; therefore, the converters operated at a higher Carnot efficiency. The actual output at T = 1.70 was ~85 W(electric) at Thot = ~640°C. The corresponding thermal input to the converters was ~265 W, which indicates the converters were operating at ~33% efficiency at this state point.
shows several spikes in the electrical power after the converters were started. This is because the command voltage was initially set for a reduced piston stroke and then increased incrementally toward the nominal voltage/stroke (note that a larger stroke results in a larger flow rate of He within the engine, thus more power removal from the hot end). Each time the stroke was increased, there was a power spike followed by a drop in power as the hot end cooled off (due to the increased He flow).
It was reassuring that both converters performed almost identically to each other. There were sometimes small differences in converter power and temperature, but those were caused by heat transfer and temperature differences. Individually, the converters each responded reliably and predictably to their thermal conditions.
IV.E. Stirling Simulator Start-Up
Soon after the two Stirling converters were started, nitrogen flow was initiated through the six Stirling simulators. The simulators were designed to mimic the heat removal of the collector in the converters at nominal conditions, and the power draw was controlled by specifying the N2 flow rate. The actual power removal by the simulators is a function of the gas flow rate, the inlet/outlet temperatures, and the passive losses from the simulator body; however, the exact power removal was not always easy to determine. Many components were near the simulators and the gas-inlet TC that complicated the actual thermal balance. Also, the flowmeters experienced a widely varying temperature and radiation environment such that their readings/calibration may also provide significant uncertainty. It was noted that the calibration of the flowmeters was not as easy when plugged in at the DAF as when plugged in at NASA GRC, which might have indicated another issue.
Overall, the diagnostic data from the simulators provided a good estimate of the power draw from the simulators during nominal, steady-state conditions. As the system moved away from nominal conditions, and especially during transients, several factors complicated the estimation of power draw. Therefore, the actual power draw by the simulators during some phases of the test is less certain than others. It is hoped that more detailed modeling benchmarking can improve power draw estimates. Like all other aspects of KRUSTY engineering, several design and technology improvements could have been implemented for the simulators and diagnostics, but given the limited time and resources, the team decided to focus on the primary goals.
At T = 1.17, the N2 flow rate to each simulator was initiated at a low level. The effect is small but noticeable on the collector and gas-out TCs in and . The collector is cooled slightly while the gas-out TC jumps higher; note that the location of the gas-out TCs is slightly downstream of where the heat is actually added to the gas. At T = 1.28 and T = 1.30, the flow rate was increased, which ultimately caused the collector and gas-out TCs to drop. After a few additional tweaks, the simulator flow rate was set to its nominal value at T = 1.50 and was left unchanged for the next 6.5 h.
In , the effect of starting up the converters and simulators is remarkably absent. Some of the fuel TCs were affected at T = 1.18, but the majority of them appear unaffected by either converter or simulator power removal. The power curve in is also unaffected. There are two reasons for this: (1) the operator is still following the reactivity insertion protocol, which is intended to keep the power constant at ~3 kW, and (2) the power that was previously heating the thermal mass of the Stirlings is now instead being actively drawn by the Stirlings (plus a bit more). From T = 1.15 to T = 1.25, it can be seen in that platen movement was paused, and perhaps the power increased a little due to increased power through the heat pipes. If the power draw had been significantly higher, then the power would have increased above 3 kW, as it did previously when the heat pipes kicked in.
IV.F. End of Reactivity Insertion
From T = 1.25 to T = 1.55, the platen was slowly raised until the fuel temperature reached 800°C. At this time, and for the remaining 26.5 h, all of the heat pipes were performing very well because they were operating well below their throughput limits. shows that the rate of insertion became considerably slower as the fuel approached 800°C; the rate was relatively high at T = 0.42, when the core temperature was only ~150°C, and then decreased significantly from then on. The rate of reactivity insertion was an indication of how much fission power was being used to heat the core thermal mass. At T = 0.42, most of the power was heating the core, while at T = 1.50, the majority of power was sustaining the thermal draw of the Stirlings and passive losses. The more the core heated, the higher was the resulting negative reactivity feedback, and the quicker the core power would drop below 3 kW, thus requiring another reactivity insertion by the operator.
The data in are actually the platen position, not the reactivity insertion. The reactivity insertion cannot be directly measured when active feedback or system temperature change is occurring; i.e., it can only be done effectively by zero-power criticals. shows the model predictions of the reactivity worth of the platen movement. The data in are a combination of the results of the zero-power criticals and modeling. The actual worth of the platen movement could not be measured when KRUSTY was more than 80 ¢ supercritical because of the operational safety basis (and the practicality of measuring a very short reactor period). There are two curves shown in , representing the warm and cold temperature conditions of the core. The reactivity worth of moving the platen/BeO is slightly higher when the core is warm because there is increased neutron leakage from the fuel; i.e., the radial reflector has more relative impact. shows that the calculated reactivity worth of moving the platen was greater at T = 0.42 (~12.0 ¢/mm given the platen height of 2.16 cm) as compared to T = 1.5 (~10.7 ¢/mm given the relative platen height of 3.21 cm). The worth of moving the platen diminishes as the top of the BeO moves into regions of lower neutronic importance, or in this case away from the center of the core.
Fig. 12. Reactivity worth of platen movement.
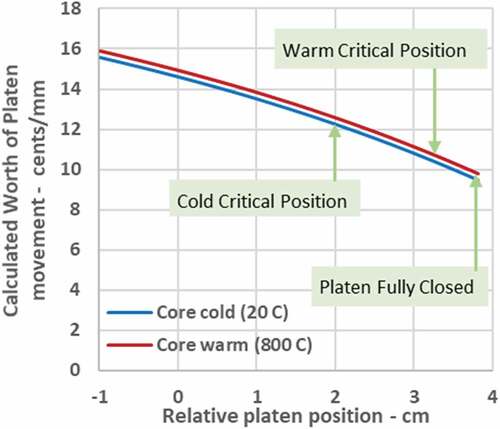
At T = 1.55, when the platen was raised to its initial 800°C position, it is estimated that the total reactivity insertion was 1.42 $. The relative platen position at this time was 3.21 cm, as compared to the fully closed position of 3.82. If needed, the platen could have been raised the additional 0.61 cm to fully close, which could have added another 0.60 $. This extra margin was added in accordance with the test procedure, which allowed the loading of up to 0.80 $ of additional excess reactivity over the expected amount needed (provided that the total excess did not exceed 3.00 $). The additional reactivity margin was included in the design in case the temperature defect was much higher than expected. The temperature defect is the loss of reactivity from room temperature to operating temperature.
These calculated values of excess reactivity are only hypothetical because even if the platen could move extremely fast, feedback would occur before that position could be reached. In actuality, the total amount of excess reactivity in the reactor was never more than the initial 0.15 $ insertion. This is indicated in and because the slope of power increase (mostly determined by excess reactivity) was never greater than it was within the spike from the initial 15 ¢ insertion.
V. APPROACH TO STEADY STATE
plots the power, fuel temperature, and platen position from T = 1.5 to T = 8.0. There is a gap in the power (neutron detector) data at T = 6.0 because of a limitation in the COMET data acquisition system (DAQ). The system was limited to a maximum recording time of 8 h because prior to KRUSTY, COMET had never been used to measure criticality for more than a few hours during one experiment. Thus, several times during the KRUSTY test, the data were downloaded and backed up, and the COMET DAQ was restarted. Other DAQ resets occurred just before T = 14, T = 20, and T = 27; however, these are less notable because the operation went more smoothly (i.e., more quickly) after it had been performed for the first time.
Fig. 13. Temperature and power data as KRUSTY approaches steady state.
V.A. Quasi Steady State Achieved
At T = 1.7, the system had reached quasi steady state, i.e., a state where the core and Stirlings were in sync with each other and only external or second-order factors could significantly alter system power and temperature. After any transient, the period of oscillation for reactivity, power, and temperature was ~15 to 20 min, depending on the power draw. The oscillations were fairly well dampened, so quasi steady state (or dynamic steady state) would occur ~30 to 40 min after a transient initiator. System steady state was still a ways off because some of the power was still heating the poorly coupled thermal mass (reflector, vacuum can, shield, etc.) and causing reactivity feedback. This reactivity feedback is considered second order because it occurs at a much slower time constant than the primary system dynamics. For these components the timescale is substantially longer because the power transferred is low (hundreds of watts instead of kilowatts) and the thermal mass is high (due to the high mass of the reflector and shield). During the 60 ¢ run, the period of oscillation was much longer (74 min). In that case, the power draw was only ~100 W versus the ~2.7-kW power draw in KRUSTY’s nominal state.
At T = 1.7, the fission power was ~2.9 kW, and the fuel temperature was ~800°C. Full system steady state was not approached until T = ~8.0, where the power was ~2.7 kW. The power was higher at T = 1.7 because hundreds of watts were still heating up the vacuum can, reflectors, and shield toward their steady-state temperatures.
V.B. Upward Temperature Drift
The temperature and timescale in imply quasi steady state at T = 1.7, but clearly shows the system steady state was not reached. For the next 5 h the system temperature rose ~30°C. A rise in fuel temperature was expected due to the positive temperature feedback of both the vacuum can and reflectors but not to the extent that it actually occurred. As the vacuum can and reflectors warmed up, the positive temperature feedback passively required that the fuel heat up to provide a compensating decrease in reactivity, to achieve the stable state of zero reactivity, or keff = 1.
shows the temperature reactivity effect of the fuel, vacuum can, and radial reflector. The curves were generated by the models after preliminary benchmarking with KRUSTY and use of the ENDF8 nuclear data.
Fig. 14. Reactivity versus temperature for the fuel, vacuum can, and radial reflector.
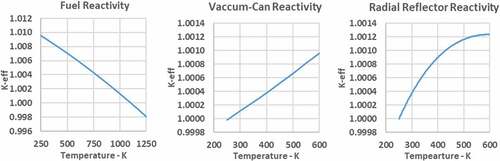
The vacuum can is a 0.305-cm-thick Type 316 stainless steel (SS316) cylinder that sits between the fuel and the radial reflector. The neutronic effect caused by heating the SS316 material is relatively neutral: Lower density causes less reflection back to the core but also allows more of the moderated neutrons from the radial reflector to return to the core. The Doppler feedback, due to the thermal broadening of capture resonances, provides negative feedback, but this effect is very small because of KRUSTY’s fast neutron spectrum.
The dominant reactivity effect of heating the vacuum can is created by axial thermal expansion. As the can heats, it expands downward because its top is fixed to the upper shield/chamber above (note that this configuration was required to enable safe and practical operation on COMET). The axial expansion of the vacuum can lowers the fuel with the assembly and therefore creates the same positive reactivity effect as raising the platen (the nominal method of increasing reactivity). The vacuum can reactivity is effectively a function of the SS316 coefficient of thermal expansion. This effect apparently accounted for several cents of reactivity insertion over the first few hours and likely caused a 10°C to 15°C rise in fuel temperature. Unfortunately, because of various engineering constraints, there were no TCs directly on the vessel, so the vessel temperature has to be inferred from other readings. Further benchmarking should be able to better quantify this effect.
The second positive reactivity effect was the heating of the BeO in the reflectors, especially the radial reflector. As seen in , the radial reflector reactivity increase is largest at room temperature and decreases at elevated temperatures (note that even colder conditions would have to be considered for operation in space). The positive effect of the change in BeO cross sections initially dominates the negative reactivity effect of thermal expansion. The most likely contributor to the positive feedback is that the warming of the BeO atoms/molecules resulted in less neutron moderation, which in turn allowed more neutrons to pass back through the SS316 vessel, the Haynes 230 clamps, and heat pipes without being captured (especially the Haynes 230, which contains significant Ni and W). Another reason for positive feedback could be the broadening of the Be scatter resonances, causing more overall neutrons to be scattered back to the core. There may be other temperature effects in the cross sections that increase neutron return from the reflector, perhaps changes in angular distribution or a small increase in n2n reactions, but less moderation and broadened scatter resonances are likely the primary contributors. These effects could be quantified with additional study. Thermal expansion of the BeO causes negative feedback, but not as much as most other components, because the axial expansion has the effect of raising the platen (raising the top of the BeO), which partially offsets the reduction of density. Negative expansion feedback slightly increases with temperature (in general because the coefficient of expansion for BeO increases), while the positive cross-section feedback decreases (in general because relative atomic motion increases only with the square root of temperature).
For the KRUSTY radial reflector, as seen in , the expansion and cross-section feedback balance each other at about 600 K; i.e., the change of reactivity with temperature is flat. This would be ideal for a flight system because the expected nominal temperature of the radial reflector might be close to 600 K, so when a power change causes reflector heating or cooling, it will not affect reactivity and cause a core temperature change. Either way, a flight system probably will not have as much positive cross-section feedback because there will not be as much Fe, Ni, and W between the radial reflector and the core.
As previously mentioned, the magnitude of the upward temperature drift during start-up was higher than expected; one reason for this appears to be the nuclear data. Beryllium cross sections have been known to have considerable uncertainty over the years but have likely improved with each revision of the data. KRUSTY was designed and modeled with the ENDF7.1 data evaluation. The ENDF8 cross sections, released just after the KRUSTY test, indicate a larger BeO reactivity worth and an even larger increase in worth with temperature. The feedback exhibited during KRUSTY start-up probably helps confirm that the changes to the ENDF8 BeO cross sections were warranted, although future benchmarking will be needed to investigate this issue.
Another reason for higher than expected reactivity insertion appears to be convection. There was a 4-mm air gap between the vacuum can and reflector. This gap was required because the radial reflector sat outside of the vacuum can to allow the use of the COMET platen to insert reactivity. When the vacuum can warmed up, the adjacent air became buoyant and likely created natural convection, either steady state or via chugging. Also, the platen was not fully closed during the KRUSTY test sequence, which allowed a few-millimeter gap for heated air to access the ambient room air via a flow path that went over and around the radial reflector. There was also a small amount of bleed flow below the vacuum can, which would have facilitated convection.
The KRUSTY results indicate that a nontrivial amount of convection carried heat from the vacuum can to the BeO in the radial reflector as it flowed over and around it. The radial reflector TCs measured a temperature rise that was four times quicker than the pretest modeling, which included only conduction through air and direct power deposition into the BeO. This high rate of heating was almost certainly due to convection because the uncertainties in the conduction properties/model and the heating cross sections of the BeO should not be that large. The upward convection of warm air also heated the section of the vacuum can above the core, causing the fuel to drop farther into the reflector and insert even more reactivity.
The above factors should explain why the fuel temperature rose ~35°C from T = 1.5 to T = 6.0. During the test, the vacuum can temperature likely increased by ~100°C to 150°C (inferred from various TCs, especially those attached to the MLI inside the can), which would add ~3 ¢ to 4 ¢ of reactivity based on the curve in . The radial reflector TCs heated ~30°C during this time, which would add another ~3 ¢ to 4 ¢. The fuel temperature feedback coefficient at ~800°C is 0.2 ¢/°C, so the core would have to heat up 35°C to provide 7 ¢ of negative feedback to compensate for the vacuum can and radial reflector reactivity. So, this apparently explains the upward temperature drift, although this is not entirely certain.
The upward temperature drift of KRUSTY could have been halted by gradually moving the platen, but it was left unabated for several hours to learn more about system reactivity feedback. If this were a flight reactor, the B4C rod would have been intermittently raised to keep temperature near the target value of 800°C. Actually, the reasons for KRUSTY’s upward temperature drift would not exist in the proposed flight reactor; i.e., they were primarily caused by the limitations imposed by the ground test configuration (namely, the existence of a vacuum vessel between the fuel and reflector and potential airflow past the reflector). A flight system would not have nearly as much positive BeO feedback as KRUSTY (less resonance neutron absorption between the reflector and fuel) nor a structure where relative movement between the fuel and reflector could significantly affect reactivity, although it is possible that the same and/or different effects could exist. Regardless, second-order reactivity effects like these (i.e., of much lower magnitude and slower timescale), whether for ground test or flight, are not relevant to the primary system dynamics and robustness of the system. In any Kilopower system it is extremely unlikely that these types of effects will be significant enough to affect the load-following capability of the reactor. Therefore, even if a flight system has similar or even greater second-order effects, it will essentially only impact start-up, perhaps requiring a longer time to reach system steady state.
V.C. Vessel Bleed Flow
KRUSTY included a system to inject/bleed a small amount of N2 into the air gap below the vacuum can. This was done to ensure that the vessel did not get hot enough to either fail or perhaps warp enough to impede platen motion. Modeling indicated that this was extremely unlikely, but the bleed-flow capability was added because it was easy to implement and provided another feature that helped gain regulator confidence.
There was no flowmeter on the bleed-flow source. The flow was simply controlled by specifying the valve to be between 0% and 100% open. Overall, the flow rate was so small that it could not remove significant power relative to the entire system, but it could remove enough power to affect the heat-flow balance on the vacuum can, thus its temperature.
At T = 1.7, 10% bleed flow (valve opening) was initiated as a precaution. The effect of this increase is hard to discern because the temperatures are still settling toward quasi steady state at T = 1.7. At T = 1.5, fuel TCs were still rising because the reactor was being held at 3 kW by intermittent raising of the platen. At T = 1.55, the platen movements had finally stopped, and negative feedback was causing the power to decrease. Thus, when the bleed flow was initiated, the system was still trying to settle to quasi steady state. It appears that the bleed flow suppressed the temperatures slightly from T = 1.70 to T = 1.75, which then resulted in a higher reactivity/power/temperature upswing from T = 1.75 to T = 1.80. In the big picture, this level of bleed flow seemed to make little difference in the results.
The system was left untouched from T = 1.7 to T = 3.3, and the aforementioned upward temperature drift was ~8°C/h. It was then decided to increase the bleed to 50%. The increase to 50% definitely had an impact, as the rate of fuel temperature increase slowed from ~8°C/h to ~5°C/h. The more interesting effect in is the oscillations in temperature. One possible reason for these oscillations is thermal chugging. As mentioned previously, the only possible flow path for air to escape the warm interior travels up and over the reflector and then down to the platen. In KRUSTY, a cooler layer of air (above the reflector/core) would generally sit above warmer, more buoyant air (next to the core). Steady natural convection may or may not be established depending on numerous variables. In a system like this, a chugging phenomenon could set up, where a pocket a warm air would build an unstable interface until the air finally broke through and vented out of the system. It could be that a 50% bleed flow created the ideal scenario for chugging due to the addition of N2, which added more buoyancy (lower molecular weight than air); plus, the entering N2 flow also increased the regional pressure. This seems like a reasonable explanation for what occurred from T = 3.5 to T = 5.5; however, this phenomenon dampens out rather quickly between T = 5.5 and T = 6.2, and no control actions were taken during this time. This could be because the upper gas-entrapment region finally warmed up to a level that did not prohibit air escape, but all of the above is speculation at this point.
At T = 6.00, the bleed flow was increased to 100% in an attempt to quicken the pace to reach a steady-state system. This increase in flow had a rather significant impact on the reactor. There is a significant power drop at T = 6.15, followed by a significant drop in core temperatures. This drop occurred well before the first of three upcoming platen movements, and the increase to 100% bleed flow was the only external change to the system for several hours. The likely explanation is that the additional bleed flow cooled the vacuum can, causing it to contract upward and decrease reactivity. This would be consistent with the relatively high reactivity feedback coefficient associated with the vacuum can. However, it is a little strange that this effect is several minutes delayed from when the bleed flow was increased.
Unfortunately, this increase in bleed flow corresponded to the downtime of the COMET DAQ. Perhaps there was actually a power change at T = 6.0, or perhaps the time stamping/matching of the data is off a bit. Assuming neither of those possibilities occurred, it is possible that it took a while for a steady flow of bleed gas to be established. Perhaps convection was initially deterred by the aforementioned thermal layering within the air enclosure. There could have been a big exhale of gas at T = 6.15 followed by conditions that allow a more steady-state flow. Also, the gas takes a rather long zigzag path through the lower shielding (to prevent streaming) such that the gas is well coupled thermally to that region. Thus, an increase in bleed flow would first cool the lower-shield region and still have a rather warm exit temperature. Then, as the bleed flow cooled down the lower shielding, it might exit cold enough to effectively cool the vacuum can. Overall, the magnitude of the power and temperature drop caused by the increase in bleed flow was consistent with the expected physics, but it was unexpected that the power drop was delayed and yet so abrupt. The explanation of this behavior might be resolved with detailed benchmarking.
V.D. Platen Movements to Reduce Temperature
At T = 6.4, is was decided to bring the fuel temperature TCs back to 800°C, with the expectation that after the system settled, it would be close to system steady state and the planned transients could commence. The first platen move, at T = 6.47, was a drop of only 0.08 mm. According to , this drop would cause a reactivity decrease of ~1 ¢. Given the calculated 0.2 ¢/°C feedback coefficient, this generally agrees with the 5°C fuel TC drop that can be seen in ; although the transient was not allowed to settle to get a better estimate of the quasi-steady temperature change (note that this type of transient was performed later, when the system was closer to true steady state).
Next, after the system had completed about one of the oscillations caused by the 0.8-mm drop, the platen was dropped 0.24 mm at T = 6.87. This appeared to cause the fuel temperature to drop ~15°C, but in this case, even less than one oscillation was observed before the platen was dropped again. At T = 7.05, the platen was dropped another 0.27 mm to bring the fuel temperature back to ~800°C.
These types of reactivity adjustments are exactly what would be anticipated during the start-up of a flight reactor. For the first flight system, it is expected that the system temperature would be monitored and transmitted back to Earth. Ideally, the reactor would include fuel temperature diagnostics, but configuration and/or reliability concerns might dictate that the TCs (or other diagnostics) would measure heat pipes and/or components very close to the fuel. As the system temperatures were being observed by the start-up operator, a command signal would be sent to the reactor anytime that a temperature tweak was desired. The commands would instruct the control rod actuator to move the rod by a specified distance as opposed to the COMET operator instructing the platen to move. For KRUSTY there were three such tweaks, although in space they may need to be further apart depending on the time lag in the communication architecture—certainly, the timing would be much longer for a system on Mars. If desired, an automated control system could make these reactivity/temperature tweaks, but for at least the first system, it would probably be better to have a human operator in the loop. Relying on automated control might be risky for a first-of-a-kind reactor, even though the command logic would be very simple in this case. A human would be especially beneficial if some of the temperature and/or power readings appeared squirrelly (which is likely) or the system did not perform as expected (which is less likely due to the results of KRUSTY). An automated system could be used with human interrupt capability as long as the cost and risk of developing that system did not significantly impact the cost and risk of the first flight deployment.
VI. STEADY STATE
KRUSTY finally reached “adequate” system steady state between T = 7.5 and T = 8.0, approximately two oscillations, or 30 min, after the final platen adjustment. There was still a small amount of upward temperature drift but not enough to cloud the results of the upcoming transients. The fission power was relatively stable at ~2.75 kW with a fuel temperature of ~800°C.
VI.A. Core Temperatures
The average fuel TC reading at T = 8.0 was 800°C, although since the TCs are on the outer surface, the average fuel temperature would have been significantly higher. At 2.75 kW, the conduction temperature gradient from the fuel inner diameter (ID) to outer diameter (OD) would be at least 10°C, and even more to the heat pipe interface. Also, as discussed in this and previous papers, the TCs were not perfectly bonded and probably read a couple of degrees low. Therefore, it is reasonable to assume that the peak fuel temperature was generally 15°C higher than the TC readings, and the average was about 5°C higher.
In , it can be seen that there was about an 8°C spread among the fuel TCs. Some of this was surely due to variance in the calibrations and thermal coupling, as there appears to be about a 2- or 3-deg deviation between TCs that were supposedly in symmetrically identical positions. However, there is a statistically significant difference between TCs based on their axial position on the core. Fuel TCs were placed in three axial locations on the outer perimeter of the fuel: near-top, middle, and near-bottom. On average, the TCs near the top of the core read 3°C or 4°C lower than those at the middle and bottom. This was a result of the axial power deposition profile, which for KRUSTY is asymmetric. The level of asymmetry depends on the platen position and the loading of the BeO on the platen and shim reflectors. If KRUSTY had zero neutronic margin, BeO completely filled the platen and shim reflectors, and the platen was fully closed; then, the axial profile would have been near symmetric.
The actual KRUSTY configuration had enough margin that neither full reflectors nor a closed platen were required to achieve 800°C. Therefore, there was more neutron leakage near the top of the core and thus a lower power density near the top of the core. The axial peaking profile is shown in in the KRUSTY design referenceCitation2; the top third of the core has a power deposition ~25% lower than the middle and bottom thirds. The heat pipe vapor would be isothermal at each location, but the temperature gradient to push the heat from the fuel to the heat pipe would be lower in the upper section. This agrees with the lower observed TC readings on the top third of the core, which were consistently cooler throughout all of the testing.
VI.B. Power Balance
A T = 8.0, the steady-state fission power is ~2.75 kW. Note that 2.75 kW is the recoverable fission power, which includes any power deposited within KRUSTY (including the shielding). The total fission power would be slightly higher due to radiation that escapes the system. Eight hours into the testing, the decay power should have reached between 5.5% and 6% of fission power, so decay power was probably ~150 W (detailed benchmarking can help calculate this value). Thus, the total reactor power thermal was ~2.90 kW.
If the temperature is steady, then by definition the power removed from the fuel would also be ~2.90 kW. The MLI boundaries that surround the core provide the best interface to calculate a thermal balance. The power leak from the core through the MLI at this stage should be between 350 and 450 W, based on electrical test results and initial benchmarking. The MLI loss accounts for heat transfer through the radial MLI to the vessel and axial MLI to the axial reflectors. Another source of power loss from the core is fission radiation that escapes the core boundary. MCNP (Ref. Citation9) calculations estimate that ~94% of the recoverable fission power is deposited in the core (fuel, heat pipes, and ring clamps) and 6% is external to the core; thus, ~150 W of the ~2.90 kW is lost in this manner. This leaves ~2.35 kW of power to be removed from the core by the heat pipes, assuming that the loss through the MLI was 400 W.
A total heat pipe draw of ~2.35 kW equates to ~295 W for each of the eight heat pipes. Preliminary benchmarking indicates that ~300 W was pulled by the converter heat pipes and ~290 W by the simulator heat pipes. As mentioned previously, the thermal power drawn by the converters was ~265 W. This implies a passive (parasitic) power loss of ~35 W/converter heat pipe. This loss occurs in three regions: (1) through the heat pipe MLI to the axial reflectors and shielding, (2) through the heat pipe MLI into the chamber, or (3) from the converter MLI surrounding the hot end. For the thermal simulators it is estimated that ~240 W was being drawn by the N2 gas flow and ~50 W was lost passively.
Overall, the passive losses were higher than expected in pretest modeling. The total observed passive losses were ~750 W versus the predicted value of ~400 W. Some of this difference could have been due to the loss of a hard vacuum, which can be determined with further benchmarking. It is also believed likely that the insulation on the lower heat pipe extending below the fuel slid off, causing more radiative loss to the lower axial reflector and vessel, or the MLI between the fuel and axial reflectors may have been compacted more than expected. Regardless, predicting the losses through MLI or any insulation/gap is very difficult for real engineering systems.
The power balance is relatively clean and consistent for the T = 8.0 steady-state point, but unfortunately, it gets more complicated when the simulators are not used in their nominal condition. The T = 8.0 state point is also the only one that had followed a long period of operation at similar power level. Other state points and transients are affected by the temperature of the large mass of peripheral thermal mass (structure, tubing, TC wires, etc.). In addition, the system was never fully at steady state, so tens to hundreds of watts may have been going to heat or cool various ex-core components. Detailed system benchmarking should help determine full steady-state and transient power balances.
VII. LOAD-FOLLOWING TRANSIENTS
The cornerstone of the KRUSTY transient testing was to assess the thermal load-following capability of the Kilopower reactors. takes a closer look at the load-following transients from T = 8 to T = 12. Note that the platen position is not moved during this entire time period, so the response of the reactor is 100% passive, driven by reactivity feedback.
Fig. 15. Temperature and power data for the load-following transients.
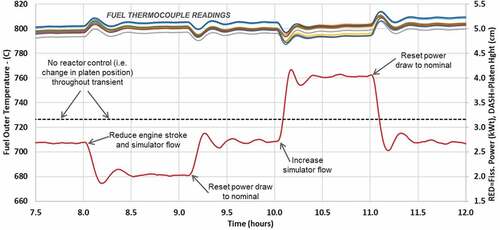
VII.A. Step Reduction in Power Draw
At T = 8.0, the power draw from the Stirlings was reduced. The voltage command to the converters was reduced from 10.8 to 8.0 V, and the flow to the simulators was reduced to try to match the reduction in power draw from the converters. As seen in , this ultimately causes the power to drop from 2.75 to 2.05 kW. At T = 8.0, the reduction in heat removal caused a rise in average core temperature, thus a decrease in reactivity (primarily via thermal expansion causing more neutron leakage) and thus a drop in power. The gradual drop in power subsequently caused core temperature to fall back toward the reactor thermostat setpoint of ~800°C. Changes in temperature follow ~25% out of phase with power; i.e., when power is at its peak, the temperatures are near their setpoint and increasing at their maximum rate; when power is at its nominal point and decreasing at its maximum rate, the temperatures are at their peak. The relationship between neutronic and thermal physics causes several dampened oscillations, i.e., with decreasingly less overshoot and undershot, until a quasi steady state is achieved. The oscillations for this transient were ~20 min, as seen in .
The power balance at this state point can be estimated based on data and modeling. The converter power draw is estimated to be ~185 W (down from 265 W), based on the stroke and temperature profile. The simulator draw also decreased ~80 W. If the power removed by each heat pipe was reduced by 80 W, then total core power would be reduced by 640 W, which is very close to the observed drop from 2.75 to 2.05 kW. Decay power is another factor that impacts the power levels achieved at the steady-state point, although it is relatively minor. Modeling indicates that the decay power would have been ~155 W at T = 8.0 and then dropped to ~130 W at T = 9.0, which would account for 25 W of the power decrease. If a line was drawn through the power oscillations in from T = 8.1 to T = 9.1, it might indeed show a gradual ~25 W drop, but there are other factors that could account for that drop as well.
VII.B. Step Increase Back to Nominal Power Draw
At T = 9.08, the power draws from the Stirlings were restored to their nominal values. In this case, the increased power draw caused the fuel temperature to drop, causing a reactivity increase and then a power increase. As expected, the reactor settled back to its original steady-state condition. Note that there was still some of the aforementioned upward temperature drift, probably again due to the heating of BeO in the radial reflector, but the rate of increase was only ~1°C/h, which decreased even further throughout the test as the BeO temperatures approached steady state.
The magnitude of the core temperature drop that initiated the power rise at T = 9.1 was only ~5°C, which would equate to ~1 ¢ of positive reactivity. If KRUSTY was 1 ¢ supercritical, the expected reactor period would be ~18 min. In , the power rises from 2.05 to 2.75 kW over about 6 min, which would equate to a reactor period of 20 min, perhaps slightly longer because excess reactivity would have been less than 1 ¢ over the entire 6-min span. Once again, the observed reactor behavior agrees well with the models.
VII.C. Step Increase in Simulator Power Draw
At T = 10.02, another positive step change in power draw was initiated. This time, the increase was only from the simulators because the Stirling converters were already running slightly above rated power. It would have been preferable to have eight converters, but since the off-the-shelf converters were rather low power, it was nice to have simulators that could remove significantly more than nominal power. The simulator flow rates were increased to approximately double their power draw.
As with all of the load-following transients, the fuel TCs responded very quickly to the increased power removal. The increased heat removal inside the simulator was fully evidenced by a drop in the fuel TCs within 1 min. The length of the time delay is consistent with time required to establish temperature gradients in the simulator, condenser, evaporator, and fuel between the TCs and the heat pipe interface. A closer look at the data shows that there is almost no time delay in the reaction of the TCs attached to the heat pipes; thus, they are effectively behaving as an infinite conductor as compared to the rest of the system.
The increase in simulator flow caused the fission power to change from 2.75 to 4.05 kW, which is a rise of 1.3 kW. Thus, the power removed from each simulator heat pipe rose from 295 to 510 W. Ideally, the power removed by the simulators would be a straightforward calculation of ṁCpΔT. In reality, the simulator and flow-loop design followed the “Best Is the Enemy of Good Enough” KRUSTY mantra. The design focused on providing a similar mechanism of heat removal (internal copper gas heat exchanger) and conduction path to the heat pipe condenser while also finding a practical solution to mounting components and routing gas flow. Most importantly, the design had to be completed successfully within cost and schedule. As a result, the design left open the possibility for external factors to influence power draw. There are indeed inlet and outlet flow TCs and a flowmeter on each simulator, but they are far enough apart that other factors can heat or cool the gas between the two TCs. In addition, the simulators have much area that can radiate heat, with varied levels of insulation, and a compact geometry with several nearby components that could change the radiation sink temperature significantly (note the vacuum vessel itself was actively cooled and remained relatively isothermal). Normally, the peripheral components were colder than the simulator exterior, and thus, the simulator radiated away heat. However, in high N2 flow conditions, the simulator exterior ran cold (the inlet flow was on the outside), so that the simulator could gain heat from the peripheral components. There was also some internal heat transfer from the exiting hot gas to the incoming cold gas within the simulator. Four layers of MLI were placed in a vacuum gap between the inlet and outlet flows, but the heat transfer could still be significant in a high-flow, high-power scenario. The loss of hard vacuum, due to the turbopump failure during the 60 ¢ run, also adds another layer of uncertainty on the passive losses. The roughing pumps were able to hold a vacuum between 0.02 and 0.03 Torr. This is in the range where some conduction to the air or across gaps might occur or perhaps some oxidation of surfaces (increasing emissivities).
VII.D. Step Decrease Back to Nominal Power Draw
At T = 11.0, the flow through the simulators was reduced back to their nominal setting. KRUSTY returned smoothly and predictably back to match the nominal total power draw from the reactor of 2.75 kW.
A close look at the fuel temperatures in shows that the fuel temperature is lower at higher power and vice versa. This is expected because the reactivity setpoint is based on the average fuel temperature (plus other second-order effects). Higher powers create a larger temperature gradient in the fuel, so the center runs hotter, and the outer surface (the TC location) runs cooler. This is an important characteristic that needs to be considered when designing a load-following reactor: As thermal power to the PCS increases, the power is delivered at a lower temperature. This requires the ability of the PCS to generate more power at a lower efficiency. Design margins would dictate the upper range of the electrical load-following ability, which ultimately represents the maximum rated power of the system.
Another feature of note in is the period of oscillation for each transient to settle. The oscillations are not clean due to second-order effects, but it is still possible to see that the period is shorter at high power and vice versa. Power determines how quickly change happens, similar to how gravity affects the period of oscillation for a pendulum. At 2 kW, the oscillations had a period of ~20 min; at 2.7 kW, they had a period of ~17 min; and at 4.0 kW, they had a period of ~14 min. During the 60 ¢ run, at 100 W, the oscillation period was 74 min.
A subtle effect also occurs each time the power draw is reduced. As the heat pipes remove less power, the amount of Na in circulation is reduced (i.e., evaporating and condensing). There may be a change in the flow velocity/travel time for Na to return from the condenser to the evaporator, but in a thermosiphon the bigger change with power is probably the area/volume of the return flow, not the velocity. This would cause the pool to shrink with a power increase and grow with a power decrease. The Na pool has a positive reactivity worth, so when power is reduced and the pool quickly rises, a small increase in reactivity occurs. During the KRUSTY design process, this effect was speculated, and the design was changed to minimize its magnitude by lowering Na inventory and lowering the bottom of the heat pipe relative to the fuel. As a result, the effect was indeed small, though noticeable in the KRUSTY testing: Each time the power draw was reduced, there was a very small upward tick in reactor power before the load-following drop. The effect was most evident when simulator power was dropped from maximum to nominal at T = 11 and T = 15.
Overall, the results of the load-following transients were successful, and KRUSTY behaved as predicted. Any Kilopower concept that maintains similar neutron physics and heat transfer characteristics should operate in the same manner regardless of power level or configuration.
VIII. FAULT TOLERANCE TRANSIENTS
One of the most attractive features of Kilopower systems is reliability, including the ability to avoid single-point failures and in many cases tolerate numerous failures. The fault tolerance transients were conducted to verify the ability of KRUSTY to deliver nominal power in the case of failed Stirling modules. A Stirling module (also referred to as a string) includes the heat pipe, the Stirling, the heat rejection, and the interfaces that connect them. The components are in series, so a failure of any of them fails the string. In KRUSTY, the flow through the simulators was cut off to fail the string, although as previously discussed, this does not fully simulate a failed heat pipe because of the passive losses of the various components.
takes a closer look at the fault tolerance transients from T = 12 to T = 14. These transients were shortened to 30 min because more time than expected was needed to reach system steady state. As with the load-following transients, the platen was not moved; i.e., net system reactivity was not changed.
Fig. 16. Temperature and power data for the fault tolerance transients.
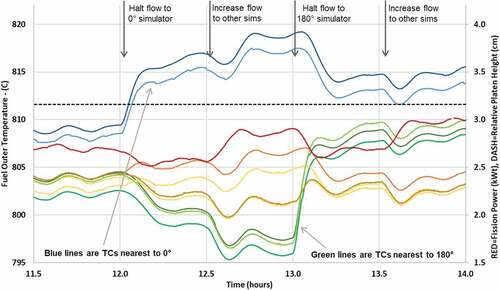
VIII.A. Simulate Failure of 0-deg Stirling Module
At T = 12.0, the N2 flow was cut to the simulator at the 0-deg azimuth, to simulate failure of that Stirling module/string. As expected, the TCs attached to the fuel near the 0-deg azimuth warmed up, and the total fission power dropped. The blue lines in are the TCs at 45 and 315 deg, and the failure of the 0-deg module caused them to rise from ~808°C at T = 12 to ~816°C at T = 13. At the same time, there is a significant drop in the TC readings on the opposite side of the core near 180 deg. This behavior is caused by the reactor’s passive response to return to its zero-reactivity state, based on its temperature setpoint or thermostat. The thermostat is first order based on the average core temperature, so if one portion of the core heats up, the new quasi steady state will require that another portion of the core cool down. This is exactly what has happened as a result of the failed 0-deg string: The fuel at 0 deg heated up, and the fuel at 180 deg cooled down.
shows the pretest model calculations of the nominal core temperature versus the temperature with the failure of the 0-deg string; these plots were included in the predictions that were published prior to the actual testing.Citation10 Each contour line in represents 2°C. The nominally predicted temperature at the 22.5- and 337.5-deg TC locations was 807°C (1080 K), and the predicted temperature with the failed 0-deg string was 815°C (1088 K). The predicted temperatures are only 1°C off from the actual results (which is extremely lucky given all of the potential influences), but the key is that the pretest models predicted the correct temperature rise of 8°C.
Fig. 17. Pretest models of the fuel temperature profile.
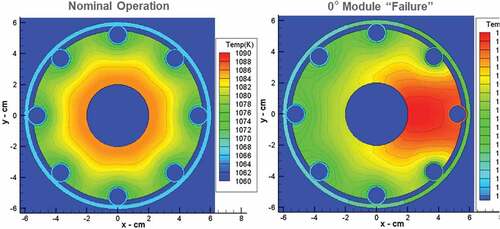
The power drop caused by the loss of N2 flow in the 0-deg simulator was between ~150 and 200 W (which is more difficult to determine because the time at quasi steady state was shortened). This was a smaller drop than anticipated and was a result of significantly increased passive losses from the simulators when there was no flow. The pretest modeling had not included heat loss from the top sections of the simulators, which unfortunately were uninsulated. When N2 was flowing, the top section was well cooled by the cold gas, but when N2 flow was cut, the top end warmed up substantially. Apparently, there was internal convection within the simulator that transferred heat from the copper collector (fed with heat from the heat pipe condenser) to the upper, uninsulated portion of the simulator. Preliminary benchmarking indicates that ~70 W was radiated from this region when the N2 flow was cut off. The nominal simulator condition removed ~290 W: ~240 W to the N2 gas and ~50 W of passive losses. Therefore, even though active power removal had been cut, the passive losses increased to ~120 W. As a result, the power draw by the failed zero-flow heat pipe was reduced from ~290 to ~120 W, which agrees with the observed drop in reactor power.
VIII.B. Increase Flow to Working Simulators
At T = 12.5, the N2 flow to the other simulators was increased to simulate the power draw needed to return to nominal electrical power (i.e., if real Stirling converters were actually there to use it). The resulting power was ~2.85 kW, or slightly higher than nominal, because more thermal power would be required to produce the nominal electrical power given the slightly lower temperature of the working modules (i.e., a drop in the Carnot efficiency if converters were actually attached). As expected, the higher power creates a larger temperature gradient between the warmer 0-deg fuel and the cooler 180-deg fuel, i.e., a larger difference between the blue and green TC plots in . As before, the TCs at the azimuthal midpoint between 0 and 180 deg (brown in ) stay relatively unchanged.
VIII.C. Simulate Failure of 180-deg Stirling Module
At T = 13.0, the N2 flow to the 180-deg simulator was shut off, simulating the failure of the 180-deg Stirling module/string. The temperature of the TCs at 157.5 deg (green in ) increased very soon after the flow was halted. Over the next ~10 min, their temperature increased ~12°C, from 797°C to 807°C, and ultimately up to 809°C. As with the 0-deg simulated failure, the temperature of other regions of the core dropped to equalize to zero reactivity. The TCs near the 0-deg heat pipe dropped such that the differences between the TCs near 0 deg (blue) and the TCs near 180 deg (green) were back to their nominal relative positions. The TCs near 90 deg dropped to their lowest readings as the mid-section of the fuel was now the coldest part of the core, compensating for the warmer fuel on both azimuthal sides. Overall, the azimuthal temperature gradient was much smaller with failed 0- and 180-deg strings, as opposed to an asymmetric removal from only 0 deg. The worst case would be to simulate failures (cut N2 flow) of two adjacent strings. This scenario would have been included if more time were available after the primary transients had been completed, but it was put near the back of the transient wish list because there was some risk of fuel overheat (if temperature gradients were higher than expected). Although since the gradients were as expected for the single failure and the duel-opposed failures, it is very likely that the adjacent failures would have performed as expected as well. During this transient, the fission power once again dropped by ~150 W due to the drop in heat removal by the 180-deg heat pipe, in the same manner as the 0-deg degree heat pipe.
VIII.D. Increase Flow to Working Simulators
As before, the N2 flow to the remaining simulators (45, 135, 225, and 315 deg) was increased to produce the theoretical thermal power to create nominal electrical power if converters were actually there. The reactor power followed the increased load of the additional N2 flow and increased to ~3 kW.
VIII.E. Increase Flow in All Simulators
At T = 14.0, the flow through all simulators was increased in an attempt to match the power draw of the T = 10.0. This was not really part of the fault tolerance transients but was rather to see how the return to high power might be different from this state rather than steady state. As seen in , the power level of this state is 3.75 kW, which is significantly lower than the 4.05 kW at T = 10.0. This indicates that each simulator was drawing only 460 W as opposed to 510 W in the previous condition.
A small power drop was expected due to the gradual warming of loosely coupled thermal mass, thus decreasing passive losses; however, this 50-W/simulator drop was far greater than expected. It is likely that the thermal mass surrounding the simulators was heated significantly by the failed 0- and 180-deg simulators. As mentioned above, there was a much higher than expected passive loss from the top of the simulators when they were at zero flow. When the high flow was initiated at T = 14.0, the exterior body of all simulators cooled to match the N2 temperature such that there could have been significant heat transfer from the warm surroundings back to the simulators, thus reducing their net power draw. This is another portion of the test that will need more detailed benchmarking to confirm the reasons for differences between actual results and pretest predictions.
VIII.F. All Stirling Converters and Simulators Back to Nominal
At T = 15.0, the flow through the simulators was once again reduced back to its nominal setting. KRUSTY returned smoothly and predictably back near the nominal total power draw, which is actually slightly lower (~50 W), probably for some of the same reasons the power was lower at the T = 14.0 state point.
IX. REACTIVITY CONTROL TRANSIENTS
The reactivity control transients were conducted to measure the clean reactor response to system reactivity changes; the platen was moved to increase or decrease system reactivity. This was similar to the reactivity adjustments performed at T = 7 except that the Stirling conditions were relatively steady and the transients were allowed a full hour to settle at quasi steady state.
plots the response to the reactivity control transients, which occurred from T = 16 to T = 20.
Fig. 18. Temperature and power data for the reactivity control transients.
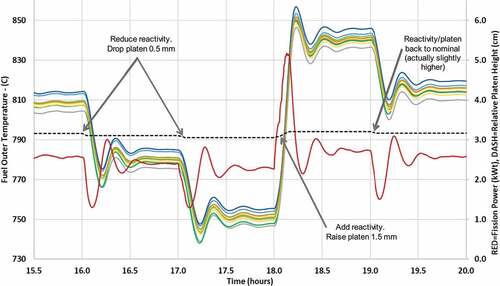
IX.A. Platen Lowered by 0.5 mm
From T = 16.00 to T = 16.05, the platen was gradually lowered by a total of 0.5 mm. The drop in reactivity caused the power to quickly decrease. The power draw from the core remained essentially unchanged; thus, the fuel temperature immediately dropped with the decrease in fission power. As the fuel cooled, passive positive reactivity feedback kicked in and halted the decrease in fission power. At T = 16.11, the power bottomed out at ~1.3 kW, as the passive positive feedback ultimately overcame the platen negative reactivity insertion. As reactivity became increasingly positive, the power started to rise. Then, at T = 16.16, the drop in fuel temperature flattened out because the fission power had returned to roughly equal the power loss. As with all previous transients, these phenomena caused a periodic overshoot and undershoot as temperature lags power and vice versa. The period of the oscillations was consistent with the previously observed ~17 min at a power draw of ~2.75 kW. As expected, these oscillations were much cleaner than previous transients due to the reduced impact of second-order effects on power/temperature.
As seen in , the net result of lowering the platen 0.5 mm was a drop in the core thermostat temperature of ~29°C: from ~808°C at T = 16 to ~779°C at T = 17. The calculated value of reactivity worth shown in is ~11 ¢/mm, so a 0.5-mm drop would cause a 5.5 ¢ drop in reactivity. The reactivity temperature coefficient of the fuel based on the slope in is ~0.2 ¢/°C. Based on these calculations, the 0.5-mm drop in the platen would cause an ~27.5°C drop in temperature; thus, it was very close to the observed ~29°C. The reason that the fuel temperature increased an extra 1.5°C is likely the consequential cooling of the vacuum can (and to some extent reflectors) as the fuel cooled. A 30°C drop in the vacuum can temperature would cause it to shrink, causing a reactivity insertion of between 1 ¢ and 2 ¢ (according to the slope in ).
IX.B. Platen Lowered by an Additional 0.5 mm
From T = 17.00 to T = 17.05, the platen was gradually lowered by another 0.5 mm. As expected, the transient response was almost identical to the previous 0.5-mm drop in terms of magnitude and frequency. The net drop in temperature was once again ~29°C with an oscillation period of ~17 min.
A more subtle change for each of the state points in occurs with the power level, which settles to a slightly lower level with a decreased temperature and vice versa. This occurs because the converters and simulators draw less power (via decrease in active draw and passive loses) when the core (heat pipes) are at a lower temperature and vice versa.
Another good result from this transient is that the heat pipes responded very well at the reduced temperature of 750°C, which is actually closer to ~740°C, because the surface fuel temperature is warmer than the heat pipe, especially the vapor. This demonstrates that the heat pipes were still operating effectively as an infinite conductor even though they were closer to their throughput limits. This heat pipe operating point is shown in , which shows that the heat pipes were indeed expected to have significant throughput margin even at 740°C.
IX.C. Platen Raised by 1.5 mm
From T = 18.00 to T = 18.16, the platen was gradually raised 1.5 mm and thus to a higher position than any other point during the testing. This subsequently took the KRUSTY reactor to its highest temperature. The rate of insertion was kept slow enough to prevent a very high power spike, with the goal of peaking at 5 kW, at which point the COMET operator followed a procedure similar to start-up, by intermittently inserting reactivity to keep power at 5 kW until the platen was raised a total of 1.5 mm. This was known to be an unsustainable power level because even if the simulator flow was set to maximum, the system could only draw enough power to achieve a steady power of ~4 kW.
The power was ~5.1 kW for a total of ~4 min, from T = 18.10 to T = 18.16. During this time, the heat pipes were drawing close to 590 W, as they heated the thermal mass of the Stirlings toward the new, higher core temperature. There was no evidence of the heat pipes struggling or giving a delayed or nonuniform response. This heat pipe operating point is also shown in , which indicates that the heat pipes still had plenty of throughput margin.
During this transient, the average fuel TC reading peaked at ~850°C and then settled to the newly established thermostat setting of ~840°C. The peak TC reading of the KRUSTY testing was 857°C at T = 18.23. This peak reading was from a TC on the outer surface at the core axial center. The peak internal fuel temperature would have occurred a little earlier when the power was higher. The expected temperature gradient from the ID of the fuel to the OD at 5 kW would be ~25°C, so it is likely that the maximum fuel temperature achieved by KRUSTY was ~880°C. This is higher than planned for a nominal Kilopower flight system, although the biggest engineering concern at high temperatures is creep (if significant primary stresses exist). KRUSTY did not operate long enough to provide relevant creep information unless the temperature had been at least 100°C hotter. Regardless, the fuel did operate at ~880°C peak temperature, and posttest inspection showed no noticeable change in the fuel geometry in any region. Therefore, this can be considered another positive result of the testing. The only change in the fuel seen during postirradiation inspection was the presence of a significant oxide layer, which was expected due of the lack of a hard vacuum.
IX.D. Platen Lowered by 0.5 mm, Back to Nominal
The last of the reactivity control transients was initiated by lowering the platen back to its nominal position, from T = 19.00 to T = 19.05. The final platen position was actually slightly higher (~0.01 mm) than it was prior to the reactivity change transients but only enough to cause temperature to increase by 1°C or 2°C. At T = 20.0, the average TC reading settled at ~815°C, which is 6°C higher than at T = 16, so there was still an ~1°C/h upward drift.
The transients in show that relatively small platen movements can cause a significant temperature change. For a flight system where reactivity will be controlled by the inner B4C rod, there would be less of a need for very fine motion control. Zero-power criticals determined the control rod worth to be ~4 ¢/mm near the expected critical positionCitation6; thus, reactivity would be three times less sensitive to control movements; i.e., a 1.5-mm rod move would cause a 30°C temperature change as opposed to a 0.5-mm platen move.
X. LOSS AND RESTORATION OF ACTIVE HEAT REMOVAL
The final transients were conducted to determine the response of KRUSTY to a complete loss of active heat removal and abrupt restart of the converters and simulators. plots these transients, which occurred from T = 20 to T = 28, ending with the reactor scram (a fast and large reactivity removal).
Fig. 19. Temperature and power data for the shutdown and restart transients.
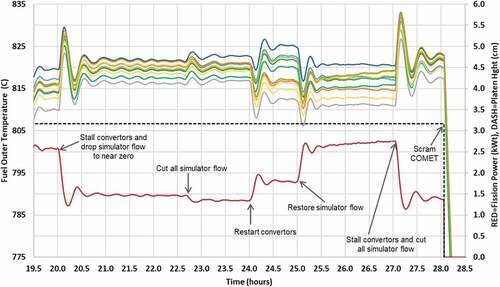
X.A. Stall Converters and Substantially Reduce Simulator Flow
At T = 20, the Stirling converters were stalled (zero stroke), and the simulator flow was set to a very low rate. As expected, the core temperature quickly increased, which decreased reactivity and dropped power shortly thereafter. During the transient, the average core TC reading rose ~15°C while the peak TC rose ~9°C and the power dropped from 2.6 to 1.25 kW. The core arrived at a new quasi steady state at ~819°C with a power of 1.5 kW. The quasi-steady fuel TC readings rose ~5°C because of the smaller radial temperature gradient in the fuel at lower power. As with other load-following transients, the thermostat temperature is based on the average fuel temperature (technically the neutronic-importance-weighted temperature, but they are very similar). At lower power, both the inner and outer fuel temperatures and the heat pipes would move more closely to the average temperature and vice versa.
As seen in , the spread in the core TCs was rather small, ~6°C from lowest to highest, which would be expected at lower power. The heat pipes are relatively isothermal along the length of the core as long as they are operating below their throughput limits. The fuel temperatures are then hotter than the heat pipe in proportion to the amount of power that must be conducted to the heat pipe. As discussed previously, the power deposition in KRUSTY is higher in the lower half of the core than the upper half, due to gaps at the top end of the radial. Therefore, there is more power in the lower core that must be conducted to the heat pipe, resulting in larger temperature gradients and TC readings on the surface of the fuel (located between the heat pipes).
The period of oscillation was ~21 min, which was longer than any previous transient due to the lower power draw from the core. The transient was run for several hours to look for any slow changes in power or temperature, but none were found. The TCs and power remained very steady except for minor oscillations (~1°C). Over the next 8 h (in ), the core thermostat temperature would remain essentially unchanged because the platen was not moved nor were there any significant second-order effects (the upward temperature drift was at most 1°C over 8 h).
X.B. Zero-Out Simulator Flow
The initial plan was to run for 4 h with stalled converters and zero N2 flow through the simulators. This purpose of this testing phase was to look for subtle, perhaps unexpected, changes and also to soak the Stirling converters at a very high temperature and test their restart. It was not planned to keep the simulators at low flow from T = 20 to T = 22.7; however, the PCS operator reverted to a precautionary protocol that was imposed during electrical testing. During the electrical testing of the final KRUSTY PCS assembly, it was decided to maintain a minimum flow of N2 to reduce the risk of overheating or damaging components. The PCS operator was not aware that this protocol did not apply during the nuclear test, and unfortunately, this occurred during the night shift (note that policy required that no personnel could be on-site more than 20 of the 28 h). At T = 22.7, the lead PCS operator returned and then zeroed out the flow to the simulators. Overall, this “mistake” may actually have been beneficial. Clearly, nothing out of the ordinary was happening over this planned 4-h period, regardless of low or zero N2 flow, and the change in flow provided an additional transient that could shed light on the accuracy of flowmeter readings or other diagnostics.
When the simulator flow dropped to zero, the power dropped from 1.5 to 1.35 kW, which equates to an ~30 W/simulator heat pipe. As discussed previously, the passive power loss from the simulator modules was a strong function of N2 flow, ranging from ~130 W with zero flow to only 30 W with full flow. The converter module passive losses were ~75 W with zero stroke versus ~35 W at full stroke. The estimated passive power from the core through the MLI was ~400 W. The sum of these losses from the core, the two converters, and six simulators equals ~1.32 kW, which agrees well with the observed 1.35 kW.
X.C. Restart Stirling Converters
Another important transient occurred at T = 24.0, when the Stirling converters were restarted from zero stroke (full shutdown). The converters had been sitting idle at very high temperature for 4 h and thermally soaked to ~800°C, which is well above their nominal design temperature. The converters started immediately without a problem and created a clean load-following response. As a bonus, at 800°C, the converters provided a peak power of 105 W(electric) and provided >100 W(electric) for more than 1 min as the hot end cooled down. Note that these converters were undersized and are not the proposed flight converters; they were used because of cost limitations. The flight converters, however, are planned to use the same technology.
In addition to demonstrating the restart capability of the converters, this transient provided a very predictable and easy-to-benchmark reactor load-following response. As discussed previously, the simulators have a very large surface area that can incur passive losses/gains to and from their surroundings as well as some internal uncertainty in the heat transfer. The Stirling converters have a relatively short transition from hot end to cold end, so they have lower radiative losses, and the power draw was benchmarked to stroke prior to system testing. As seen in , the quasi-steady power increased from ~1.35 to ~1.80 kW after the converters were restarted, which is a net increase of 450 W or 225 W/converter heat pipe. The nominal power draw by the converter heat pipes was ~300 W, which is ~265 W to the N2 gas and ~35 W of passive losses. This implies that when the converter stroke was set to zero, the passive losses increased to ~75 W, which is consistent with the expected increase in radiative losses due to the higher temperatures of the heat pipe and especially the hot end. During operation, the converter hot-end temperature was ~650°C, but while stalled (no active heat removal), the hot-end temperature increased to ~800°C. According to the Stefan Boltzmann law, this temperature difference would explain an approximately two times increase in radiative losses.
This converter-only transient also provided another opportunity to observe an asymmetric azimuthal temperature profile. This time, higher power was being removed at the 90 and 270 azimuths. As expected, the TCs close to 90 and 270 were relatively lower than the other azimuthal locations; the relative change was ~5°C. As seen in , the total spread in TC readings was greater during this asymmetric reduced-power condition than for the symmetric nominal power state, even though higher power usually provides a larger TC spread due to axial peaking.
X.D. Restart Nominal Flow to Simulators
At T = 25.0, the simulator N2 flow setting was reset to nominal. The fission power quickly returned close to its nominal value with the typical period of oscillation. In it can be seen that the quasi-steady power started at ~2.65 kW, which is a little lower than the previously established 2.75 kW at nominal power draw. As for the T = 14 and T = 15 transients, the reduced power is likely due to the hot infrastructure surrounding the simulators (as a result of the previous failed simulator condition), which reduced the overall passive thermal losses to the environment. The power then gradually increased back to the nominal 2.75 kW as the background surroundings cooled back toward their nominal temperature, causing simulator passive losses to increase. Flowmeter variability could also contribute to this change or to other diagnostic uncertainties, which further benchmarking should help clarify.
X.E. Stall Converters and Cut Simulator Flow
At T = 27.0, all active power removal was abruptly stopped, i.e., zero converter stroke and simulator flow. The core temperature quickly increased, decreasing reactivity, causing the power to drop shortly thereafter. During the transient, the average core TC reading rose about 16°C while the peak TC rose 11°C. This is slightly more than the temperature rise when the power was dropped at T = 20 when a small simulator flow rate was maintained. The power dropped from 2.75 kW to a minimum of 1.2 kW and started to settle at 1.35 kW, which is the same fission power that was observed when there was no active power draw from T = 23 to T = 24.
A flight system will hopefully be much better insulated and therefore would drop to a lower power level if active power removal is stopped. As mentioned previously, the thermal simulator design and configuration were not ideal for this aspect of the demonstration. When the simulators were “on” (i.e., gas was flowing through them), the body of the simulator was kept very cool (near the inlet gas temperature of ~100°C). When simulator flow was cut off, the temperature of the uninsulated top region of the simulator increased dramatically (more than expected, apparently due to natural convection of the enclosed gas), which increased the passive losses of each simulator module to ~130 W. If the project budget had allowed eight converters or if the simulator inlet region had been better insulated, then the power drop caused by loss of active heat removal would have been more prototypic. Regardless, the fundamental behavior of the reactor would have been the same no matter what the minimum power level. The T = 27.0 transient dropped the power draw from 2.75 to 1.35 kW, or about a factor of 2, and the resulting peak temperature rise was only 11°C. Even if a flight system were insulated to provide only 400 W of thermal loss (which is an extremely difficult goal), a loss of heat removal transient would only cause a peak fuel temperature rise of <20°C.
X.F. Scram
At T = 28.03, exactly 28 h after the first platen movement, a celebratory countdown in the control room led to a reactor scram. The COMET operator hit the red button that initiated a nearly instantaneous drop of the platen. This removed the BeO reflector that was surrounding the fuel and made the reactor highly subcritical (keff ≪ 1). This abrupt power drop can be seen in , aligned with the drop in the relative platen position.
However, the scram did not fully end the experiment because the drop in reactor temperature with time provided additional data for the benchmarking of the passive losses from the system. Of particular note was the drop in reactor temperature immediately after the scram because in theory this should represent a power loss of ~1.35 kW, i.e., the steady-state, load-following power before the scram. Inferring the power loss based on temperature drop is difficult immediately after the scram because of the drop-off in fission and decay power and the redistribution of heat as some temperature gradients disappeared. Five minutes after the scram, the reactor temperature drop was 1.0°C/s. At this time, all of the coupled thermal mass was being accessed to inhibit the temperature drop. Given the nominal operating temperature, the fuel thermal mass was 6.0 kJ/°C, and the balance of the well-coupled thermal mass was ~9.0 kJ/°C (which is a rough estimate that includes only the hot end of the converters). The power loss required to cool 15 kJ/°C of thermal mass by 1.0°C/s is the product of these values, or 1.5 kW, which is slightly higher than the 1.35 kW that the reactor was load-following prior to scram. However, in the scrammed KRUSTY state, the BeO was lowered significantly so that the vacuum vessel could view a colder heat sink (the radial shield) and there was a better access for ambient air to cool the vessel. Initial benchmarking indicates that this 1.5 kW is consistent with the passive losses in the scrammed state at 5 min and that 1.35 kW was consistent with the nominal reactor state.
X.G. Extended Cooldown
In the days following the scram, the roughing pumps were left on, and the NASA DAQ continued to record the system temperatures. This provided valuable data to calculate the passive thermal losses as a function of temperature. Data were recorded for 59 h following the scram, so technically, KRUSTY was an 87-h test. shows the reactor component temperatures over the entire 87 h.
Fig. 20. Component temperature data during operation and cooldown.
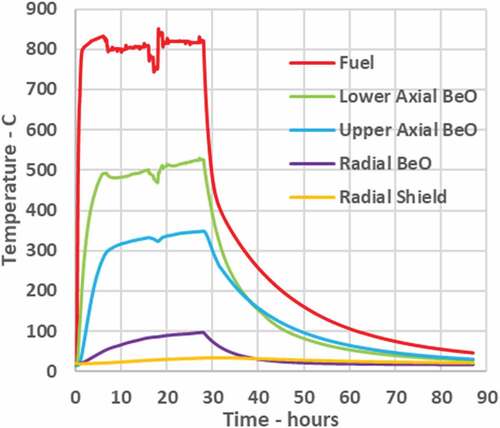
plots the average TC reading for five components: fuel, upper axial reflector, lower axial reflector, radial reflector, and radial shield. The fuel temperature for the first 28 h is simply the condensed fuel plot shown in . The upper and lower axial reflectors were separated from the fuel by five layers of MLI; the MLI was used as both a thermal and a chemical barrier. The upper axial reflector and plug shield rested on top of the upper MLI, which provided a mild, gravity-driven compressive force on the MLI. The lower axial reflector and MLI were supported by the bottom of the vacuum can. At room temperature, there was a small gap between the MLI and the fuel, but when the core heated, the expansion provided a very large compression force on the lower MLI, thus reducing the effectiveness of the insulation. This is evidenced in the axial reflector TC readings: The upper reflector reached ~350°C while the lower reflector reached ~500°C (significantly warmer because of the decreased MLI thermal resistance). The relative thermal coupling of the axial BeO regions is also evidenced in their temperature response to changes in fuel temperature (in particular, from T = 16 to T = 19); the upper BeO is much less sensitive to changes to fuel temperature because it is better insulated than the lower BeO.
The heating of the radial reflector BeO was discussed in Sec. V.B as a key component of the upward core temperature drift. shows that ~50% of the radial BeO heating was in the first 6 h and was approaching a steady-state value of 100°C in the final hours of the powered testing. This profile is consistent with the observed core temperature drift (given the positive reactivity coefficient of the radial BeO). The upper and lower BeO temperatures approached steady state in only ~6 h because of better thermal coupling to the core. After 6 h, the axial reflector temperatures increased in proportion to the radial reflector temperature because most of their heat had to be rejected though the vacuum can and radial reflector. The last component to reach steady state would be the radial shield because of its extremely high mass and low thermal connectivity. Full system steady state would have been achieved when the radial shield (and upper and lower shielding) was warm enough to reject the total power loss from the core (~300 to 400 W). At T = 28.0, the radial shield had warmed to 35°C. Full system steady state would have occurred when the radial shield reached ~40°C, perhaps at T = 48.0, if the full-power test had continued.
shows a fuel temperature drop from 820°C at T = 28.0 to 46°C at T = 87.0. The drop is rather quick until the temperature reaches ~450°C, and then, there is a distinct reduction in the rate of cooling. This kink in the cooling rate is due to the shutting down of the heat pipes. As the heat pipes shut down, the heat from the core lost access to the passive heat rejection paths/area of the condenser and Stirlings. From then on, the only path to reject heat was through the MLI.
The cooling profile of the other components reflects the impact of the platen being significantly withdrawn after scram, which lowered most of the radial BeO below the radial shield. This configuration caused the lower BeO to cool faster than the upper BeO and the radial BeO to cool faster than the radial shield. In addition, since the radial BeO had direct contact with the ambient air, it approached room temperature much more quickly than the radial shield because of its much lower thermal mass.
The impact of decay power on cooldown rate was probably rather small. At the time of scram, the decay power would have been ~80 W (~6% of 1.35 kW). Three hours after scram (when the fuel reached 450°C), the decay power was likely ~10 W, and 24 h after scram, it was ~2 W. From T = 28.0 to T = 87.0, the total decay energy would have totaled <1 MJ. Alternatively, at nominal operating temperature the system contained ~12 MJ of energy (15 kJ/°C at 800°C). Therefore, >90% of the heat rejected during cooldown was stored energy, and decay heat contributed very little. If cooldown had continued until most of the stored energy was lost, perhaps 1 week, then the fuel temperature might have settled a few degrees hotter than the environment (at the temperature required to reject a decay power of ~0.5 W). These estimates are all based on simplified assumptions and can be confirmed, or not, with more detailed benchmarking.
XI. HOW KRUSTY RESULTS APPLY TO FLIGHT KILOPOWER SYSTEMS
The biggest value of the KRUSTY test, besides showing that a flightlike system/technology worked, was to verify the simple and predictable dynamic response of a Kilopower power system—a heat pipe–cooled, compact, fast-spectrum reactor coupled with Stirling converters. There is relatively little thermal-neutronic difference between KRUSTY and any envisioned Kilopower system, from 1 and 10 kW(electric), including highly enriched uranium or low-enriched uranium. In each of these possible systems, reactivity feedback will be dominated by the fuel, and heat transfer will be governed by the same physics and technology. Low-enriched concepts will have higher fuel temperature feedback (~25%?) due to increased 238U resonance absorption. This will noticeably change the magnitude and period of oscillations but will not significantly change the overall behavior and load-following response of the system. Power level is surprisingly unimportant in determining how a neutron population behaves (because neutrons do not interact with each other), so extrapolating these reactor physics to higher-power concepts is straightforward. What affects the neutrons is how power changes the temperature and geometry; therefore, nuclear dynamics will be similar as long as a reactor is engineered to provide similar thermal behavior to KRUSTY. The tolerance to failed components (heat pipes or converters) and the load-following power range might vary for specific designs; however, in most cases the design margins can be set to achieve the desired flexibility and reliability.
It is important to note that the difference between moving the BeO radial reflector (KRUSTY) and a B4C internal rod (flight) is very small. The raising of the BeO increases reactivity by decreasing neutron leakage while withdrawing the B4C rod increases reactivity by decreasing neutron absorption. This difference will cause second-order effects on power distribution and feedback, but as far as the neutron population (i.e., power) is concerned, there is very little difference between these two reactivity mechanisms despite their different geometric locations. This is because KRUSTY is a very good example of a point-kinetics reactor, which occurs when the neutron mean free path is a significant fraction of the core geometry. In such a system, all regions of the reactor communicate very well with each other, and regional feedback effects are negligible (except for how they affect integral reactivity). Therefore, the reactor will respond the same whether reactivity is inserted externally or internally.
The reason that KRUSTY did not attempt to move the B4C rod was due to the time required to gain safety qualification for the control mechanism. The actual Kilopower mechanism will not be complicated; the only difficulty may be gaining confidence of long-term operation in a radiation environment, which is something that KRUSTY would not have demonstrated regardless. In addition, low power/lifetime applications would not require B4C rod movement after start-up (because of low-burnup reactivity loss), which could simplify qualification for that type of application. The other challenge with the control rod will be precluding inadvertent rod movement due to accident (particularly launch accidents) or human error.
Another KRUSTY-versus-flight difference is gravity: whether it is zero-g in space, micro-g during thrust, or gravity on any planetary body. The only significant way that gravity will affect operation is with heat pipe performance. The KRUSTY heat pipes had a wick in the evaporator but used thermosiphon action in the adiabatic and condenser regions. Kilopower heat pipes will have to be qualified to work in all possible environments, which is being addressed in the current Kilopower Project. Note that any gravity effects will probably only matter during start-up, when the heat pipes might try to operate at their limits, although a slow core heatup should mitigate this issue. Once any heat pipe reaches a temperature that provides substantial margin to all heat transfer limits, it should perform like those used in KRUSTY (i.e., as a relative infinite conductor). One thing made clear during KRUSTY testing was how well, and how quickly, the heat pipes reacted to changes at either the core end (evaporator) or the PCS end (condenser).
Of course, the flight PCS and heat rejection will be substantially different from KRUSTY, as well as shielding and various structural features. Launch and landing loads were only notionally considered while creating previous Kilopower designs, but these load analyses are now being incorporated into the Kilopower design process. Also, lifetime effects were certainly not demonstrated by KRUSTY. From a nuclear perspective, the neutron fluences and fuel burnup are low enough that existing data provide high confidence for long life. Nonnuclear issues like mass diffusion between dissimilar materials or material creep need to be further examined but can be mitigated with lower temperature (with a drop in efficiency) if needed. A flight program will have to adequately resolve all of these issues and more.
XII. CONCLUSIONS
KRUSTY demonstrated the operation and dynamics of a flightlike Kilopower system. As predicted, the reactor reliably load-followed the PCS power draw and was able to accommodate many potential system transients without a reactor control response. More so, the performance was very close to that predicted by the pretest design and modeling tools, which gives even more confidence in designing and qualifying a robust flight concept.
The reactor core operated for over 24 h at >800°C, ~1 h at >850°C, and at a peak temperature of ~880°C. This is by no means a life test, but it does add some confidence in higher-temperature operation. The heat pipes performed extremely well operating within their throughput limits (i.e., they behaved effectively as infinite conductors) whereas during start-up, the heat pipes struggled when they attempted to operate at or beyond their limits. However, this did not present any significant issues even with a relatively rapid 1-h ramp from room to full temperature.
The reactor load-following ability was demonstrated from 1.5 to 4 kW during the test and was only limited by the characteristics of the converters and simulators. Likewise, the 60 ¢ criticalCitation7 demonstrated load-following at 100 W of reactor power and below. Thus, the entire testing suite effectively demonstrated full load-following from 10 W to 4 kW of fission power. The reactor also operated at a fission power of >5 kW for >5 min, but the PCS could not draw enough power to maintain steady state.
Finally, the KRUSTY test was not only the first of its kind but also the first nuclear-powered operation of a truly new reactor technology in the United States for over 40 years. The data and experience should help in all future reactor development efforts and hopefully breathe life into the nuclear power community as a whole.
Acknowledgments
We would like to thank all members of the Kilopower team for their commitment to realizing the first demonstration of space fission power technology in over 50 years. We would also like to thank NASA’s Space Technology Mission Directorate and Game Changing Development Program, as well as the U.S. Department of Energy National Nuclear Security Administration’s Nuclear Criticality Safety Program for their sponsorship and vision in seeing the Kilopower technology through to the conclusion of its first groundbreaking step toward abundant, affordable power for space missions to the solar system’s most challenging and interesting locations.
References
- P. R. McCLURE et al., “Kilopower Project: The KRUSTY Fission Power Experiment and Potential Missions,” Nucl. Technol., 206, S1 (2020); https://doi.org/10.1080/00295450.2020.1722554.
- D. I. POSTON et al., “KRUSTY Reactor Design,” Nucl. Technol., 206, S13 (2020); https://doi.org/10.1080/00295450.2020.1725382.
- M. A. GIBSON et al., “Heat Transport and Power Conversion of the Kilopower Reactor Test,” Nucl. Technol., 206, S31 (2020); https://doi.org/10.1080/00295450.2019.1709364.
- P. R. McCLURE et al., “KRUSTY Experiment: Reactivity Insertion Accident Analysis,” Nucl. Technol., 206, S43 (2020); https://doi.org/10.1080/00295450.2020.1722544.
- R. SANCHEZ et al., “Kilowatt Reactor Using Stirling TechnologY (KRUSTY) Component-Critical Experiments,” Nucl. Technol., 206, S56 (2020); https://doi.org/10.1080/00295450.2020.1722553.
- T. GROVE et al., “Kilowatt Reactor Using Stirling TechnologY (KRUSTY) Cold Critical Measurements,” Nucl. Technol., 206, S68 (2020); https://doi.org/10.1080/00295450.2020.1712950.
- D. I. POSTON et al., “Results of the KRUSTY Warm Critical Experiments,” Nucl. Technol., 206, S78 (2020); https://doi.org/10.1080/00295450.2020.1727287.
- D. I. POSTON et al., “FRINK—A Code to Evaluate Space Reactor Transients,” AIP Conf. Proc., 880, 449 (2007) (published online Feb. 1, 2007); https://doi.org/10.1063/1.2437485.
- D. B. PELOWITZ, “MCNP6 User’s Manual,” LA-CP-11-1708, Los Alamos National Laboratory.
- D. I. POSTON, “Predicted Performance of the KRUSTY Reactor,” Proc. Nuclear and Emerging Technologies for Space (NETS 2018), Las Vegas, Nevada, February 26–March 1, 2018, American Nuclear Society (2018).