
Abstract
In-vessel melt retention (IVMR) is a promising strategy in severe accident management for light water reactors. This strategy is not only adopted in the VVER 440 or AP600 reactors, but also included in higher-power reactors around 1000 MW(electric), like the AP1000 and Chinese CPR 1000. There is still a large uncertainty of IVMR by external cooling at powers higher than 1000 MW(electric), and especially where a thin metallic layer appears on the top of a heat-generating oxide layer. Less knowledge based on large-scale experiments is available until now of the interactive physical, chemical, and thermohydraulic processes between the oxide layer and the metallic layer. A test series of naturally separated two liquid layers was conducted in the upgraded LIVE2D test facility in Karlsruhe Institute of Technology using a nitrate salt mixture and high-temperature oil as the lower layer and upper layer simulant, respectively. The transparent front wall of the test vessel enables direct observation of global convection patterns of the melts and the response of the crust at the layer interface. The experiment reveals major thermohydraulic characteristics of the metallic layer during the transient and steady states. The intensity of the heat flux focusing effect in dependence of layer thickness can be clearly identified.
I. INTRODUCTION
In the course of a core-melt severe accident a molten pool with decay heat may form in the lower head of the reactor pressure vessel (RPV) after the relocation of corium from the core region. This results in high thermal load on the vessel wall. In order to prevent vessel failure due to wall ablation and deformation, an accident management strategy is flooding the reactor cavity with water and thus establishing sustained heat removal by external cooling water in natural convection, as proposed first by HenryCitation1 and Theofanous and Syri.Citation2 Their analyses suggested that the external cooling strategy could protect the vessel integrity for a reactor up to 1000 WM(electric) during a steady-state configuration of a homogenous oxide corium pool.
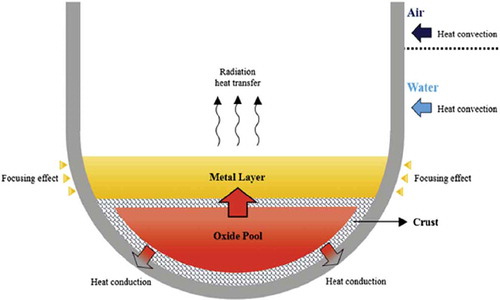
The uncertainty of maintaining the integrity of the reactor vessel increases substantially during a transient state when molten metal accumulates and is stratified from the oxide corium in the lower head during the course of melt down of the core steel structures and ablation of pressure vessel material. The stratified metallic mass positions at the top of the oxide layer because the metallic layer density is less than that of the oxide layer in the reactor case. The metallic layer receives a large portion of the heat from underneath the oxide pool, which inevitably increases its temperature. The heat in the metallic layer must be transferred through the vessel wall and from the upper surface. If the upper surface heat transfer is limited via poor radiation and the sidewall area of a thin metallic layer is small, the vessel wall is then subject to a very high heat flux. This phenomenon is known as the heat flux focusing effect, which is illustrated in . The heat flux on the vessel wall in the metallic layer is supposed to be significantly higher than the heat flux in a purely oxide pool, and it can overlay the external critical heat flux of cooling water resulting in extensive wall ablation and a noncoolable situation at this position. A thin metallic layer is of main interest since it could cause the strongest heat flux focusing effect.
Fig. 1. Heat flux focusing effect at vessel in the upper metallic layer.
However, the thermohydraulics of a stratified melt pool is very complex since it is a dynamic process with the heat transfer and material interaction between the two layers with the involvement of an interlayer crust. The extent of the heat transfer from the lower layer to the upper layer determines the existence of the crust layer and the upper layer bulk temperature. The upper layer bulk temperature determines further the sidewall heat flux, and thus the erosion of the upper layer vessel wall. The variation of the upper layer thickness regulates the upper layer bulk temperature and affects in return the heat transfer between the two layers. Although a number of experiments were dedicated to the two-layer heat transfer, the separation of the two layers of these tests was assisted with an interlayer plate, such as RASPLAV (CitationRef. 3), SIMECO (CitationRef. 4), COPO-II (CitationRef. 5), and LIVE-L6 (CitationRef. 6). To understand the interaction of the melt layers in a global process with the participation of an interlayer crust, experiments of naturally stratified melt layers with the ability to form a interlayer crust are indispensable. The selection of two compatible simulants for the melt stratification tests appears to be the largest challenge, since the two simulants should fulfill the following specifications as much as possible:
The two simulants should be nonmiscible in alarge temperature window of simultaneous liquid state.
The lower layer material can form a crust undercooling, whereas the upper layer should be still liquid.
The material properties of the layers shouldrepresent the prototypical layers.
The simulants should be chemically and physicallystable of themselves and in contact with the other simulant and with the installations inside the vessel in the operating temperature range.
The simulants should be nontoxic and easy tohandle in preparation, operation, and cleaning.
The material properties should be well known.
The eutectic nitrate salt mixture with the molar ratio of 50% KNO3-50% NaNO3 and a thermal oil were selected as the lower layer and upper layer simulants, respectively, for the LIVE2D tests. Two series of experiments have been performed: the first one with simple top insulation and the second one with top water cooling. The results of the first test series are presented in this paper. The geometry effect of a slice geometry compared to a prototypical three-dimensional hemisphere geometry is discussed in CitationRef. 7.
The aim of this study is not to attempt to provide a direct comparison between the test results and prototypical cases, but to improve the understanding of the upper layer heat transfer in general for in-vessel melt retention conditions. The aim of this study includes (1) verifying the classic heat transfer correlation on the sidewall heat transfer, (2) obtaining the global thermohydraulic behavior of the upper melt in a closed cavity with a specific boundary condition combination and involving the changing of the interlayer crust, and (3) providing data for numerical calculation, which will hopefully be capable of being applied in a reactor case.
II. LIVE2D TEST FACILITY
II.A. Facility Setup
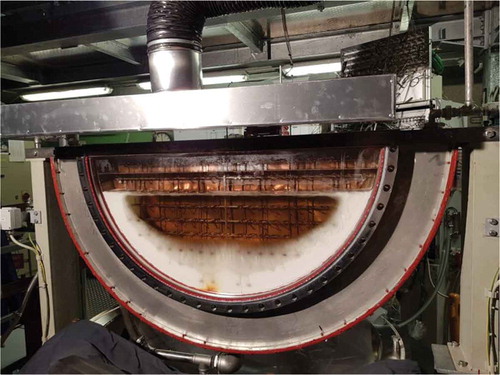
The LIVE2D test vessel in semicircular slice geometry simulates the RPV lower head () in 1:5 linear scale.Citation8 The inner diameter is 1 m, and the width is 12 cm. The vessel material is stainless steel and the wall thickness is approximately 24 mm. The top insulation boundary is realized by covering the vessel upper edge with a metallic plate, resulting in a hot air atmosphere above the melt surface, whereas the rigid top cooling means that a water-cooled steel container is placed directly on the melt surface. The vertical backside of the test vessel is insulated and the front side is equipped with double quartz plates, therefore enabling the direct visualization of the melt pool. The decay heat is simulated with nine planes of independently controlled electrical resistance heating wires. Safety monitoring and a management program are implemented to prevent power outage and melt temperature (MT) escalation. The LIVE2D shares the melt preparation system and infrastructure with the LIVE3D facility.Citation9 The liquid oxide melt can be prepared in an external heating furnace and be poured into the test vessel via a preheated pouring spout. At the end of a test, the liquid melt can be extracted back to the heating furnace.
Fig. 2. LIVE2D test vessel during the two-layer test. The upper layer thickness is 75 mm.
II.B. Simulant Material Properties
The eutectic binary nitrate salt 50% KNO3-50% NaNO3 as the lower layer simulant and the thermal oil as the upper layer simulant fulfill most of the requirements described in Sec. I, except for the material properties of the upper layer. The apparent limitation is that most liquid metals are heavier than the oxides in common use. The other limitation is the metallurgical interaction of the light liquid metal with the steel vessel material and in-vessel installations. The operational liquid temperature range of 50% KNO3-50% NaNO3 is 224°C to 400°C, whereas the operational temperature range of the thermal oil is from room temperature up to 240°C. Under the cooled boundary, the nitrate salt in the lower layer forms a crust layer. An interlayer oxide crust will form if the upper layer temperature is lower than the melting temperature of the oxide layer. The other properties of the two simulants are given in . They are interpolated values of the product data sheet, and the properties of the nitrate mixtures are provided by CitationRef. 10. The properties of liquid steel from CitationRef. 11 representing the upper layer are also given in .
TABLE I Thermal-Physical Properties of Simulant and Prototypical Materials
II.C. Instrumentation
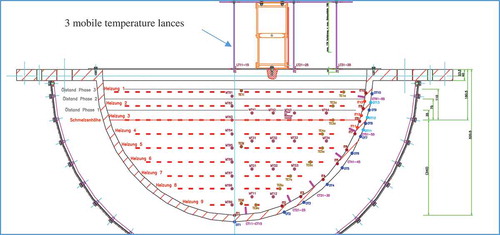
The major instrumentation inside and on the test vessel is temperature measurement with K-type thermocouples (TCs), as shown in . This includes the bulk MT, vessel wall inner surface temperature (IT), outer surface temperature (OT), boundary layer temperature at the vessel wall (CT trees), and three mobile temperature lances (LTs) installed at the vessel top in three radii. For each CT tree and LT, five TCs are arranged linearly with 5-mm distance between each other. The “HE*a” TCs measure the surface temperature of the heaters. Since only the heaters in the lower layer were heated, the HE*a in the upper layer also measures the bulk temperature. The determination of heat flux is based on the IT and OT TCs, wall thickness, and the thermal conductivity of the vessel wall. To obtain detailed heat flux data in the upper layer at various layer thicknesses, the IT and OT TCs are installed in shorter distance than in the lower layer. In the positions of the ITs and OTs and the positions of the upper layer upper boundaries are given.
TABLE II Thermocouple Positions at IT and the Upper Layer Positions
Fig. 3. Temperature measurement inside and on the test vessel.
For the optical observation of the motion of the melt and the supervision of the upper layer crust thickness, real-time video camera and time-lapse video cameras were installed in front of the transparent sidewall. The external cooling water flow rate and water temperature were frequently controlled to guarantee reliable flow rate.
III. TEST PERFORMANCE
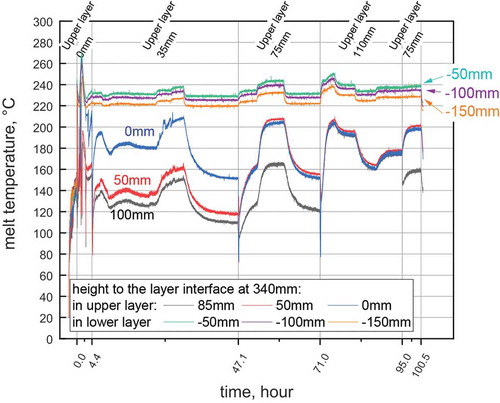
In the first test series, a two-layer melt with three upper layer thicknesses in the subsequence of 35, 75, 110, and 75 mm was realized in a nonstop 5-day operation. The lower layer thickness was kept at the height of 340 mm during the whole test. There was only volumetric heating in the lower layer, simulating the prototypical case of decay heat release in the lower oxide layer. The vessel wall was externally cooled with water and the upper surface of the vessel was covered with a thin steel plate. The test began with pouring of 250°C liquid nitrate salt in the preheated empty test vessel to a height of 340 mm. The air in the empty vessel was about 250°C before the melt pour. The time “0” is the initiation of pouring. After the stabilization of the lower layer, cooling water with ambient temperature flowed gradually into the cooling vessel. At time 4.4 h, the preheated thermal oil at 80°C was poured slowly into the vessel to realize an upper layer thickness of 35 mm. At 47.1 and 71 h additional portions of thermal oil were filled in the vessel so that the upper layer thickness increased to 75 and 110 mm, respectively. In the heating power levels are given. The power levels were selected to create scenarios that at a lower power level the interlayer crust can exist thoroughly between the layers, and at a higher power the interlayer crust should almost disappear.
TABLE III Test Procedures
IV. RESULTS
IV.A. Global Thermal Dynamic of the Two-Layer Melt Pool
Both the MT measurements and visual observation revealed several characteristics of a two-layer melt pool and the interlayer crust. The main characteristics of the global thermal dynamics in a two-layer pool are summarized in Secs. IV.A.1, IV.A.2, and IV.A.3.
IV.A.1. Long Transient State Period in the Upper Layer
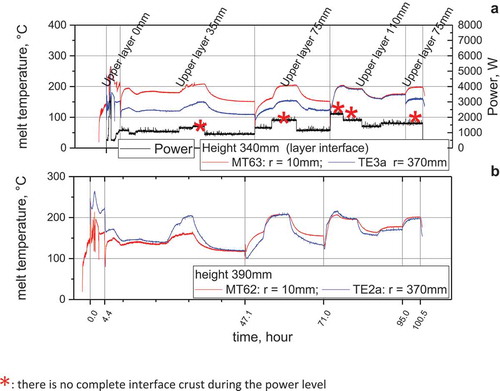
shows the response of bulk MT in the lower layer and in the upper layer. The MT transient period in the lower layer was shorter in comparison to the temperature transient state in the upper layer. During some heating level periods, the upper layer melt did not reach the steady state. The reason is the slow response of the interlayer crust to the power transition since meltdown or growing of the interlayer crust takes much longer time than the stabilization of the lower layer melt and the upper layer MT is strongly coupled with the state of the crust layer.
Fig. 4. Melt temperature progression in lower and upper layers at radius of 1 cm. The height reference is the layer interface at 340 mm.
IV.A.2. Global Melt Circulation in the Upper Layer
The natural convection in the upper layer resulted in global melt circulation. First, the melt in the axial central zone was heated up and flowed upward to the upper surface, then it drifted horizontally outward to the cooled vessel wall region. There the melt was cooled and flowed downward to the layer bottom, and thereafter, it directed back to the central region along the bottom. The global circulation resulted in different vertical temperature profiles at different radial positions. In the temperature vertical profiles at three radii are shown during the highest power level of each upper layer thickness. At the layer interface there was almost no crust at these heating powers, and thus the two layers had liquid/liquid surface contact.
Fig. 5. Vertical temperature profiles at three radii in the upper layer. There is no complete interface crust during the power level.
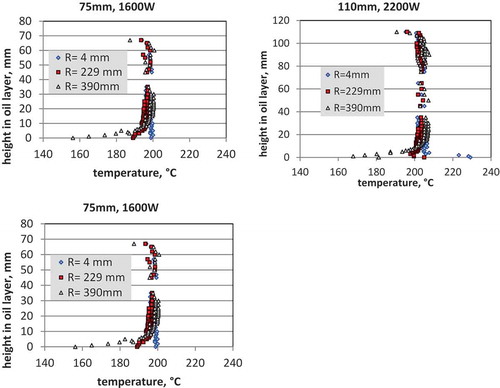
The upper melt layer temperature can be vertically divided into three zones: a lower boundary zone, a bulk melt zone, and an upper boundary zone. The lower-temperature boundary zone was about 10 mm and its temperature profiles differ largely from the center to the wall. At the bottom boundary the temperature near the wall is about 50°C lower than in the axial center. In the bulk melt zone, the temperature was homogeneous radially, and in the upper boundary, which was also about 10 mm, temperature decreased slightly from the center area to the periphery region. The multiple values of the bulk temperature at one radius in present the results of measurements from different TCs of the mobile lances at the same position. Each TC has certain system measuring uncertainty.
The existence of and the thickness of the interlayer crust correspond to the power density in the lower layer and the thickness of the upper layer. In , the power level under which no interlayer crust forms are marked with as asterisk (*). During transient states and at low heating power, the melt bulk temperature can also be divergent radially. shows the temperature difference between the central region and peripheral region under a thin upper layer and low power. However, this temperature difference disappears in thicker layers and/or higher powers.
Fig. 6. Radical MTs at (a) the layer interface and (b) at 390-mm height. (* indicates there is no complete interface crust during the power level.)
IV.A.3. Nonsynchronic Crust Formation/Melting and Nonuniform Crust Thickness During Transient State
The heat transfer through the interface of the two layers is nonuniform from the center to the vessel wall, which leads always to a thinner crust in the central region and a thicker crust near the wall. In the case of increasing power density in the lower layer, crust melting down begins at the axial center and takes a long period for its progression toward the vessel wall. During this transient period, the two layers contact directly with each other in the central region, but are separated near the wall by the interlayer crust. shows the state of the crust during a transition state. Due to the same reason after power reduction, a new crust grows from the vessel periphery gradually to the center. The upper layer heat transfer accompanies the melting or solidification process of the interlayer crust, and therefore the transient period of the upper layer is also the period of crust layer change.
Fig. 7. Two-layer melt pool: (a) the interlayer crust is partially melted down in the central region, and (b) a new interlayer crust formed after power reduction which was slightly lower than the former one.
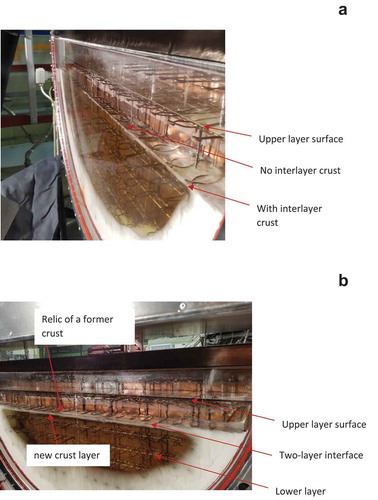
Also, a special case was observed during power reduction that the upper layer liquid flowed underneath the broken crust layer when the lower layer volume shrunk. A new interlayer crust built up beneath the former crust, and the part of the former one was conserved in the cold upper layer.
IV.B. Wall Temperature and Heat Flux
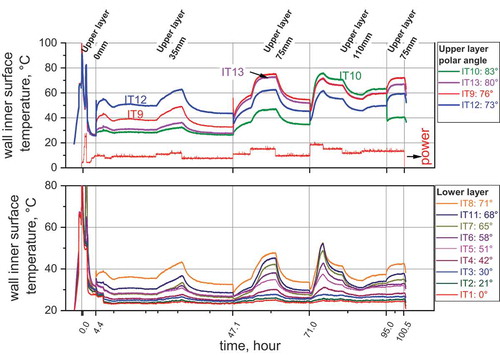
shows the progression of the wall inner surface temperature. Only IT12 was immersed in the 35-mm upper layer; IT12, IT9, and IT13 were immersed during the 75-mm upper layer; and IT12, IT9, IT13, and IT10 during the 110-mm upper layer. The wall temperature in the upper layer was considerably higher than the wall temperature in the lower layer, where this part of the wall was covered with a crust layer. Comparing the bulk temperature in and the wall temperature in , the temperature difference between the bulk melt and the wall surface was about 130°C.
Fig. 8. Wall inner surface temperature in the upper layer and lower layer.
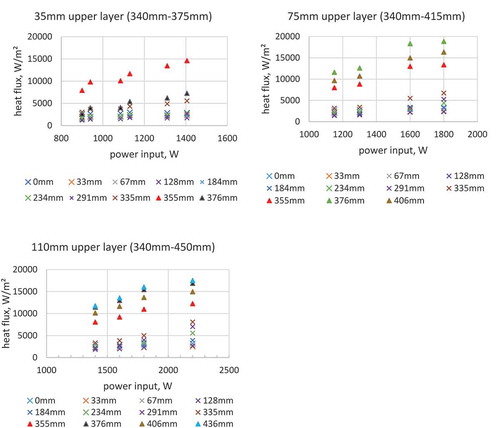
The heat flux through the vessel wall during the test is shown in . The heat flux at the upper layer was generally 2.4 to 2.7 times that of the maximum heat flux in the lower layer. This result confirms the critical scenario of the focusing effect of heat flux at the upper layer, which can easily exceed the external cooling limit under limited heat transfer capacity at the upper melt surface. For the similar upper layer bulk temperature, the highest heat flux occurs in the 75-mm upper layer instead of as usually assumed in the thinnest upper layer. In general, the heat flux at the upper location in the upper layer is higher than the heat flux at the lower position. However, there was no linear correspondence between the location and the heat flux.
Fig. 9. Heat fluxes at different height positions of the vessel wall in three upper layer thicknesses.
IV.C. Up/Down Heat Transfer Ratio and Heat Loss Ratio
The heat transfer rate through the curved vessel wall surface in the range of the two melt layers is the area integration of heat flux. In the upper wall/lower wall heat transfer ratios are given. The heat transfer ratio in the upper layer enhances strongly with layer thickness. For a same upper layer thickness, this ratio reduces slightly at high power in the lower layer and the interlayer crust disappears. The reduction of the heat transfer ratio through the layers is traced back to two facts: (1) In the lower layer the bulk MT increases with a higher power input, and thus the heat transfer in the lower layer vessel wall increases, and (2) without interlayer crust the interlayer temperature is higher than the melting temperature of the crust. This eventually leads to a lower temperature difference between the bulk and the upper boundary of the lower layer for the upward convection heat transfer.
TABLE IV Upper Wall/Lower Wall Heat Transfer Ratio and Heat Loss Ratio
also shows that only about a 0.35 to 0.45 portion of the heat input was transported through the vessel wall covered by the melt. The rest of the heat is supposed to be mostly transferred through the front quartz wall, as quartz is transparent for the thermal radiation. The other sources of the heat loss could be via the upper vessel plate, the uncooled construction parts of the vessel, and the vessel wall above the melt surface.
V. DISCUSSION
V.A. Influence of the Prandtl Number
The simulant material for the upper layer has a considerably higher Prandtl number than that of liquid metal, which is usually in the range of 0.01 to 0.001. It is therefore expected that in a metallic layer a very massive temperature boundary layer exists on the cooled wall, contrary to the LIVE2D experiment, where a homogenous bulk temperature zone dominated the whole region of the upper layer. For a liquid layer with a large radial temperature gradient from the axial center to the vessel wall, the interlayer crust behavior already observed in the LIVE2D test, such as nonsynchronic crust melting/formation and nonuniform crust thickness, will be more profound in a metallic layer.
V.B. Heat Flux and the Layer Thickness
Under the same bulk MT, the highest local heat flux in the experiment appeared at the 75-mm layer thickness, thus it is not consistent with the assumption that the highest heat flux appears at the case with the thinnest upper layer. The reason could be that the heat transfer at the side vessel wall is very effective in a thinner layer since the colder wall region is located very close to the hot spot. The thermal conduction inside the vessel wall can be very effective under a thick vessel wall, which is a desired situation before the extensive ablation of the vessel wall at the upper layer occurs.
VI. CONCLUSIONS
A series of LIVE2D tests with an immiscible two-layer melt pool under external cooling conditions were performed simulating the critical situation of a light metallic layer on top of a power-dissipating oxide layer in the RPV lower head. A kind of thermal oil and the eutectic mixture of KNO3/NaNO3 nitrate salt simulated the upper layer and the lower layer of corium, respectively. The vessel was covered with a steel plate on the top and cooled externally with water. Three upper layer thicknesses were realized. The transparent front wall and the temperature measurements inside and on the vessel wall surface revealed several global heat transfer phenomena. During a transient state with increasing or decreasing power in the lower layer, the crust meltdown or growth at the interlayer is not synchronic. This results in a longer transient state in the upper layer. During the transient state where crust only partially exists at the two-layer interface, the upper layer and lower layer contact with each other directly in the central area, but are separated by the crust near the vessel wall. The upper layer melt moves in a global circle under the bottom heating and sidewall cooling boundary condition. The heat flux in the upper layer is several times higher than the maximum heat flux in the lower layer. The highest local heat flux appeared at the 75-mm upper layer thickness under the same upper layer bulk temperature.
Acknowledgments
The study was funded by the EU-H2020 IVMR project under the grant agreement 662157 and the Helmholtz Society in Germany.
References
- R. HENRY, “External Cooling of a Reactor Vessel Under Severe Accident Conditions,” Nucl. Eng. Des., 139, 1, 31 (1993); https://doi.org/10.1016/0029-5493(93)90260-G.
- T. THEOFANOUS and S. SYRI, “The Coolability Limits of a Reactor Pressure Vessel Lower Head,” Nucl. Eng. Des., 169, 1–3, 59 (1997); https://doi.org/10.1016/S0029-5493(97)00024-1.
- V. ASMOLOV et al., “Study of Thermal Hydraulic Processes in a Stratified Molten Pool,” OECD7/SCNI MASCA Seminar, Aix-en-Provence, France (2004).
- A. GUBAIDULLIN and B. SEHGAL, “SIMECO Tests in a Melt Stratified Pool,” presented at the 10th Int. Conf. Nuclear Energy, April 14–18, 2002, Arlington, Virginia (2002).
- M. HELLE, O. KYMÄLÄINEN, and H. TUOMISTO, “Experimental COPO II Data on Nature Convection Homogenous and Stratified Pools,” presented at the 9th Int. Topl. Mtg. Nuclear Reactor Thermal Hydraulics, San Francisco, California (1999).
- X. GAUS-LIU and A. MIASSOEDOV, “Heat Transfer of Stratified Melt Pool in LWR Lower Head Under External Cooling and Different Upper Boundary Conditions,” presented at the 11th Int. Topl. Mtg. Nuclear Reactor Thermal-Hydraulics, Operation and Safety, October 9–13, 2016, Gyeongju, Korea (2016).
- X. GAUS-LIU, A. MIASSOEDOV, and S. GABRIEL, “Review of Experimental Studies on the Heat Transfer Behaviour of Volumetrically-Heated Pool with Different Boundary Conditions and the Influence of Crust Formation,” presented at the 24th Int. Conf. Nuclear Energy, June 26–30, 2016, Charlotte, North Carolina (2016).
- B. FLUHRER et al., “Experiment in the LIVE-2D Test Facility at KIT on Melt Behavior in RPV Lower Head,” presented at the 15th Int. Topl. Mtg. Nuclear Reactor Thermal Hydraulics, May 12–17, 2013, Pisa, Italy (2013).
- X. GAUS-LIU et al., “Experimental Study of the Melt Pool Heat Transfer in LWR Lower Head Under Different Upper Boundary Conditions,” presented at the 12th Int. Topl. Mtg. Nuclear Reactor Thermal-Hydraulics, Operation and Safety, October 14–18, 2018, Qingdao, China (2018).
- G. JANZ et al., “Physical Properties Data Compilations Relevant to Energy Storage. II. Molten Salts: Data on Single and Multi-component Salt System,” U.S. Department of Commerce (1979).
- T. THEOFANOUS et al., “In-Vessel Coolability and Retention of a Core Melt,” Nucl. Eng. Des., 169, 1–3, 1 (1997); https://doi.org/10.1016/S0029-5493(97)00009-5.