
 ?Mathematical formulae have been encoded as MathML and are displayed in this HTML version using MathJax in order to improve their display. Uncheck the box to turn MathJax off. This feature requires Javascript. Click on a formula to zoom.
Abstract
This paper presents an overview of Pronghorn, a multiscale thermal-hydraulic (T/H) application developed by Idaho National Laboratory and the University of California, Berkeley. Pronghorn, built on the open-source finite element Multiphysics Object-Oriented Simulation Environment (MOOSE), leverages state-of-the-art physical models, numerical methods, and nonlinear solvers to deliver fast-running advanced reactor T/H simulation capabilities within a modern software engineering environment. This work summarizes the physical models, multiphysics and multiscale coupling, and numerical discretization in Pronghorn with emphasis on our initial target application to pebble bed reactors (PBRs). A diverse set of applications are shown to depressurized natural circulation in the SANA experiments, forced convection in the Pebble Bed Modular Reactor, three-dimensional (3-D)/one-dimensional coupling of Pronghorn and RELAP-7 systems T/H for loop analysis in the High Temperature Reactor Power Module, and forced convection in the Mark-1 Pebble Bed Fluoride-Salt-Cooled High-Temperature Reactor. A multiphysics coupling of Pronghorn, RELAP-7, and Griffin deterministic neutronics for a gas-cooled PBR demonstrates the capability of the MOOSE framework for reactor design calculations. These applications highlight the verification and validation underlying Pronghorn’s software development while emphasizing features that improve upon capabilities offered by legacy tools in areas such as 3-D unstructured meshing, physics modeling, and multiphysics coupling.
Keywords:
I. INTRODUCTION
Many systems exhibit wide ranges in temporal and/or spatial scales such that the use of models that resolve all length scales are computationally impractical. Examples of such systems include Earth’s climate, drugs targeting cancer cell growth, fluid flow, and pebble bed reactors (PBRs). A typical PBR core consists of hundreds of thousands of centimeter-size fuel pebbles, each of which consists of thousands of millimeter-size, multilayer, coated fuel particles (CFPs). PBRs are expected to display excellent heat removal due to the capacity of large quantities of graphite for storing and transferring heat, the high failure temperatures of particle fuel, and the low reactor power densities involved. However, a significant challenge associated with PBR modeling is accurately representing the thermal and flow physics in the complex solid-fluid core structure. The different thermal properties of the CFP layers, combined with the macroscopic fission power distribution and flow boundary conditions (BCs), result in material temperatures that vary strongly both within each pebble and with each pebble’s location in the bed. Models that crudely approximate or neglect this heterogeneity tend to significantly underpredict material temperatures, which may not be conservative for fuel integrity and source term estimates.Citation1–3
The spatial length scales relevant to the coarse-mesh thermal-hydraulic (T/H) analysis of PBRs are separated by six orders of magnitude, from the smallest layer thickness in a CFP of approximately 10−5 m, for which temperatures drive Doppler feedback and a number of material degradation processes, to the largest dimension in the core of approximately 101 m, over which heat and mass transfer affect important large-scale performance and safety criteria such as the feasibility of natural circulation and the presence of mixing-induced stresses. Meshes that resolve all pebbles and particles require trillions of elements to capture the complex geometry and boundary layers such that full-core high-resolution analysis is currently out of reach. In addition, the lack of a natural unit cell in the randomly heaped pebbles complicates any type of “hot channel” analysis.
This paper introduces a new multiscale, coarse-mesh, T/H application under development by Idaho National Laboratory (INL) and the University of California, Berkeley (UCB). This application, Pronghorn, delivers tightly coupled multiscale and multiphysics T/H solutions for intermediate-resolution reactor simulation while leveraging advancements in physical models, numerical methods, and nonlinear solvers within a modern software engineering environment. Pronghorn is built on the Multiphysics Object-Oriented Simulation Environment (MOOSE), an open-source parallel finite element (FE) framework with a plug-and-play infrastructure that enables applied mathematics practitioners to translate physics models into high-performance computational tools.Citation4
The objective of this paper is to describe the multiscale T/H models in Pronghorn and to demonstrate the code’s capabilities for predicting a wide variety of PBR core thermal and flow phenomena. Specific emphasis is placed on the unstructured three-dimensional (3-D) meshing, in-memory multi-application data transfer, and flexible physics extensions enabled by development upon a modern computing framework that relax many of the restrictions common to earlier PBR simulation tools. All demonstration problems shown in this work are based on gas- and salt-cooled PBRs, reflecting the initial development emphasis on these systems. However, the general nature of the physics models and the ease of extending an object-oriented closure system places Pronghorn’s development in the larger scope of enabling multidimensional, intermediate-resolution, T/H analysis for wide classes of advanced reactors.
The remainder of this paper is organized as follows. Section II introduces the concept of multiscale analysis and describes Pronghorn’s physics models in terms of three characteristic lengths: the macro, meso, and micro length scales. Section III outlines scale and physics coupling with MOOSE’s in-memory multi-application system. A high-level description of the parallelization, spatial and temporal discretization, meshing, and software engineering practices underlying all Pronghorn physics simulations is provided in Sec. IV.
Sections V through IX then present a number of example applications to gas- and salt-cooled PBRs. In Sec. V, model validation and code-to-code comparisons for depressurized conduction cooldown in the SANA experiments demonstrate Pronghorn’s capacity for predicting natural convection decay heat removal in gas-cooled PBRs. Section VI presents code-to-code comparisons for the standalone T/H exercise of the Pebble Bed Modular Reactor 400 MWth (PBMR-400) benchmark, illustrating the wider applicability of Pronghorn’s models to forced convection and a number of ex-bed heat transfer processes.
Both Secs. V and VI demonstrate that Pronghorn’s friction-dominated model retains the predictive capabilities of the simulation tools that have historically been used for PBR analysis. Sections VII and VIII then highlight new features in the form of multi-application coupling and 3-D unstructured meshing. Section VII describes a non-overlapping domain decomposition coupling of Pronghorn’s Navier-Stokes model with Reactor Excursion and Leak Analysis Program 7 (RELAP-7) (CitationRef. 5) for loop analysis in a gas-cooled PBR. A 3-D/one-dimensional (1-D) coupling in the reflector enables the prediction of bypass flows and conjugate heat transfer, both essential capabilities for assessing maximum core temperatures and component lifetime.
To contrast with the gas applications shown in Secs. V, VI, and VII, Sec. VIII applies Pronghorn’s multiscale model to the Mark-1 Pebble Bed Fluoride-Salt-Cooled High Temperature Reactor (PB-FHR), a LiF-BeF2 (FLiBe)-cooled PBR design. To complement previous verification activities for geometries more characteristic of gas-cooled fuel pebbles, Sec. VIII.A compares the mesoscale and microscale fuel models against fully resolved pebble heat conduction. And to contrast with the 3-D/1-D bypass modeling approach in Sec. VII, Sec. VIII.B combines a porous media model of the PB-FHR reflector blocks with a full-core multiscale model for steady-state analysis.
Finally, Sec. IX presents a multiphysics coupling of Pronghorn with Griffin deterministic neutronicsCitation6–8 and RELAP-7 systems-level T/H for a prototypic gas-cooled PBR. This concluding example demonstrates how the flexible multi-application system common to all MOOSE-based applications enables the comprehensive multiphysics analysis required for reactor design calculations and confirmatory analyses. Section X then concludes the paper and describes several areas of future work.
II. COARSE-MESH MULTISCALE T/H MODEL
Multiscale analysis is a branch of applied mathematics that is based on decomposing a complex system into a number of important temporal and/or spatial length scales, each described by different models that are then aggregated together to obtain a representative physics solution over many orders of magnitude in time and/or space.Citation9 Provided the models for each characteristic scale are sufficiently simple, the computational cost of a multiscale decomposition may be orders of magnitude lower than a fully resolved model.
Pronghorn is a coarse-mesh multiscale T/H solver that approximates the thermal and flow physics in a complex fluid-solid structure in terms of three length scales. In the context of PBRs, these three length scales are (1) the macroscale, defined over the entire core, which encompasses the pebble bed, reflectors, and structural materials; (2) the mesoscale, which is defined over a single fuel pebble; and (3) the microscale, which is defined over a single CFP. This section introduces the models for each of these characteristic scales and the closures that retain the macroscale effects of local heat and mass transfer. Section II.A describes the porous media macroscale model, while Sec. II.B describes the mesoscale and microscale models.
Rather than serve as a comprehensive reference for all available models, the emphasis of this paper is on demonstrating the analysis capabilities of Pronghorn. The reader is referred to the theory manual for a complete description of the physics models, discretization, and numerical solution to complement the present high-level discussion.Citation10
II.A. Macroscale Model
The macro length scale characterizes the two-phase mixture of fluid coolant and solid pebbles over a representative elementary volume (REV) with a length intermediate to the finest solid structure scale and the largest dimension of the heterogeneous domain. The thermal and flow physics on this scale concern the large-scale interactions of the pebble-coolant system with spatial- and time-dependent core BCs, fission power, and material property distributions; reactor control systems; and the balance of plant (BOP) for power generation and transient propagation. On the macro length scale, T/H models must be able to predict temperatures in the coolant and core structures, thermal gradients and cyclic stresses, bypass flows, pressure losses, and heat removal in a number of forced and natural convection regimes at either pressurized or depressurized conditions.
Of course, hydraulics in a nuclear reactor is characterized by many more length scales than the REV-averaged length scale modeled in a coarse-mesh tool such as Pronghorn. For instance, turbulent flows may be characterized in terms of the Kolmogorov scale, which is much smaller than the typical PBR REV scale, which tends to be on the order of several pebble diameters. In lieu of modeling the hydraulics on these other length scales with Pronghorn, the averaged effects of these scales on Pronghorn’s fluid macro length scale are approximated through the inclusion of model closures for convective heat transfer, thermal dispersion, pressure loss, and effective heat transfer. These closures are generated with off-line experimental and numerical experiments as a function of flow state and geometry and appear in advective, diffusive, and source kernels in Pronghorn’s macroscale model. Therefore, while Pronghorn is referred to here as a multiscale analysis tool, it should be recognized that the macroscale closures are obtained from correlations derived from physical experiments and resolved turbulence simulations, and not from Pronghorn itself. While these closures are presently selected a priori to a Pronghorn simulation, Sec. V discusses a prime application area for on-line coupling of Pronghorn to a turbulent flow solver to increase the range of fluid length scales explicitly modeled.
Pronghorn’s macroscale model is derived by averaging the Navier-Stokesequations with conjugate heat transfer in space over a heterogeneous REV to give what are known as the “porous media” equations. Assuming thermal non-equilibrium between the phases, this equation set includes conservation of fluid mass, fluid momentum, fluid energy, and solid energy:
and
where
| subscript | = | fluid phase |
| subscript | = | solid phase |
| = | intrinsic fluid velocity | |
| = | pressure | |
| = | temperature | |
| = | gravitational acceleration | |
| = | density | |
| = | total specific energy | |
| = | total specific enthalpy | |
| = | isobaric specific heat | |
| = | volumetric heat source. |
EquationEquations (1)(1)
(1) through (Equation4
) are referred to here as the “Navier-Stokes” model. The porosity is assumed independent of time because pebble motion during on-line refueling occurs on much longer timescales than fluid motion, while the pebble kinetic energy in fluidized molten-salt beds is also negligibly small.Citation11
The viscous shear stress is approximated as the sum of a distributed loss friction term and a Brinkman stress term with effective viscosity
. While the Brinkman stress term is available for completeness, it is assumed zero throughout all applications in this paper due to scant experimental justification for its inclusion in pebble beds.Citation12–14 The remaining unidentified terms in EquationEqs. (1)
(1)
(1) through (Equation4
) are described shortly.
In addition to the Navier-Stokes model, a “friction-dominated” model is available as a faster-running alternative for flows with momentum conservation dominated by friction and pressure effects. The friction-dominated model is derived from EquationEqs. (1)(1)
(1) through (Equation4
) by setting the total derivative of momentum and the Brinkman stress term to zero to obtain a pseudo-steady momentum equation that is then substituted into EquationEq. (1)
(1)
(1) to obtain a pressure Poisson equation. Then, subtracting conservation of mechanical energy from EquationEq. (3)
(3)
(3) to obtain a statement of fluid internal energy conservation, the friction-dominated model is given as
and
The solid energy conservation in EquationEq. (8) is the same as that in EquationEq. (4)
. At the consequence of neglecting momentum advection and time delays between changes in momentum and changes in pressure, the friction-dominated model is commonly used as an approximation to PBRs for slowly evolving, low-Reynolds-number flows.Citation14–16
During the spatial-averaging process, several closures arise to capture the macroscale effect of local interphase momentum and energy transfer. In EquationEqs. (1)(1)
(1) through (Equation4
),
is the porosity, or the fraction of the REV that is fluid. Far from walls, the porosity of sphere-packed beds is typically in the range of 0.36 to 0.42 (CitationRef. 17), but the point-contact ordering along flat walls introduces a strong dependence on wall distance that extends about five pebble diameters into the bed. The lower resistance in the near-wall region can introduce significant in-core flow bypass that cannot be accurately represented with 1-D T/H tools without explicit consideration of the bed–to–pebble diameter ratio in closures for
,
, and
. With a few exceptions for
(CitationRef. 18), these geometric modifications are often unavailable, necessitating multidimensional simulation tools. Pronghorn includes models for constant, piecewise linear, exponential, and oscillatory porosity functions with several rudimentary methods for combining multiple 1-D functions to approximate the multidimensional effect of interacting walls.
The interphase friction factor is proportional to the distributed momentum loss of the fluid as it flows around solid obstructions and is typically expressed as the sum of a frictional resistance proportional to
and an inertial resistance proportional to
, where
is the fluid viscosity,
is the speed, and
is the hydraulic diameter. For beds of spheres, Pronghorn includes models that assume constant proportionality coefficients, such as the Ergun model,Citation19 as well as models that consider a flow regime dependence, such as the KTA model.Citation20 While the pebble bed is assumed isotropic, anisotropic porous media such as reflector blocks are modeled with a diagonal tensor
with coefficients unique to each coordinate direction.
The interphase convective heat transfer coefficient , with units of W m−3 K−1, represents the convective heat transfer coefficient
per unit of wetted length. For beds of spheres, Pronghorn includes Nusselt number models that reduce to the single-sphere limit of Nu = 2 as
, such as the Gnielinski model,Citation17 as well as models that reduce to Nu = 0 as
, such as the KTA model.Citation21 General isotropic interphase convective heat transfer coefficient closures may be defined for other porous media.
The fluid effective thermal conductivity represents the sum of phase conduction and thermal dispersion correlated by a gradient diffusion model. Thermal dispersion, sometimes referred to as the “braiding” effect, represents the enhancement in advective energy transport due to mixing, pore recirculation, and eddy diffusion in the porous fluid-solid structure. For beds of spheres, Pronghorn includes an isotropic model that represents
as the sum of the phase conduction contribution
, where
is the fluid thermal conductivity, and the thermal dispersion contribution, represented with a linear dependence on the Peclet number.Citation22 For general porous media such as reflector blocks, the thermal dispersion contribution is typically neglected such that
is given as
.
Finally, is the solid effective thermal conductivity, which represents the sum of three effective heat transfer processes in the solid phase: (1) conduction in the solid and radiation across voids in a transparent fluid, (2) conduction in the multiphase mixture, and (3) conduction in the solid and at solid-solid contact areas. In loss-of-coolant or loss-of-forced-circulation (LOFC) events where convective cooling capabilities are severely degraded, the mechanisms represented by
become the dominant heat removal paths, and solid temperatures can be sensitive to models for
(CitationRef. 23). For beds of spheres, most of the models in Pronghorn for
are based on extensions of a theoretical model developed by Zehner, Bauer, and Schlünder that is derived from a cylindrical unit cell containing an octant of a pebble surrounded by fluid.Citation24,Citation25 The models primarily differ from one another in the unit cell heat transfer network, the radiation BCs to neighboring unit cells, and the calculation of sphere contact areas. For general porous media, the radiation and contact conduction contributions are neglected and the multiphase conduction component is assumed given as a phase average of the thermal conductivities.
Fluid properties are provided by MOOSE’s open-source fluid properties module, enabling cohesive property closures in multi-application simulations. Solid properties required by the macroscale model and the lower-length-scale models in Sec. II.B are provided by published correlations implemented in Pronghorn.
The macroscale models in EquationEqs. (1)(1)
(1) through (Equation4
) and (Equation5
(5)
(5) ) through (Equation8
) are applicable to a wide variety of porous media. While the original target application is to PBRs, Pronghorn’s models are relevant to a much more diverse set of multiphase fluid-solid systems such as tube-in-shell heat exchangers,Citation26 quenched corium heaps,Citation27 tritium breeder blankets in fusion reactors,Citation28 and pin-fueled fission reactors.Citation29 The object-oriented software design structure enables rapid extensions of the macroscale closure system to accommodate these new systems.
II.B. Mesoscale and Microscale Models
The meso length scale characterizes heat conduction on the scale of the largest dimension of the solid phase; for PBRs, this length scale corresponds to a pebble, while for pin-type reactors, this length scale corresponds to a pin. The thermal physics on this scale concern the energy exchange between the solid and fluid phases and interactions between interphase heat transfer and spatial- and time-dependent solid surface temperature BCs and fission power.
The micro length scale represents heat conduction on the scale of the smallest “mesoscale-relevant” dimension of the solid phase. Heat conduction in reactor fuels such as UO2 pins in light water reactors is well approximated by the heat equation with smooth spatial distributions of material properties and fission power. In contrast, the thousands of CFPs in PBR fuels beget extremely heterogeneous temperature and power distributions on the pebble scale. The restriction of most of the power generation to the central fissile kernel, combined with the low-conductivity porous buffer layer surrounding the kernel, result in significantly different temperatures in the CFPs than in the surrounding matrix. Models that crudely approximate or neglect this heterogeneity tend to significantly underpredict fissile material temperatures; therefore, the predictions of these models may not be conservative for fuel integrity and source term estimates.Citation1–3
On the meso and micro length scales, T/H models must be able to predict maximum temperatures to ensure margin to fuel failure limits and material-wise average temperatures for thermal feedback. For solid phases that lack a distinct thermal micro length scale, such as UO2 pins, the solid temperature is modeled by the heat equation:
where the subscript uppercase indicates that the thermal properties, volumetric heat source, and temperature correspond to the interior of the solid phase. The subscript uppercase S is distinct from the subscript lowercase
used to denote the intrinsic phase-averaged quantities in EquationEqs. (4)
and Equation(8)
.
For heterogeneous solids such as PBR fuel pebbles, the solid temperature is modeled with the heat source decomposition (HSD) method.Citation30 The HSD is described here in terms of CFPs in a matrix, but the concept is quite general and applicable to more diverse systems such as fully ceramic microencapsulated fuels and dispersion fuels.Citation31,Citation32 The HSD is based on the notion of splitting a heterogeneous heat source into a spatial average
and a fluctuation
:
where the spatial average of the fluctuation is zero. Each heat source on the right side of EquationEq. (10)(10)
(10) is then used in a separate conduction equation. The conduction equation based on the average heat source is referred to as the “mesoscale” model:
where ,
, and
represent spatially homogenized thermal properties. Pronghorn includes simple homogenization methods such as series and parallel averages based on material volume fractions, as well as more complex binary mixing methods based on Maxwell’s potential theory.Citation33 EquationEquation (11)
is solved over a domain representing the extent of the heterogeneous region. The mesoscale temperature
represents the long-wavelength thermal solution due to the average heat source and average properties.
The conduction equation based on the fluctuating heat source is referred to as the “microscale” model:
where ,
, and
represent the thermal properties resolved on the fine scale. EquationEquation (12)
(12)
(12) is solved on domains representing a single CFP plus a surrounding matrix region that preserves the overall material volume fractions.
The approximate solid temperature solution is the superposition of the two solutions:
where the summation over the number of CFPs indicates that the microscale solution
for the i’th particle is translated to the location
corresponding to the center of that particle.
At the boundary of the heterogeneous domain, which for conventional PBR fuels is the interface between the fuel-matrix region and the outer graphite shell, continuity in temperature and heat flux is required of the superposition given in EquationEq. (13)
(13)
(13) . Further, a Dirichlet BC is applied on the boundary of the microscale domain such that the average of the microscale solution over the domain
is zero:
Additional implementation details and an example application to a nine-particle CFP domain are available elsewhere.Citation2
The HSD method requires the heat equation to be linear because superposition is used to split the length scales. Because temperature-dependent properties result in a nonlinear equation, the HSD method as described is restricted to the use of temperature-independent properties. Ongoing work at INL involves the incorporation of property temperature feedback by applying the HSD in a series of constant-property annuli with an outer iteration that converges layer-averaged temperatures and thermal properties.
III. MULTISCALE AND MULTIPHYSICS COUPLING
All applications built on the MOOSE framework leverage a highly parallelized data communication system to achieve in-memory multiphysics coupling. Data transfer between applications in the form of source terms, BCs, material properties, and other forms of nonlinear feedback are resolved on each time step with relaxed Picard iteration. The flexible nature of the coupling system allows communication between different spatial meshes with physics-specific time steps for efficient computational resource utilization.
The coupling between the macro, meso, and micro length scales is achieved with MOOSE’s multi-application coupling system. In each time step, the models for each length scale are solved iteratively until convergence of the temperatures, pressures, and velocities. A “master” application first solves the porous media macroscale model in the core. In each computational element of the macroscale mesh, a volume-averaged solid surface temperature from the macroscale solution is applied as a uniform surface BC on a mesoscale model. The source term in this “representative” pebble is obtained as a volume average of the macroscale power distribution in the element.
Then, a “sub”-application representing the meso length scale solves the mesoscale model given a previous microscale solution in each element of the mesoscale mesh. In each computational element of the mesoscale model, a volume-averaged heat source is then applied as a source term to a “representative” CFP. A further-nested “sub”-application representing the micro length scale then solves the microscale model. BCs representing continuity in heat flux and temperature are then enforced in the summation in EquationEq. (13)(13)
(13) by repeating the meso-micro coupled solution until convergence of the temperature. Ongoing work at INL involves the implementation of a heat flux calculation on the pebble surface to serve as a source term in the macroscale model to complete the multiscale coupling for transients. Therefore, all results in this work are restricted to steady state where time integration of a pseudo transient eliminates variations in the time delay associated with heat generation in the solid and deposition in the coolant. Further details on the multiscale coupling implementation are available elsewhere.Citation2
A key strength of application development within the MOOSE framework is the ability to build complex multiphysics simulations for comprehensive reactor analysis based on the same multi-application coupling system used within Pronghorn for scale coupling. Pronghorn is intended to provide intermediate-fidelity T/H feedback to analyses involving neutron transport with Griffin, systems-level T/H with RELAP-7 and Safety Analysis Module (SAM) (CitationRefs. 5 and Citation34), and material performance with BISON (CitationRef. 35). Griffin is a joint Argonne National Laboratory (ANL)/INL effort in joining the capabilities of the MOOSE-based reactor physics application MAMMOTH (CitationRef. 36) (which uses the neutron transport solvers implemented in RattlesnakeCitation6) with the ANL-based MC2-3 and PROTEUS (CitationRefs. 7 and Citation8). While Secs. V, VI, and VIII focus on standalone T/H calculations with Pronghorn, Secs. VII and IX demonstrate multiphysics simulations based on the MOOSE framework considering systems-level T/H and neutronics feedback.
IV. DISCRETIZATION, SOLUTION, AND SOFTWARE ENGINEERING
Pronghorn is built on the MOOSE framework, which combines the libMesh finite element method (FEM) libraryCitation37 with the nonlinear solution and preconditioning capabilities of the Portable, Extensible Toolkit for Scientific ComputationCitation38 (PETSc). The Parallel Graph Partitioning and Fill-Reducing Matrix Ordering (ParMETIS) library provides parallel mesh partitioning, while libMesh provides Adaptive Mesh Refinement (AMR). Combining these two features, MOOSE simulations have demonstrated scalability to over 30,000 cores.Citation39
The weak forms of the macroscale, mesoscale, and microscale models are discretized with the continuous FEM with Streamline Upwind Petrov-Galerkin (SUPG) stabilization applied to the fluid conservation equations. The use of a FE spatial discretization permits the use of unstructured meshes based on a wide variety of element types, while MOOSE’s dimension-agnostic formulation enables solution of 1-D, two-dimensional (2-D), 2-D r-z, 3-D, and 3-D spherically symmetric geometries. Therefore, Pronghorn can accommodate the 3-D unstructured meshes needed to represent the conical fueling cones common to most PBRs and to simulate asymmetric phenomena such as control rod ejection. This capability relaxes the axisymmetric restrictions common to many earlier PBR analysis toolsCitation14 while retaining a fast-running 2-D r-z option. In addition to a FE discretization, a finite volume discretization of the classical Euler equations has recently been added to Pronghorn in order to increase convective stability and improve solver performance for high-speed flows.Citation40 Ongoing efforts are focused on extending this implementation to include Pronghorn’s Navier-Stokes and friction-dominated models, and as such, all simulations performed in this work are based on the FEM. Finally, time integration with a wide variety of implicit and explicit schemes is available.
The equations describing each length scale are solved with a Newton-Krylov method with the Generalized Minimal Residuals (GMRES) linear solver.Citation41 Automatic differentiation is used to calculate Jacobians, dramatically reducing application development and runtime relative to by-hand derivations. The macroscale porous media model may be solved for either primitive (,
,
) or conservative (
,
,
) variables depending on the compressible nature of the flow.
As a coarse-mesh solver, Pronghorn is geared toward solutions on personal machines and higher-end workstations. As a rough example of runtimes expected for target PBR applications on converged meshes, steady-state coupled Griffin diffusion neutronics and Pronghorn T/H simulations of the PBMR-400 benchmark require only 3 min on a 2018 MacBook Pro with a six-core, 2.6-GHz Intel Core i7 processor and 16 GB 2400 MHz DDR4 SDRAM when run with four MPI processes.
High-quality software is essential to support the safety analysis of nuclear reactors. The MOOSE framework uses a software engineering design incorporating git version control, GitHub pull requests and peer review, and continuous integration (CI) with regression and unit tests of the framework and registered applications such as Pronghorn. Pronghorn shares many of these best practices, including an INL GitLab repository with issue tracking and peer review of proposed changes, a navigable HTML web page user guide built from in-source Markdown files, and a thorough CI regression test suite. An important objective of this design is to ensure high code quality, backward compatibility, and maintainability for future extensions to non-PBR systems.
Pronghorn’s test suite includes method of manufactured solutions (MMS) solution verification of all residual objects in 2-D, 2-D r-z, and 3-D geometries to ensure correct source code implementation of all kernel and BC objects. The test suite also includes simulation of classical fluid flows for which Pronghorn’s predictions are compared against known similarity solutions, other T/H codes, and experimental data. Examples of such verifications include the Blasius boundary layer, Hagen-Poiseuille flow, high-speed flow over a cylinder, flow over a backward-facing step, and cavity natural convection. As the emphasis of this paper is on demonstrating Pronghorn’s applicability to nuclear reactor flows, additional information on the MMS verification and physics demonstration tests can be found in our previous works and in the Pronghorn repository.Citation2
V. THE SANA EXPERIMENTS
Power densities in gas-cooled PBRs are often low enough that radiation and conduction across pebbles, in combination with an ex-vessel cooling system, are sufficient to remove decay heat in a depressurized LOFC by natural convection cooling. Safe reactor operation requires T/H tools that can accurately model natural circulation decay heat removal and the proximity of fuel temperatures to maximum allowable operating limits, especially if the maximization of power density is a primary design objective.
The SANA facility is a scaled experiment that models depressurized conduction cooldown of gas-cooled PBRs as a function of power density, coolant, and pebble properties.Citation42 depicts the facility in a full-length, single-heater configuration. A closed cylindrical vessel containing about 9500 non-fueled pebbles is heated by an electrical resistance heater located in the center of the bed. Insulation on the bottom and top of the bed limits axial heat losses. The pebble surface temperature is measured throughout the bed with thermocouples at five different elevations that varied from test to test and are indicated generically as “bottom,” “near bottom,” “middle,” “near top,” and “top” in .
Fig. 1. Illustration of the SANA facility with a single full-height heater with the five measurement planes indicated.Citation42
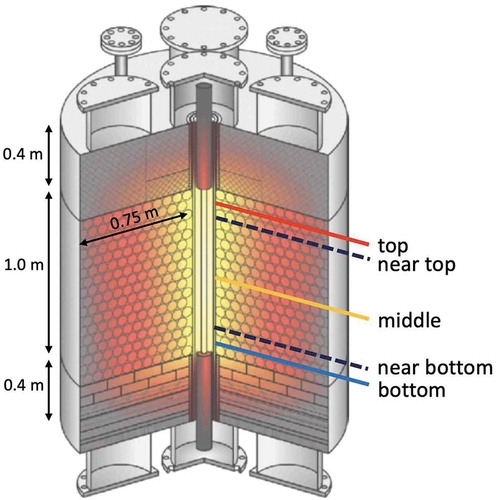
A total of 52 steady-state and axisymmetric experiments were conducted with three pebble designs, two coolants, four heater configurations, and seven heater powers, resulting in a total of nearly 1300 solid temperature measurements. The various combinations of pebble design and coolant result in different relative strengths of convective to diffusive transport and buoyant forces to friction losses. The three pebble designs—6.5-cm-diameter Al2O3, 6-cm-diameter electric graphite, and 3-cm-diameter matrix graphite—vary by over a factor of two in diameter and by a factor of ten in thermal conductivity. Smaller pebble diameters correspond to greater interphase friction and convective heat transfer, while higher thermal conductivities enhance heat transfer mechanisms independent of convection. The two coolants, helium and nitrogen, were selected due to helium’s common use as a PBR coolant and nitrogen’s surrogate properties for air ingress events. Because helium’s thermal conductivity is approximately five times larger than that of nitrogen, the nitrogen flows exhibit weaker diffusive transport than the helium flows.
The four heater configurations include the full-length heater shown in , a partial-length heater in either the bottom half or top half of the bed, and a partial-length heater in the bottom half of the bed with an open gas plenum. The full- and partial-length heater tests represent power operation with various levels of control rod insertion, while the open plenum test is a surrogate for the open cavity adjacent to most beds in gas-cooled PBRs. Finally, the different heater powers correspond to the decreasing decay heat levels at various times following an initial shutdown. The maximum power density of 28 kW m−3 corresponds to about 1% of the full power of a typical gas-cooled PBR, or decay heat levels several hours after shutdown.
The low power density and the absence of forced convection cooling in the SANA experiments result in slow natural circulation flows with momentum conservation dominated by drag effects; these characteristics match the assumptions made in the friction-dominated macroscale model in EquationEqs. (5)(5)
(5) through (Equation8
) and therefore constitute a valuable experimental data set for validation.
In our previous work, all 52 steady-state and axisymmetric SANA experiments were modeled with Pronghorn’s friction-dominated model to assess its capacity for predicting core temperatures in depressurized LOFC events.Citation43 After describing the computational model, this section presents select velocity and temperature predictions for two heater configurations and summarizes the key takeaways of this validation exercise in the form of error histograms covering all 52 experiments. When available, code-to-code comparisons are made to Flownex and GAMMA, two porous media applications that have previously been used to model gas-cooled PBRs (CitationRefs. 44 and Citation45).
Briefly, the facility is modeled in 2-D r-z geometry with the heat flux through the insulation layers and vessel approximated with a combined series conduction and parallel surface convection and radiation resistance BC. The heat flux along the heater surface is assumed uniform and split among the phases according to the phase effective thermal conductivities. Tangential slip is permitted on all walls. The macroscale closures ,
,
, and
are selected based on models commonly applied to gas-cooled PBRs. The only unique aspect of the closure selection is the representation of the porosity as an exponential function of the distance from both radial and axial walls; this approximates the effect of multiple interacting walls in regions such as corners that most porous media tools neglect. An unstructured quadrilateral mesh with refinement along the walls and heater surface is uniformly refined until convergence in the solid temperature at the experimental measurement points. Complete details of the computational model and mesh are available elsewhere.Citation43
Before presenting the solid temperature validation data, a qualitative discussion of the effect of coolant and pebble properties on flow and heat transport for two heater configurations provides a useful physical background. shows predictions of fluid temperature and velocity streamlines for the six experiments with a long central heater with 30 kW of power. correspond to helium coolant, and correspond to nitrogen coolant. Each column (for example, ) corresponds to a different pebble design. In each image in , the left axis is the r-z symmetry axis.
Fig. 2. Pronghorn predicted fluid temperature and velocity streamlines for a 30-kW heater power for (a) through (c) helium and (d) through (f) nitrogen coolant for three pebble types
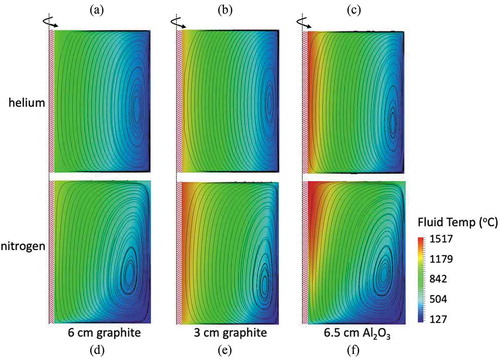
A natural convection flow is established as fluid buoyantly rises near the heater surface and cools near the vessel. The insulation on the bottom and top of the bed induces primarily radial temperature gradients. The low thermal conductivity of nitrogen results in more significant convective transport than in helium, which manifests as larger axial fluid temperature gradients and a recirculation vortex located closer to the bottom of the bed. The thermal conductivity of the pebbles is directly related to the maximum temperature in the bed under these conditions—from left to right, the pebble thermal conductivity deceases. Experiments with Al2O3 pebbles and nitrogen coolant have the greatest convective transport, while experiments with the graphite pebbles and helium coolant have the greatest diffusive transport.
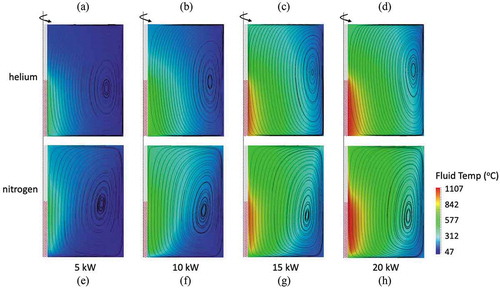
For a half-length heater in the bottom of the bed with 6-cm graphite pebbles, shows fluid temperature and velocity streamline predictions as a function of coolant and heater power. The higher the heater power, the further upward the recirculation vortex moves for the helium cases since energy transfer is primarily diffusive and in the radial direction. For the stronger convective transport nitrogen cases, higher heater powers result in strong fluid acceleration along the heater surface, pushing the recirculation vortex further downward as the fluid changes directions along the top and right walls of the vessel.
Fig. 3. Pronghorn predicted fluid temperature and velocity streamlines for a partial-length heater in the bottom of the bed for (a) through (d) helium and (e) through (h) nitrogen for 6-cm graphite pebbles for four power levels
Next, a small selection of the solid temperature predictions is shown. In presenting this validation data, all experimental results are shown as discrete points, and Pronghorn predictions are shown as solid lines. When available, Flownex and GAMMA results are shown as dashed and dotted lines, respectively. A summary of the error assessment provided in our earlier work is given concurrent with the presentation of aggregate results in and (CitationRef. 43).
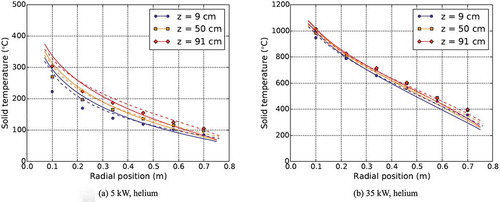
shows Pronghorn and Flownex predictions of solid temperatures for heater powers of 5 and 35 kW for helium coolant and 6-cm graphite pebbles. Different temperature scales are used to improve visibility. corresponds to . The strong diffusive transport in helium results in very small axial temperature gradients, as most heat is transported in the radial direction. Pronghorn predicts the solid temperature throughout the bulk of the bed well, with higher errors near the heater surface and bed outer radius where thermal gradients are largest. Pronghorn and Flownex agree quite well with one another throughout the bed, with both applications showing similar error magnitude and spatial distribution.
Fig. 4. Pronghorn predicted (solid lines) and Flownex predicted (dashed lines) solid temperature for a full-length heater with helium coolant and 6-cm graphite pebbles at (a) 5 kW and (b) 35 kW
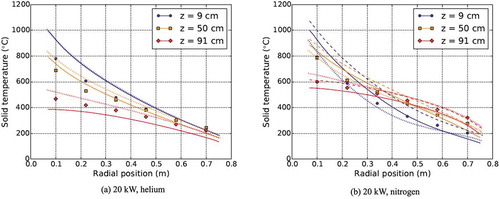
shows Pronghorn, Flownex, and GAMMA solid temperature predictions for a heater power of 20 kW in the bottom half of the bed with 6-cm graphite pebbles and helium or nitrogen coolant. correspond to , respectively. Near the heater surface, the absence of a heat source in the top of the bed results in an inverted temperature distribution relative to the long central heater cases in . The lower thermal conductivity of nitrogen results in poorer radial heat transport than in helium, resulting in an opposite temperature trend near the bed outer periphery compared to that in helium. That is, along the vessel surface, the solid temperature is highest in the helium cases in the lower region of the bed and highest in the nitrogen cases in the upper region of the bed. All codes agree qualitatively with one another with similar error magnitudes; similar to the full-length cases shown in , the error is highest near the heater surface.
Fig. 5. Pronghorn predicted (solid lines), Flownex predicted (dashed lines), and GAMMA predicted (dotted lines) solid temperature for a half-height heater in the bottom of the bed at 20 kW for 6-cm graphite pebbles and (a) helium or (b) nitrogen coolant
To summarize the validation results for all 52 experiments, shows a histogram of the error (predicted minus experimental) for all 52 tests modeled with Pronghorn, the 6 tests modeled with Flownex, and the 4 tests modeled with GAMMA. shows the mean, standard deviation , and maximum error of the data shown in . In each column, the number of points compared between the applications are the same. As compared to Flownex and GAMMA, Pronghorn predicts a mean error more centrally located about zero with a slightly smaller standard deviation. Pronghorn predicts a similar maximum error as GAMMA and a significantly lower magnitude maximum error than Flownex.
TABLE I Mean, Standard Deviation, and Maximum Solid Temperature Error for the Flownex Cases, the GAMMA Cases, and All 52 Cases*
Fig. 6. Histogram of solid temperature error for Pronghorn (52 cases), Flownex (6 cases), and GAMMA (4 cases)
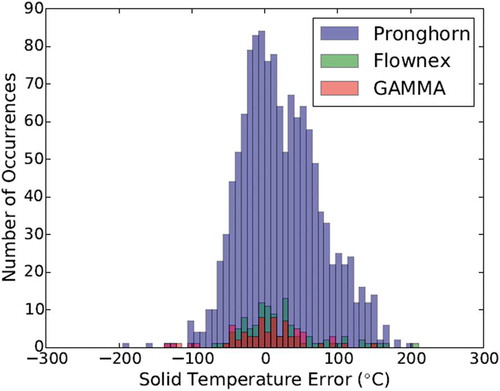
By individually modifying closures and BCs in the Pronghorn simulations relative to a baseline model, it is observed that the porosity, near-wall treatment, pebble emissivity, and vessel surface convection coefficient have the largest impact on the error mean and standard deviation for the depressurized cooldown conditions of the SANA experiments.Citation43 Because the magnitude of the code-to-code differences in is within a range similar to that observed by individually modifying closures and BCs within Pronghorn alone, it is likely that the differences between the three codes’ predictions can be attributed to different closure and BC selections. For instance, while Pronghorn uses a 2-D porosity distribution, Flownex and GAMMA both neglect any axial dependence.Citation44,Citation45 In addition, the
model used in Flownex and GAMMA does not account for wall effects, while the Tsotsas radiation correction is used in the Pronghorn model.Citation44,Citation45 And while all three codes assume the same pebble emissivity, differences exist in the calculation of the vessel surface convection coefficient. Based on the median assumed by other benchmark participants, a fixed vessel surface convection coefficient of 15 W m−2 K−1 was assumed in Pronghorn. Conversely, the Flownex simulations were conducted by varying this coefficient in the range of 20 to 25 W m−2 K−1 to best match the experimental data, an approach that does not accurately reflect typical modeling conditions where experimental measurements are not available a priori.Citation46
Pronghorn’s friction-dominated model is expected to be most accurate for steady-state and slowly evolving flows with momentum conservation dominated by friction effects. shows a histogram of the solid temperature error as a function of the coolant type. Gaussian fits to each data set are shown as dashed lines. Pronghorn predicts the helium cases with 16.6°C lower standard deviation and 31.9°C lower maximum error than the nitrogen cases. The greater convective transport in nitrogen is more difficult to capture with the friction-dominated model, but the availability of the Navier-Stokes model may increase Pronghorn’s applicability range to a wider variety of flows than “legacy” PBR simulation tools that are limited to a friction-dominated model.Citation14 Future work will repeat the SANA validation with the Navier-Stokes model to determine the sensitivity of solid temperature to the momentum conservation model.
Fig. 7. Histogram of solid temperature error (a) as a function of coolant type and (b) as a function of measurement location. Gaussian fits to each data set of points are shown as dashed lines and labeled with the mean
and standard deviation
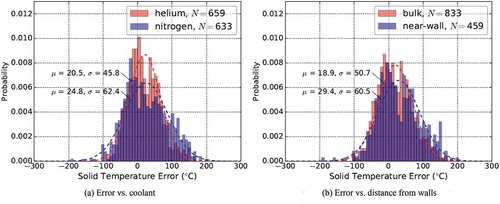
The accuracy of porous media models is dependent on the closures used for the phase distribution, interphase momentum and energy transfer, and effective heat transfer processes. Most models for ,
,
, and
are experimentally or numerically correlated from bed-averaged measurements. With a few exceptions, corrections in the near-wall regions, where pebble ordering results in very different thermal and flow characteristics than in the bulk, are either not available or are simple constant-factor corrections independent of flow regime.
shows the solid temperature error as a function of measurement location in the bed, with “near-wall” indicating all points within a half-pebble diameter of the wall and “bulk” representing all other points. Pronghorn predicts solid temperatures in the bulk with a 10.5°C lower mean error, 17.3°C lower maximum error, and 9.8°C lower standard deviation than in the near-wall region. The errors associated with the use of bulk-correlated closures for the wall region may partially account for the higher errors observed near the walls and heater surface in . Other possible explanations for the higher errors observed near the heater surface and vessel wall in are an underprediction of the effective solid thermal conductivity near the heater surface or an inaccurate pebble emissivity, which was not provided in the benchmark specifications.
Many opportunities exist for collaboration with experimental programs to better understand near-wall physics in PBRs and for the integration of high-resolution computational fluid dynamics (CFD) for on-the-fly generation or tabular lookup of wall corrections. Work in this area coupling the spectral element CFD code Nek5000 to the MOOSE framework lays groundwork for further efforts in this multiscale space.Citation47
VI. THE PEBBLE BED MODULAR REACTOR
The core regions of gas-cooled PBRs experience many different flow regimes across the set of nominal and postulated accident states characterizing the reactor. In full-power operation, heat is removed from the core by forced convection; in many designs, this flow transitions to natural convection cooling following shutdown. In the event of a primary loop pipe break, the ensuing coolant loss may result in high-speed primary loop depressurization. Following depressurization, air and/or water ingress may release energy in the form of chemical reactions with the fuel and structural materials and affect reactivity feedback.
The SANA experiments provide data to validate Pronghorn’s models for natural circulation cooling in gas-cooled PBRs. Another important milestone in the development of simulation tools for PBR analysis is verification against the Organisation for Economic Co-operation and Development/Nuclear Energy Agency PBMR-400 benchmark.Citation48 This code-to-code numerical benchmark assesses the capability of both standalone and coupled T/H and neutronics tools for modeling steady-state forced convection as well as a number of transients that include depressurized and pressurized LOFC, load following, and control rod ejection.
In the progression toward a comprehensive MOOSE-based reactor analysis framework, our previous work completed the steady-state, standalone neutronics and T/H exercises of the PBMR-400 benchmark with Griffin and Pronghorn.Citation49 This section shows select results for the standalone T/H PBMR-400 benchmark to demonstrate Pronghorn’s applicability to forced convection flow in gas-cooled PBRs. A second objective is to demonstrate capabilities for conjugate heat transfer between a porous bed and solid structures that, in combination with conduction and radiation across fluid gaps, enable prediction of ex-core temperatures that may affect bypass flows, neutronics feedback, and component lifetime. After describing the benchmark problem and the computational model, pressure, velocity, and temperature predictions are compared against solutions from other benchmark participants.
The specified geometry, material properties, and operating state are based on the PBMR-400 design by PBMR Ltd.Citation50 with a number of simplifications to increase conformity among the benchmark participants. shows a schematic of the benchmark geometry. The core consists of an annular pebble bed with about 452,000 6-cm pebbles enclosed by fixed, block-type graphite inner and side reflectors. Each pebble consists of a 0.5-cm outer graphite shell encompassing a central 5-cm-diameter fuel-matrix region containing about 15,000 UO2 TRistructural ISOtropic (TRISO) particles in a graphite matrix. Material properties and dimensions of all components are provided with the benchmark specifications.Citation48
Fig. 8. Schematic of the PBMR-400 T/H benchmark geometry through a central slice. White arrows represent the coolant flow path
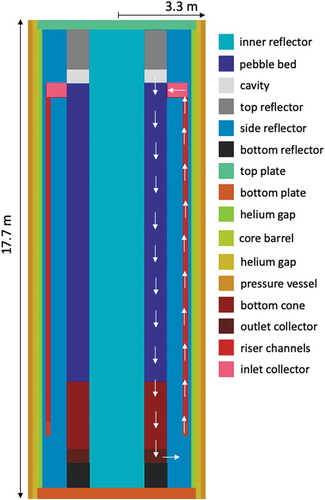
The white arrows in depict the helium flow path. Helium enters the riser channels at 192.7 kg s−1 and 500°C and then flows downward through the pebble bed, exiting through a porous bottom “cone” and outlet collector. The fueling cones have been flattened to give a Cartesian geometry, while all bypass flow paths through the reflectors have been omitted. Due to limitations in THERMIX at the time of constructing the benchmark, the helium enters the pebble region horizontally, rather than first flowing into the open cavity above the bed. With the solid heat source shown in , the nominal fluid temperature rise is approximately 400°C.
Fig. 9. Specified superficial solid heat source for the T/H standalone PBMR-400 benchmark
Eight independent laboratories, universities, and industry groups participated in the standalone T/H phase of the benchmark with three unique T/H codes: THERMIX (CitationRef. 14), GCR (CitationRef. 51), and TINTE (CitationRef. 52). Because both THERMIX and TINTE use friction-dominated models similar to EquationEqs. (5)(5)
(5) through (Equation8
), a 2-D r-z computational model was constructed based on Pronghorn’s friction-dominated equation set to increase the similarity with other participant solutions. All fluid walls were treated as slip surfaces, while the surfaces of the bottom and top plates were adiabatic. The vessel surface exchanges heat by conduction and radiation across a large stagnant air volume to a reactor cavity cooling system maintained at 20°C. The stagnant helium gaps between the side reflector and the barrel and between the barrel and the vessel are modeled with the interior mesh conduction and radiation heat transfer components in the MOOSE heat conduction module. A structured quadrilateral mesh with additional refinement along fluid-solid interfaces and the upper cavity was uniformly refined until convergence in the radially and axially averaged temperatures, pressures, and velocities.
shows the predicted fluid temperature and velocity streamlines in the riser channels, flow collectors, open cavity, and pebble bed. Except near the bed entrance where a small amount of flow expands in the open cavity, the fluid flow is unidirectional through the bed. The fluid temperature increases monotonically through the bed, with the maximum temperature occurring along the inner reflector surface where the power density is largest.
Fig. 10. Pronghorn predicted fluid temperature and velocity streamlines for the standalone T/H PBMR-400 benchmark
shows the predicted solid temperature, average fuel temperature, and average moderator temperature. In porous regions such as the pebble bed, the “solid temperature” shown in more specifically refers to the solid surface temperature that is used as a BC on representative solid mesoscale structures. The “fuel” and “moderator” temperatures refer to the pebble interior temperature
averaged over the fissile materials and moderator materials, respectively. Similar designations are used throughout the remainder of this paper.
Fig. 11. Pronghorn predicted (a) solid, (b) fuel, and (c) moderator temperature for the standalone T/H PBMR-400 benchmark
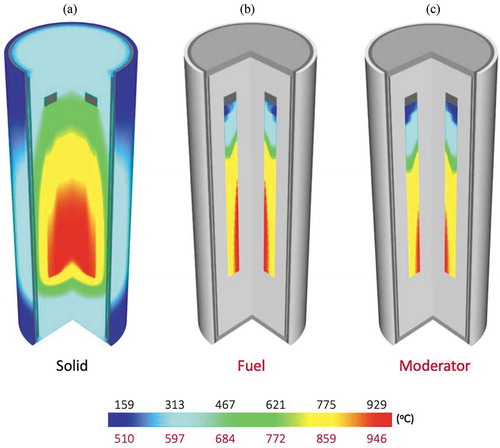
, the fuel and moderator temperatures, respectively, share the bottom color scale, while the solid temperature is shown on the top color scale to avoid saturation by the low temperatures in the pressure vessel. In the pebble region, all temperatures are highest near the bed outlet and along the inner reflector surface due to the combination of fluid convection and the specified power distribution. The non-smooth fuel and moderator temperature distribution results from the piecewise constant power density shown in . Heat transfer by multiphase conduction, contact conduction, and radiation from the pebbles to the side reflector, followed by conductive and radiative heat transfer across the helium gaps, results in a pressure vessel axial temperature distribution similar to that in the power-generating region.
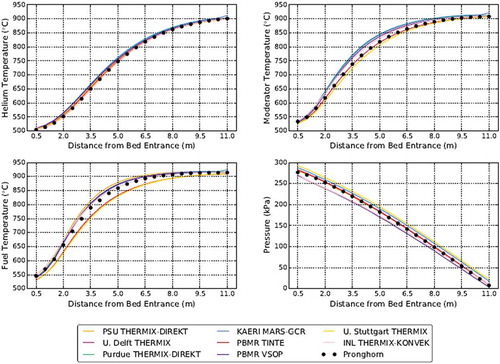
compares predictions of the radially averaged pressure and helium, moderator, and fuel temperatures within the pebble bed against the solutions of other benchmark participants. The excellent agreement between Pronghorn and the other solutions demonstrates that the friction-dominated model in EquationEqs. (5)(5)
(5) through (Equation8
) is comparable to the models that have historically been used for PBR analysis.Citation14,Citation52 A similar conclusion was made in the comparison of Pronghorn with Flownex and GAMMA predictions of the SANA facility in Sec. V. New capabilities in the form of flexible multi-application coupling and unstructured meshing are emphasized in the remaining sections of this paper.
Fig. 12. Radially averaged predictions of pressure and coolant, fuel, and moderator temperature as a function of axial position within the pebble bed for the standalone T/H PBMR-400 benchmark
VII. SYSTEMS-LEVEL COUPLING TO RELAP-7
A key requirement of a comprehensive reactor T/H toolset is having methods for predicting plant response to a number of BOP-initiated transients, such as LOFC and loss of heat sink. The standalone T/H exercise in the PBMR-400 benchmark decoupled the core from the primary loop by prescribing fixed BCs at the inlet and outlet of the bed, an approach that generally excludes the coupled physics feedback needed to correctly account for bed-system interactions in complex transients.
Pronghorn’s multidimensional models are best suited to intermediate-resolution T/H analysis of the pebble bed and the adjacent plena, reflectors, and structural materials. By leveraging MOOSE’s multi-application coupling system, Pronghorn’s core models can be integrated with the systems-level T/H models of RELAP-7 and SAM, two next-generation nuclear reactor system safety analysis codes built on the MOOSE framework.Citation5,Citation34 This section presents early results from the coupling of Pronghorn and RELAP-7 for full-loop, steady-state simulation of a simplified PBR to highlight the multidimensional coupling features shared by all MOOSE applications with two T/H domains of high relevance to engineering-scale analysis.
The reflector blocks in PBRs contain channels that accommodate some combination of control rods, absorber sphere control systems, and cooling flow. Irradiation- and temperature-induced deformation in these blocks also results in the formation of thin, millimeter-size gaps with geometry that varies with fluence. Bypass flow through these channels and gaps diverts coolant from the bed, raising fuel temperatures while simultaneously cooling reflectors and other ex-core components. Underpredictions of these bypass flows in the Arbeitsgemeinschaft Versuchs-ReaktorCitation53 (AVR) and Thorium High Temperature ReactorCitation54 (THTR) highlight deficiencies in earlier computational tools and/or facility characterization that modern tools must address to improve the fidelity of PBR models.
Pronghorn includes two methods for predicting bypass flows. The first involves a porous media model of the gap flow in the reflector with resolved 1-D flow channel representations of the larger channels. These 1-D channels exchange energy with the porous reflector by conjugate heat transfer, but the channel flows are assumed independent of the gap flows. The second approach, which is better suited to geometries with stronger coupling between the gap and channel flows, instead represents all flow paths in the reflector with a porous media model. An objective of this section is to demonstrate the first bypass modeling approach with a 3-D/1-D Pronghorn reflector coupling to RELAP-7 flow channels. An application using the second bypass modeling approach is shown later in Sec. VIII.
After introducing the T/H models in RELAP-7 and the computational model used in Pronghorn, the non-overlapping domain decomposition boundary coupling between Pronghorn and RELAP-7 is described. Temperature, pressure, and velocity predictions are then shown for a simplified primary loop model loosely based on the High Temperature Reactor Power Module (HTR-PM) design.
For a single-phase flow channel oriented in the -direction and with cross-sectional area
, RELAP-7 solves the conservation of mass, momentum, and energy equations:
and
where is the wall shear force per unit length,
is the wall heat transfer rate per unit length, and
,
,
, and
have been previously defined. Components representing pipes, pumps, heat exchangers, and many other elements are then combined to form a 1-D model of a flow network.
The RELAP-7 network for the present demonstration is shown in . Helium flows upward through riser channels in the outer reflector to a cold inlet plenum above the core. The coolant then flows downward through the pebble bed and the control rod borings in the outer reflector, mixing in a hot outlet plenum after exiting the bed and reflector. Next, the coolant passes through the hot leg to a steam generator and a compressor, returning by the cold leg to the inlet plenum to complete the primary loop. The compressor is approximated as an ideal pump with a fixed mass flow rate of 24 kg s−1, while the steam generator is simplified to a flow channel with the convective heat transfer coefficient given by RELAP-7’s helium closures.Citation5
Fig. 13. Schematic of the (a) RELAP-7 primary system loop geometry with heat transfer represented by and (b) Pronghorn pebble bed and reflector geometry. The power density in the pebble bed is colored on a rainbow scale
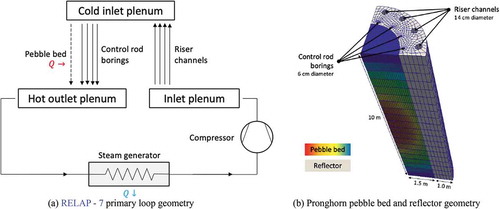
Pronghorn models the 3-D quarter-core shown in , which consists of a pebble bed adjacent to a solid reflector with unmeshed control rod borings and riser channels. An unstructured quadrilateral mesh is extruded in the axial direction to form a 3-D mesh. To contrast with the friction-dominated applications in Secs. V and VI, the pebble region is modeled with the Navier-Stokes equation set in EquationEqs. (1)(1)
(1) through (Equation4
) with
, such that the viscous stress term is neglected. For simplicity, gap bypass flows in the gaps between reflector blocks are neglected, such that the reflector is modeled by EquationEq. (9)
(9)
(9) . This assumption is not an inherent limitation of the method, but only a simplification to obviate the need for CFD-based reflector closure generation for the present demonstration.
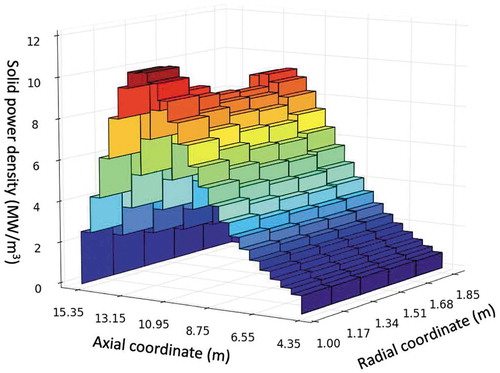
The total power of the quarter-core is fixed at 62.5 MW with a cosine radial distribution and a sinusoidal axial distribution shown in . All fluid-solid interfaces are treated as slip boundaries, while the reflector surface exchanges heat by convection and radiation to the ambient. A detailed description of the material properties and closures completing the model is available elsewhere.Citation55
The dashed line representing the flow path through the pebble bed in indicates that the RELAP-7 network is an open loop with an inlet at the pebble bed exit and an outlet at the pebble bed inlet. This boundary coupling is referred to here as a “non-overlapping” domain decomposition to differentiate from an “overlapping” domain decomposition. In the latter, the RELAP-7 model is a closed loop with an equivalent pebble bed flow path and and
closures integrated over a 3-D Pronghorn core model to match the pressure drop and enthalpy rise in the Pronghorn model. An application of the overlapping domain decomposition to the problem shown in is provided elsewhere.Citation55
At the pebble bed inlet, RELAP-7 provides a mass flow rate and temperature for use as uniform BCs in the Pronghorn model, while Pronghorn computes an area-averaged pressure that is used as an outflow BC in RELAP-7. At the pebble bed exit, Pronghorn computes an area-averaged mass flow rate and temperature for use as BCs in RELAP-7, while RELAP-7 provides a pressure that is used as a uniform outflow BC in Pronghorn. The distribution of mass flow between the pebble bed and the control rod borings is determined by matching the pressure drop over the pebble bed and control rod borings.
The 1-D riser channels and control rod borings are coupled by convective heat transfer to the 3-D solid reflector by a convection BC in each layer of the Pronghorn mesh:
where
| subscript | = |
|
| = | reflector thermal conductivity | |
| = | reflector temperature | |
| = | 2-D boundary between the 3-D reflector and the 1-D flow channel in mesh layer | |
| = | unit normal corresponding to | |
| = | convective heat transfer coefficient | |
| = | RELAP-7 flow channel temperature at the i’th mesh layer | |
| = | an average of the reflector temperature over |
The coupled model is solved with Picard iteration, with the nonlinear dependence between the pebble bed and the flow network converged on each time step. Sub-cycling time stepping is used to enable a larger time step in the Pronghorn model and to achieve more efficient use of computational resources due to the longer time constant associated with the large graphite quantities in the bed and reflector.
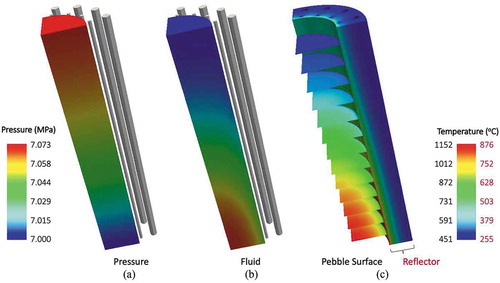
Due to the emphasis of the present discussion on Pronghorn’s modeling capabilities, the presentation of results is here restricted to the core region. shows the coupled predictions of pressure and fluid, pebble surface, and reflector temperatures. The control rod and riser channels are shown as gray cylinders in . The fluid and pebble surface temperatures are shown on the same color scale, but for clarity the reflector temperature is shown on the scale on the right side of the temperature legend. The change in pressure is nearly linear with height, giving a total pressure drop of 0.73 atm. Both the fluid and pebble surface temperatures are highest along the bed centerline and at the outlet due to the combination of fluid flow in the downward direction and the power distribution shown in . The highest reflector temperatures occur near the core outlet, where conjugate heat transfer with the highest-temperature pebbles occurs.
Fig. 14. Pronghorn and RELAP-7 coupled predictions of the (a) pressure and of the (b) fluid and (c) pebble surface and reflector temperatures
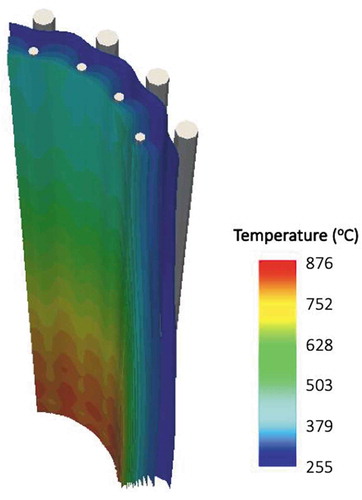
shows contours of the reflector temperature with the control rod and riser channels again shown as gray cylinders. The temperature contours bend around the 1-D flow channels due to a combination of convective heat transfer and impedance to solid conductive heat transfer.
Fig. 15. Pronghorn and RELAP-7 coupled predictions of reflector temperature contours
The bypass through the control rod channels is approximately 12.1% of the total flow, which is similar to predictions based on more refined analyses of the HTR-PM reference plant design.Citation56,Citation57 When averaged over the bed inlet and outlet faces, the fluid temperature rise of 546°C agrees well with the observed core mass flow rate and the small amounts of heat loss through the reflector.
From initial concept to completion, the flexible multi-application coupling system in MOOSE achieved this Pronghorn and RELAP-7 coupling with about one person-week of effort. Many interesting studies lie ahead that utilize increasing levels of multiphysics feedback for which these rapid extension features in MOOSE are especially effective.
VIII. THE PEBBLE BED FLUORIDE-SALT-COOLED HIGH-TEMPERATURE REACTOR
In the past 20 years, considerable interest has grown in the use of molten-salt coolants for PBRs. The high volumetric heat capacity of candidate salts at atmospheric pressures eliminates many of the costs and complexities associated with pressurized systems. Depending on the design, this high volumetric heat capacity may also be leveraged to achieve higher power densities than in gas-cooled systems. Boiling points in the vicinity of 1300°C to 1600°C also allow salt-cooled PBRs to retain the high outlet temperatures characteristic of gas-cooled PBRs with the attendant benefits of higher thermal efficiency and applications in the industrial heat sector.
The multiscale model described in Sec. II is applicable to all single-phase PBRs. Sections V and VI presented verification and validation (V&V) of the friction-dominated model to depressurized conduction cooldown and forced convection in gas-cooled PBRs. At the time of writing, a lack of experimental data and T/H benchmarks for salt-cooled PBRs precluded a similar core-level V&V for salt systems. Therefore, in order to demonstrate Pronghorn’s capacity as a general PBR simulation tool, this section applies the multiscale model to full-core analysis of the Mark-1 PB-FHR, a 236 MWth FLiBe-cooled design developed by UCB and a number of other universities through a U.S. Department of Energy (DOE) integrated research project.Citation58
This particular concept was selected because several aspects of the core design both highlight model and implementation strengths relative to legacy PBR simulation tools and constitute significantly different T/H conditions than seen in most gas-cooled PBRs. For example, a combination of radial and axial inflow BCs results in multidimensional core flow, rather than the “plug” flow observed in most helium-cooled PBRs, such as in Secs. VI and VII. The interaction of these non-uniform flow BCs with conical inflow and outflow boundaries necessitates unstructured meshing capabilities, whereas the lack of cones in the applications in Secs. V, VI, and VII does not strictly require unstructured meshes. An unconventional reflector block design with stronger coupling between horizontal and vertical flow channels motivates a second bypass modeling approach based on the porous media method to contrast with the 3-D/1-D Pronghorn–RELAP-7 coupling shown in Sec. VII. The pebble design is also distinct from the prototypic gas-cooled reactor fuel pebble. A very thin fuel-matrix annulus, as opposed to a large central heterogeneous region, prompts a fully resolved verification of the HSD meso- and microscale models to complement previous verifications for compacts more characteristic of gas-cooled pebbles.Citation30
After describing the reactor design and the computational model, Sec. VIII.A summarizes our previous work in verifying the HSD method for thin fuel-matrix annuli by comparing multiscale predictions against fully resolved fuel pebbles.Citation2 Section VIII.B then presents select pressure, velocity, and temperature predictions for steady-state operation based on a previous design study.Citation2
The PB-FHR core consists of fixed, block-type inner and outer graphite reflectors that constrain the pebbles into an annulus. FLiBe enters a downcomer at 976 kg s−1 and 600°C and then flows upward directly into the pebble bed, the outer reflector, and through a series of machined channels in the central reflector. Of the total flow, 70%, or 683.2 kg s−1, enters the bed horizontally from channels in the central reflector, while the remaining flow is split between the pebble bed and the outer reflector according to the relative flow resistance. The coolant leaves the pebble bed through a defueling chute at the top of the core and through a series of axisymmetric suction holes on the inner surface of the outer reflector that connect to an outlet plenum. For the thermal power of 236 MW, the nominal core temperature rise is 100°C.
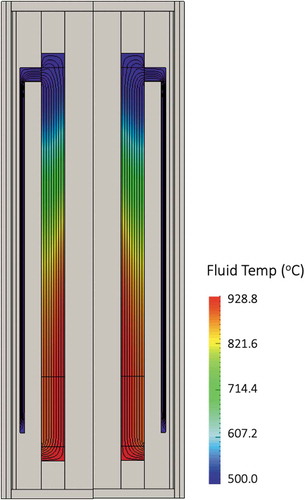
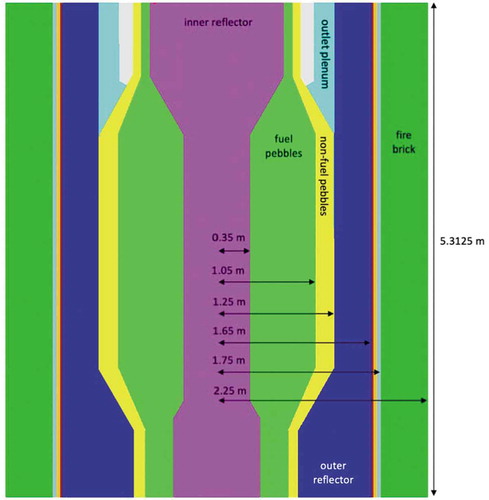
Because the combination of the downcomer and the axisymmetric outlet plenum suction holes results in nearly axisymmetric flow in the reactor, a 2-D r-z computational model was constructed. This geometry is shown in through a central slice. Surrounding the outer reflector is the core barrel, downcomer, pressure vessel, and a thick layer of insulating firebricks that exchange heat with a water-cooled reactor cavity liner plate maintained at 30°C.
Fig. 16. A slice through the center of r-z axisymmetric Pronghorn model of the PB-FHR
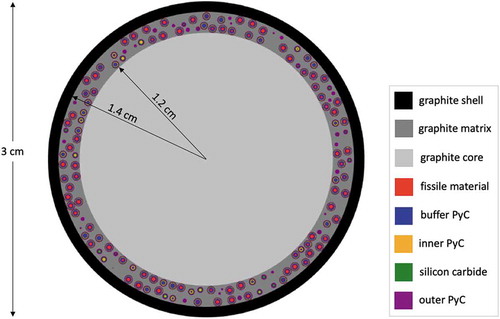
The core contains two different types of 3-cm-diameter pebbles: fuel pebbles and non-fueled graphite blanket pebbles. About 218,000 blanket pebbles are located in a thin peripheral region to protect the outer reflector from fast fluence, while the remaining core volume contains about 470,000 fuel pebbles. shows a schematic of a fuel pebble with randomized particle coordinates obtained using the OpenMC Monte Carlo code.Citation59 To allow higher power densities without exceeding fuel temperature limits, the fuel-matrix region occupies a thin annular shell near the surface with a 30.9% packing fraction (PF) of TRISO particles.
Fig. 17. Schematic of a PB-FHR fuel pebble along a slice through the center of the pebble
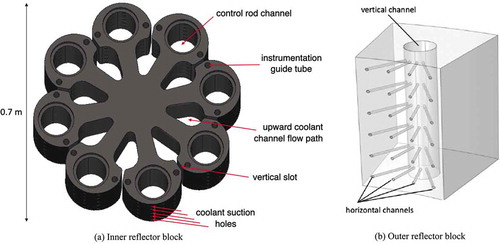
shows a computer-aided design model of one of the inner reflector blocks; these blocks are vertically stacked to form the inner reflector. Coolant flows upward through the eight teardrop-shaped channels and the eight control rod channels, entering the bed through horizontal slots and suction holes. shows a simplified wireframe rendering of one of the outer reflector blocks; a ring of 24 blocks forms one stacked layer of the outer reflector. Each outer reflector block contains a 12-cm-diameter vertical coolant channel that is connected to the bed by 24 horizontal 1-cm-diameter suction holes. To approximate irradiation- and temperature-induced deformation in an end-of-life condition, the outer reflector blocks are assumed separated from one another by 5-mm gaps in the horizontal and vertical directions.
Fig. 18. Schematics of the (a) inner and (b) outer reflector blocks of the PB-FHR at the axial midplane of the core
The pebble bed, outer reflector, and outlet plenum are modeled as porous media, while the barrel, vessel, and firebricks are modeled as conducting slabs. Both the downcomer and the inner reflector are also modeled as conducting slabs for two reasons. First, the inlet plenum geometry remains to be developed, so the geometry connecting the downcomer to the bed and reflectors is unknown. Second, the axial distribution of flow from the inner reflector into the bed is an open design question. Modeling the inner reflector as a porous medium would require imposition of friction closures to obtain the desired axial flow distribution, resulting in a complex nonlinear problem for every potential inflow BC.
In the outer reflector, the interaction between the 24 horizontal channels, the vertical channel, and the 5-mm gaps precludes a clean separation of the vertical and horizontal flows. This complex structure serves as a pertinent demonstration of Pronghorn’s second method for estimating bypass flows with porous media modeling of the outer reflector. In separate work, off-line CFD simulations were performed with COMSOL Multiphysics to generate friction factor correlations needed to close a porous media PB-FHR reflector model for which no existing literature correlations were available.Citation2
In the porous regions, the friction-dominated macroscale model was used because of the relatively low Reynolds numbers expected, while solid regions were modeled with EquationEq. (9)(9)
(9) . All fluid walls were modeled as slip surfaces, and an outlet pressure of 2 atm was imposed on all fluid outlets. The distribution of flow between the pebble bed and the outer reflector was determined by equating the pressure drop in the pebble bed and outer reflector. The top and bottom boundaries were adiabatic, while the firebrick surface was held at the reactor cavity liner plate temperature of 30°C. An unstructured tetrahedral mesh with refinement along fluid-solid interfaces and in regions of high porosity gradients was uniformly refined until convergence in the temperatures, pressures, and velocities. Details on the mesh and the material properties, closures, and geometry completing the model are available elsewhere.Citation2
VIII.A. Verification of the Heat Source Decomposition
Before presenting full-core T/H predictions in Sec. VIII.B, this section provides a brief synopsis of our previous work verifying the HSD for the PB-FHR fuel design.Citation2 The objectives of this section are to demonstrate the predictive capabilities of the HSD over a wide range in thermal conditions and to provide further discussion on the mesoscale and microscale models that have been utilized without much comment in Secs. VI and VII.
As described in Sec. III, the uniform surface temperature of a representative pebble in each element is obtained as the cell-averaged value of the macroscale solid surface temperature. Therefore, the present verification assumes a uniform pebble surface temperature BC of 1000°C to decouple the pebble solution from the macroscale model. Reference solutions were obtained by solving the heat equation in EquationEq. (9)(9)
(9) on “fully resolved” meshes that explicitly account for all CFPs and their layers. The reference meshes were constructed with coordinates obtained using the random packing algorithms in the OpenMC Monte Carlo code with all CFP layers resolved.Citation59 A mesh refinement study for the fully resolved pebbles was conducted by gradually reducing the minimum element size until convergence in the pebble-averaged material temperatures. The pebble power was fixed at 236 MWth divided by the 470,000 fuel pebbles. A total of 11 reference pebbles was constructed at PFs ranging from 5.0% to 30.9% to explore the accuracy of the HSD model for variations in fuel design.
shows the reference fuel kernel temperature solution for a 15% particle PF. Temperatures in the matrix and all CFP layers exterior to the central fissile kernel are not shown, while the core and shell regions are shown as gray blocks for scale. An inset shows the tetrahedral mesh in the CFPs, where the color represents the material identification number. Because the heat source is uniform and localized to the kernel, kernel temperatures are highest in the particle center. To provide a second perspective at a different PF, shows the reference temperature solution for a 20% particle PF on the TRISO particle surfaces and in the core and shell. Different color scales are used in to make the results clearer. The absence of a heat source in the central graphite core results in a nearly uniform temperature distribution in this region, and the majority of the radial temperature drop occurs over the fuel-matrix region. Nine other simulations at different PFs were performed, but for brevity they are not shown here.
Fig. 19. Reference temperature solutions for (a) the kernels for a 15% particle PF and (b) the TRISO surfaces, pebble core, and pebble shell for a 20% particle PF
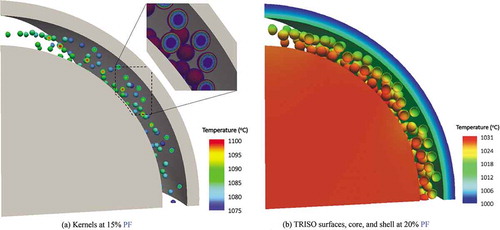
compares the reference (dots) and HSD method (solid lines) integral temperature solutions as a function of PF. The nominal PB-FHR design is highlighted with a gray vertical line. As the PF increases, the temperature in each layer of the particle decreases because the power per particle decreases. Outside the particle, higher PFs decrease the effective thermal conductivity of the heterogeneous region because the relatively high thermal conductivity matrix is replaced by lower conductivity CFPs, causing the pebble core and matrix temperatures to increase slightly with PF.
Fig. 20. Reference (dots) and HSD (solid lines) integral temperature solutions as a function of PF
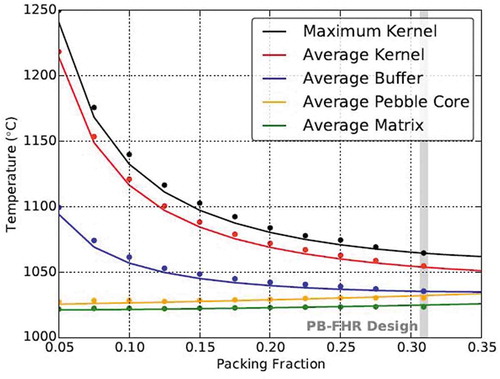
The HSD is in remarkably good agreement with the reference solution over all ranges in PF. The maximum error over all PFs for regions within the particle is only 9.0°C and occurs for the maximum kernel temperature at the lowest PF, where clustering effects are most significant. The maximum error for regions outside the particle is only 2.3°C. While only a single random realization is considered for each PF, the combination of the present verification with previous studies for domains more closely resembling gas-cooled pebblesCitation30 shows that the HSD can accurately predict pebble temperatures over wide ranges in thermal conditions.
VIII.B. Steady-State Core Analysis
This section presents select full-core, steady-state predictions of pressure, velocity, and temperatures in the PB-FHR based on a previous parametric design study for the inflow BC (CitationRef. 2). The solid heat source is specified with the sinusoidal axial distribution shown in . A “bottom-heavy” inner reflector inflow BC, represented qualitatively with black arrows in , is selected from several other axial distributions based on achieving an acceptable core bypass fraction, maximum fluid temperature, and pressure drop.
Fig. 21. Specified volumetric heat source for the PB-FHR. The black arrows represent the mass flux magnitude from the inner reflector
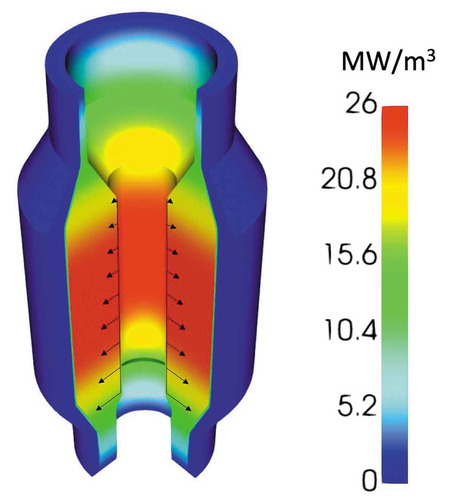
Uniform 5-mm gaps are assumed in the horizontal and vertical directions between the outer reflector blocks. Anisotropic friction factor correlations are generated with the Spalart-Allmaras turbulence model in COMSOL Multiphysics as a function of Reynolds number to capture the relative flow resistance between the pebble bed and outer reflectors. Complete details on the correlation methodology and assumptions are available elsewhere.Citation2
shows the predicted fluid temperature and velocity streamlines in the pebble bed, outlet plenum, and outer reflector. The gray blocks represent the inner reflector, the barrel, downcomer, and vessel. The bed is characterized by a combination of radial and axial flow due to the interaction of the radial inflow BC from the inner reflector and axial inflow BC into the bed and outer reflector. The horizontal component of velocity generally decreases moving toward the outer reflector because the drag is larger in the reflector than in the pebble bed. Flow in the outer reflector is primarily vertical, though flow enters the bed along the bottom slanted face adjacent to the outer reflector and shortly below the inlet to the outlet plenum to pass through the lower-resistance plenum instead of the higher-resistance reflector blocks.
Fig. 22. Pronghorn predicted fluid temperature and velocity streamlines in the pebble bed, plenum, and outer reflector of the PB-FHR
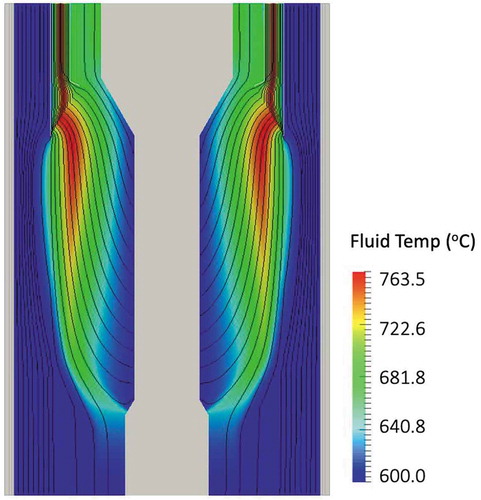
The fluid temperature is highest near the core outlet due to the continual heating in the bed. The blanket pebbles result in a thin stream of cool fluid along the interface between the bed and the outer reflector. By defining the bypass fraction as the fraction of the mass flow that exits the core through the outer reflector (as opposed to the outlet plenum and defueling chute), a 13.3% bypass is estimated for the end-of-life assumed deformation of 5-mm gaps. The mass flux weighted fluid temperature on the plenum inlet is 711.8°C, which agrees well with the observed core flow rate and the small amount of heat lost through the reflector and structural materials.
shows the predicted pebble surface temperature, solid temperature in non-pebble-bed regions, and pressure. The firebrick is excluded from the visualization in because the 600°C temperature drop from the vessel surface to the cavity liner plate cooling system would saturate the color scale for visualization. The interface between the fuel and blanket pebbles is clearly visible in the solid surface temperature distribution. The combination of radial and axial coolant flow in the bed results in the highest solid temperatures occurring near the outlet of the bed and along the fuel-blanket interface. Heat conducts from the pebbles to the reflectors, causing higher temperatures in the inner reflector and in the vicinity of the outlet plenum. The pressure drop is nearly linear with height for a total pressure drop of about 1.22 atm.
Fig. 23. Pronghorn predicted (a) pebble surface temperature, (b) solid temperature in non-pebble-bed regions, and (c) pressure for the PB-FHR
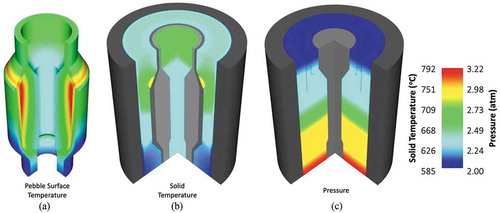
shows the predicted maximum kernel temperature, average kernel temperature, and average graphite temperature. The distribution of kernel and graphite temperatures in the fuel pebble region are similar to the power density in , but with maximum values shifted toward the outer periphery and slightly upward in the core due to the combination of axial and radial flow inlets. The close proximity of CFPs to the pebble surface results in roughly a 10°C difference between the maximum and average kernel temperatures.
Fig. 24. Pronghorn predicted (a) maximum kernel temperature, (b) average kernel temperature, and (c) average graphite temperature for the PB-FHR
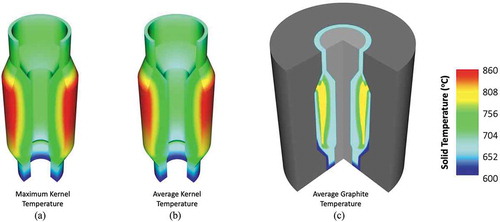
The 3-D unstructured mesh features of MOOSE, the simplicity of extending an object-oriented code to include salt-specific properties and closures, and the generality of the multiscale models described in Sec. II make Pronghorn a general T/H solver applicable to all single-phase PBRs. Future efforts in the area of closure development for pin-type reactors and additional coolants will allow Pronghorn to fill the intermediate-resolution T/H physics needs of an even more diverse set of reactors.
IX. MULTIPHYSICS COUPLING TO GRIFFIN AND RELAP-7
A comprehensive reactor analysis toolset requires methods for evaluating coupled phenomena involving neutron transport, core- and systems-level T/H, material performance, and many other physics domains. Especially for high-temperature gas reactors where large neutron migration areas and the presence of significant temperature gradients strongly influence the neutron distribution in both space and energy throughout the core, design calculations and confirmatory analyses must consider the coupled nature of T/H and neutron transport physics. Pronghorn is intended to provide intermediate-resolution T/H feedback to a MOOSE-based reactor analysis framework, but the preceding sections of this paper only considered the T/H physics in standalone Pronghorn and systems-level coupling of Pronghorn with RELAP-7. This work would therefore be incomplete without a discussion of neutronics coupling with Pronghorn’s models that is needed to properly consider the interdependent nature of the power distribution and material temperatures and densities.
This section presents a 2-D axisymmetric coupling of Pronghorn, RELAP-7, and Griffin for a prototypical helium-cooled PBR with geometry and material specifications based on publicly available design information of the HTR-PM with some missing specifications taken from the PBMR-400 benchmark. The purpose of this section is to demonstrate MOOSE’s capabilities for multiphysics design calculations and confirmatory analyses of gas-cooled PBRs. An additional objective is to describe the use of MOOSE’s multi-application system for the coupling of different physics tools in terms of execution and data transfer operations for more complex problems involving three applications.
shows the Pronghorn, Griffin, and RELAP-7 models of the prototypical 250 MWth plant design. Black arrows denote the coolant flow path. Helium enters the upper cavity at 7.2 MPa along the outer radius of the cold plenum, flows downward through the top reflector, cavity, pebble bed, and bottom reflector, and then exits along the outer radius of the hot plenum. With the nominal mass flow rate of 96 kg s−1, the core temperature rise is 500°C.
Fig. 25. Pronghorn, Griffin, and RELAP-7 models for the prototypical gas-cooled PBR design. The black arrows denote the coolant flow path
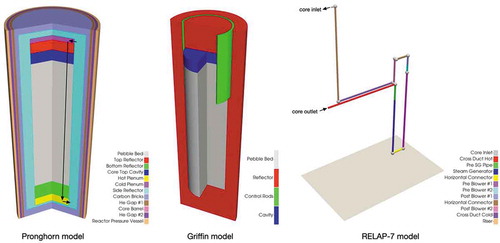
For simplicity, riser channels typically located in the side reflector, as well as any bypass flows, are neglected. The 6-cm-diameter pebbles are based on the typical gas-cooled design and contain a central 5-cm-diameter core consisting of TRISO particles at a 7.4% PF in a graphite matrix. The neutronics model only considers regions deemed neutronically significant: the pebble bed, reflectors, a control rod curtain, and the upper cavity. The systems T/H model is a simple representation of a primary loop and consists of pipes connecting the core outlet to a steam generator, followed by a blower and a return path to the core inlet. A cylindrical heat structure at constant temperature surrounds the steam generator to approximate heat transfer to a secondary loop; this fixed temperature is calculated to obtain the nominal inlet core temperature of 250°C. The blower is represented as a pump with a fixed head to obtain a pressure differential of 200 kPa. Complete details of the geometry and material properties are available elsewhere.Citation60
Pronghorn solves the friction-dominated model in the cold and hot plenums, upper cavity, pebble bed, and the top and bottom reflectors with conjugate heat transfer to solid materials. The BCs and conduction-radiation treatment for the helium gaps and vessel surface are the same as those discussed in Sec. VI. The pebble temperatures are computed in each element of the macro-length-scale mesh based on a uniform surface temperature BC obtained from the macroscale solution. RELAP-7 solves the single-phase conservation of mass, momentum, and energy equations in EquationEqs. (15)(15)
(15) , Equation(16)
(16)
(16) , and Equation(17)
(17)
(17) in the 1-D flow network.
Griffin solves the two-group neutron diffusion equations in -eigenvalue mode; for brevity, these governing equations are provided elsewhere.Citation6 For all materials except the open cavity, cross sections are calculated using DRAGON5 (CitationRef. 61) based on High Temperature Reactor–10 MWth (HTR-10) compositionsCitation62 and with the two-group energy structure described in CitationRef. 63. For the cavity, cross sections are taken from exercise 1 of the PBMR-400 benchmark by approximating the region as void with directional-dependent diffusion coefficients.Citation48 The fuel cross section library is tabulated as a function of average TRISO kernel temperature and average pebble core graphite temperature, while the reflector and control rod cross sections are tabulated as a function of temperature. To achieve a critical configuration, the control rod curtain is inserted to a depth of 4.8 m from the top of the reactor model—in other words, almost fully withdrawn. Vacuum BCs are applied on the vessel surface.
illustrates the multi-application hierarchy, execution control, and data transfers for the coupled simulation. Pronghorn’s macro-length-scale model is the master application and manages the execution of the Griffin and RELAP-7 sub-applications. As described in Sec. III, Pronghorn’s pebble temperature solution is also nested as a sub-application relative to the macroscale model. The red and blue arrows indicate data transfers to and from the master application, respectively. The non-overlapping domain decomposition introduced in Sec. VII couples the Pronghorn and RELAP-7 models through BCs at the core inlet and outlet, while Pronghorn and Griffin exchange the power density and the moderator, fuel, and reflector temperatures through a mesh interpolation. Therefore, each of the three physics tools solves on a different mesh tailored to the specific requirements of the underlying physics. Both Pronghorn and Griffin use a regular Cartesian mesh, while the RELAP-7 model is solved on a 1-D domain.
Fig. 26. Multi-application hierarchy for the coupled Pronghorn, Griffin, and RELAP-7 simulation. The arrows indicate data transfers
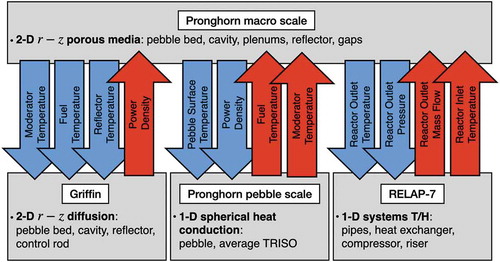
A steady-state calculation is run as a pseudo transient; at each time step, all three tools are iterated to mutual convergence. An adaptive time-stepping scheme is used with an automatic steady-state detection algorithm to terminate the solve once the relative changes in the residuals are below a specified tolerance. The remainder of this section presents select results for the coupled neutronics-T/H solution in the core and structural material regions.
shows Griffin’s predictions of the fast flux, thermal flux, and power density. The power density is averaged over each macroscale mesh element before transferring to Pronghorn. A negative temperature coefficient causes the fast flux, thermal flux, and power density to peak nearer to the core inlet where the coolant temperature is lower.
Fig. 27. Griffin predicted (a) fast flux, (b) thermal flux, and (c) power density. The flux contours are colored by flux. The power density is shown averaged over each macroscale mesh element
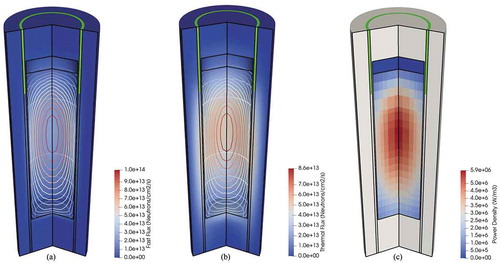
shows Pronghorn’s predictions of the fluid velocity streamlines, the fluid temperature, and the solid temperature. As described in Sec. VI, the “solid temperature” in porous regions more specifically refers to the surface temperature used as a BC in the lower-length-scale models. As heat is transferred from the pebbles to the coolant, the fluid density decreases; by conservation of mass, this causes the velocity to increase through the bed. The system mass flow rate is computed to be 97.5 kg s−1, which matches the design specification of 96 kg s−1 very well given the conversion of the pump pressure differential to a head based on a constant fluid density. The high velocity in the bottom reflector is an artifact of plotting the intrinsic velocity in a low-porosity region.
Fig. 28. Pronghorn predicted (a) intrinsic fluid velocity streamlines, (b) fluid temperature, and (c) solid temperature. The temperature contours are colored by temperature
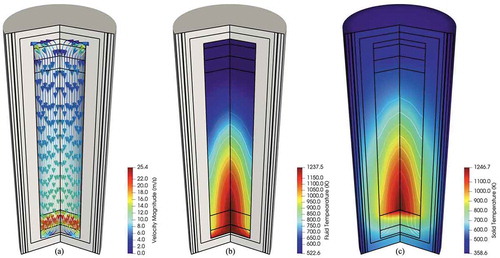
Both the fluid and pebble surface temperature are highest along the core centerline, where the power density is largest. The fluid and solid surface temperatures increase throughout the pebble bed as heat is continually added to the pebbles with minimal heat losses through the reflectors and other structural materials. The average core outlet temperature is predicted to be 749.7°C, which agrees well with the nominal outlet temperature of 750°C.
For illustration, shows the predicted pebble temperature solution for a randomly selected macroscale mesh element. The temperature of the average TRISO particle corresponding to this pebble is superimposed. Temperatures are highest in the centers of the pebble and TRISO particles due to the 1-D spherically symmetric conduction solution with a central heat-generating core in the pebble and a centrally located fissile kernel in the fuel particle.
Fig. 29. Pronghorn predicted pebble temperature solution for a randomly selected macroscale mesh element. The temperature of the average TRISO particle corresponding to this pebble is superimposed (not to scale). The contours are colored by temperature
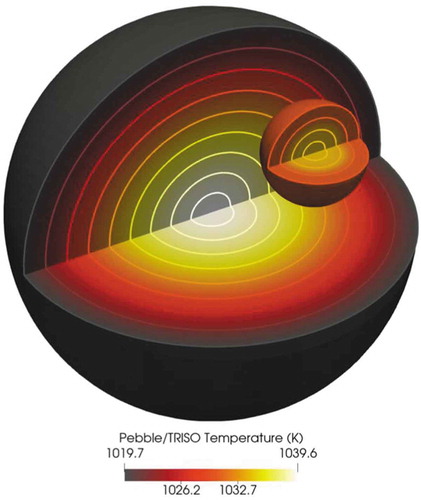
depict the expected coupled T/H and neutronics solution characteristics for gas-cooled PBRs while demonstrating the steady-state multiphysics simulation capabilities enabled by the flexible multi-application system common to all MOOSE tools. Ongoing efforts in the V&V of the Pronghorn-Griffin-RELAP-7 toolset for multiphysics applications will further improve the understanding of coupled reactor physics models and the role that modern computing frameworks will play in enabling such designs to contribute to a clean energy economy.
X. CONCLUSION
The complex core geometry of PBRs necessitates multiscale techniques for prediction of temperature and flow distributions in fast-turnaround design and safety analysis. This paper introduced a new multiscale T/H solver, Pronghorn, that leverages state-of-the-art capabilities in nonlinear solvers and multiphysics feedback to improve the fidelity of intermediate-resolution reactor modeling without requiring high-performance computing platform access. By coupling models on macro, meso, and micro length scales, full-core predictions of thermal and flow phenomena over six orders in magnitude can be achieved in only a few minutes on a personal workstation. The more rapid design iterations and scoping studies enabled by this tool will assist reactor designers in attaining a better understanding of core T/H that we hope translates to an increased viability of PBRs and other concepts in meeting worldwide climate goals.
In the pursuit of a comprehensive MOOSE-based reactor simulation framework, five example applications were presented. These applications highlight the V&V underlying the software development while emphasizing model features that improve upon the capabilities offered by legacy tools. The diverse set of applications demonstrates Pronghorn’s relevance to a wide variety of PBR concepts. Validation of a friction-dominated macroscale model for conduction cooldown under depressurized LOFC conditions in the SANA experiments shows that solid temperatures are predicted with accuracy comparable to that of other PBR simulation tools. The higher error and standard deviation in the near-wall regions suggest that collaboration with experimental programs and high-resolution CFD for the generation of near-wall closures may greatly improve the accuracy of porous media PBR models in these regions.
A code-to-code numerical benchmark for forced convection flow in a simplified representation of the PBMR-400 shows excellent agreement in pressure and temperature predictions between Pronghorn’s friction-dominated model and legacy PBR simulation tools. Conjugate heat transfer and “meshless” internal side-set heat transfer methods enable simulation of ex-core temperatures and the corresponding effects on bypass flows, neutronics feedback, and component lifetime.
By leveraging MOOSE’s multi-application coupling system, an example 3-D/1-D coupling of Pronghorn with RELAP-7 for primary loop modeling of a simplified rendition of the HTR-PM was shown. The non-overlapping domain decomposition boundary coupling and sub-cycling time stepping allow for the efficient use of computational resources while retaining the multidimensional effect of reflector channel cooling on core temperatures. Prediction of core bypass through large reflector channels provides an essential deliverable of PBR simulation tools for assessing maximum core temperatures.
The unstructured mesh and molten salt capabilities in Pronghorn were demonstrated with full-core analysis of the Mark-1 PB-FHR. The HSD fuel model was verified with comparisons against fully resolved reference pebbles, demonstrating the capacity of the multiscale model for predicting heterogeneous pebble temperatures over a wide range in thermal conditions. By modeling the outer reflector as a porous media with off-line CFD-generated friction closures, the effect of the coupled channel-gap flow on raising the core temperature and diverting coolant through the outer reflector was illustrated.
Finally, a three-way coupling of Pronghorn’s coarse-mesh T/H with Griffin diffusion neutronics and a RELAP-7 primary loop network demonstrates the capabilities of the MOOSE simulation tools for reactor design calculations and confirmatory analyses. A significant ongoing work area is the V&V of such multiphysics simulations for PBRs, our initial target application. Additional future work areas include the extension of Pronghorn’s closure set to include pin- and plate-type reactors to expand its applicability to a wider range of advanced reactors. And in the area of numerical methods development, extension of the new Euler finite volume capabilities in Pronghorn to include all kernels in the Navier-Stokes and friction-dominated models is expected to improve conservation properties, stability, and iterative convergence.
The T/H models implemented in Pronghorn are just one component in a MOOSE-based analysis framework considering neutron transport, materials performance, structural mechanics, and many other physics domains. By developing high-quality predictive models capable of rapid T/H design and analysis, this work plugs into the larger community developing computational tools to enable the contribution of new reactor designs to a clean energy economy.
Acknowledgments
This work is supported by the DOE, under DOE Idaho Operations Office contract DE-AC07-05ID14517. Accordingly, the U.S. government retains a nonexclusive, royalty-free license to publish or reproduce the published form of this contribution or allow others to do so for U.S. government purposes. Special thanks to Dr. C. G. Du Toit of the School of Mechanical and Nuclear Engineering at North-West University, South Africa, and to Dr. H. S. Lim of the Korea Atomic Energy Research Institute for providing Flownex and GAMMA simulation results of a subset of the SANA experiments for a code-to-code comparison.
References
- S. KAMALPOUR et al., “The Potential Impact of Fully Ceramic Microencapsulated (FCM) Fuel on Thermal Hydraulic Performance of SMART Reactor,” Nucl. Eng. Des., 339, 39 (2018); https://doi.org/10.1016/j.nucengdes.2018.08.029.
- A. NOVAK, “Multiscale Thermal-Hydraulic Methods for Pebble Bed Reactors,” PhD Thesis, University of California, Berkeley (2020).
- N. BROWN et al., “Neutronic Evaluation of a PWR with Fully Ceramic Microencapsulated Fuel. Part II: Nodal Core Calculations and Preliminary Study of Thermal Hydraulic Feedback,” Ann. Nucl. Energy, 62, 548 (2013); https://doi.org/10.1016/j.anucene.2013.05.027.
- C. PERMANN et al., “MOOSE: Enabling Massively Parallel Multiphysics Simulation,” SoftwareX, 11, 100430 (2020); https://doi.org/10.1016/j.softx.2020.100430.
- R. A. BERRY et al., “RELAP-7 Theory Manual,” INL/EXT-14-31366, Idaho National Laboratory (2014).
- Y. WANG, S. SCHUNERT, and V. LABOURÉ, “RATTLESNAKE Theory Manual,” INL/EXT-17-42103, Idaho National Laboratory (2019).
- C. LEE, Y. JUNG, and W. YANG, “MC2-3 Multigroup Cross Section Generation Code for Fast Reactor Analysis,” ANL/NE-11/41 Rev. 3, Argonne National Laboratory (2018).
- E. SHEMON, M. SMITH, and C. LEE, “Proteus-SN User Manual,” ANL/NE-14/6 Rev. 2, Argonne National Laboratory (2015).
- E. WEINAN, Principles of Multiscale Modeling, Cambridge University Press (2014).
- A. NOVAK et al., “Pronghorn Theory Manual,” INL/EXT-18-44453-Rev001, Idaho National Laboratory (2020).
- R. MARDUS-HALL et al., “Coupled CFD-DEM Analysis of Molten Salt-Cooled Pebble-Bed Reactor Experiment,” Trans. Am. Nucl. Soc., 116, 1506 (2017).
- M. GIESE, K. ROTTSCHÄFER, and D. VORTMEYER, “Measured and Modeled Superficial Flow Profiles in Packed Beds with Liquid Flow,” Am. Inst. Chem. Eng. J., 44, 2, 484 (1998); https://doi.org/10.1002/aic.690440225.
- K. VAFAI and C. TIEN, “Boundary and Inertia Effects on Flow and Heat Transfer in Porous Media,” Int. J. Heat Mass Transfer, 37, 195 (1980); https://doi.org/10.1016/0017-9310(81)90027-2.
- “Heat Transport and Afterheat Removal for Gas Cooled Reactors Under Accident Conditions,” IAEA-TECDOC-1163, International Atomic Energy Agency (2000).
- K. HOSSAIN et al., “Development of a Fast 3D Thermal-Hydraulic Tool for Design and Safety Studies for HTRs,” Nucl. Eng. Des., 238, 2976 (2008); https://doi.org/10.1016/j.nucengdes.2007.12.020.
- A. NOURI-BORUJERDI and S. GHOMSHEH, “An Improved Porous Media Approach to Thermal-Hydraulic Analysis of High-Temperature Gas-Cooled Reactors,” Ann. Nucl. Energy, 76, 485 (2015); https://doi.org/10.1016/j.anucene.2014.10.006.
- E. ACHENBACH, “Heat and Flow Characteristics of Packed Beds,” Exp. Therm. Fluid Sci., 10, 1, 17 (1995); https://doi.org/10.1016/0894-1777(94)00077-L.
- B. EISFELD and K. SCHNITZLEIN, “The Influence of Confining Walls on the Pressure Drop in Packed Beds,” Chem. Eng. Sci., 56, 4321 (2001); https://doi.org/10.1016/S0009-2509(00)00533-9.
- S. ERGUN, “Fluid Flow Through Packed Columns,” Chem. Eng. Prog., 48, 89 (1952).
- “Reactor Core Design of High-Temperature Gas-Cooled Reactors Part 3: Loss of Pressure Through Friction in Pebble Bed Cores,” KTA 3102.3, Nuclear Safety Standards Commission (1981).
- “Reactor Core Design of High-Temperature Gas-Cooled Reactors Part 2: Heat Transfer in Spherical Fuel Elements,” KTA 3102.2, Nuclear Safety Standards Commission (1983).
- S. YAGI and D. KUNII, “Studies on Effective Thermal Conductivities in Packed Beds,” Am. Inst. Chem. Eng. J., 3, 373 (1957); https://doi.org/10.1002/aic.690030317.
- S. BECKER and E. LAURIEN, “Three-Dimensional Numerical Simulation of Flow and Heat Transport in High-Temperature Nuclear Reactors,” High Perform. Comput. Sci. Eng., 22, 189 (2002); https://doi.org/10.1016/S0029-5493(03)00011-6.
- C. T. HSU, P. CHENG, and K. W. WONG, “Modified Zehner-Schlünder Models for Stagnant Thermal Conductivity of Porous Media,” Int. J. Heat Mass Transfer, 37, 17, 2751 (1994); https://doi.org/10.1016/0017-9310(94)90392-1.
- E. TSOTSAS and H. MARTIN, “Thermal Conductivity of Packed Beds: A Review,” Chem. Eng. Process., 22, 19 (1987); https://doi.org/10.1016/0255-2701(87)80025-9.
- J. GE et al., “CFD Investigation on Thermal Hydraulics of the Passive Residual Heat Removal Heat Exchanger (PRHR HX),” Nucl. Eng. Des., 327, 139 (2018); https://doi.org/10.1016/j.nucengdes.2017.11.029.
- B. RAVERDY et al., “Capabilities of MC3D to Investigate the Coolability of Corium Debris Beds,” Nucl. Eng. Des., 319, 48 (2017); https://doi.org/10.1016/j.nucengdes.2017.04.005.
- K. XU et al., “Parameter Study on Helium Cooled Ceramic Breeder Blanket Neutronics with CFETR Integration Design Platform,” Fusion Eng. Des., 124, 757 (2017); https://doi.org/10.1016/j.fusengdes.2017.04.061.
- E. ZARIFI, G. JAHANFARNIA, and F. VEYSI, “Thermal-Hydraulic Modeling of Nanofluids as the Coolant in VVER-1000 Reactor Core by the Porous Media Approach,” Ann. Nucl. Energy, 51, 203 (2013); https://doi.org/10.1016/j.anucene.2012.07.041.
- R. STAINSBY et al., “Investigation of Local Heat Transfer Phenomena in a Pebble Bed HTGR Core,” NR001/RP/002 R01, AMEC Nuclear (2009).
- L. SNEAD et al., “Fully Ceramic Microencapsulated Fuels: A Transformational Technology for Present and Next Generation Reactors,” Trans. Am. Nucl. Soc., 104, 668 (2011).
- Q. MISTARIHI, J. HWANG, and H. RYU, “The Modeling and Simulation of the Thermal Conductivity of Irradiation U-Mo Dispersion Fuel: Estimation of the Thermal Conductivity of the Interaction Layer,” J. Nucl. Mater., 510, 199 (2018); https://doi.org/10.1016/j.jnucmat.2018.08.014.
- R. PROGELHOF, J. THRONE, and R. RUETSCH, “Methods for Predicting the Thermal Conductivity of Composite Systems: A Review,” Polym. Eng. Sci., 16, 9, 615 (1976); https://doi.org/10.1002/pen.760160905.
- R. HU, “SAM Theory Manual,” ANL/NE–17/4, Argonne National Laboratory (2017).
- J. HALES et al., “BISON Theory Manual,” INL/EXT-13-29930 Rev. 3, Idaho National Laboratory (2016).
- M. DeHART et al., “MAMMOTH Theory Manual,” INL/EXT-19-54252, Idaho National Laboratory (2019).
- B. S. KIRK et al., “libMesh: A C++ Library for Parallel Adaptive Mesh Refinement/Coarsening Simulations,” Eng. Comput., 22, 3–4, 237 (2006); https://doi.org/10.1007/s00366-006-0049-3.
- “PETSc Users Manual,” ANL-95/11, Argonne National Laboratory (2020).
- F. KONG et al., “A General-Purpose Hierarchical Mesh Partitioning Method with Node Balancing Strategies for Large-Scale Numerical Simulations,” Proc. IEEE Workshop on Latest Advances in Scalable Algorithms for Large-Scale Systems (2018); https://doi.org/10.1109/ScalA.2018.00012.
- S. SCHUNERT et al., “Finite Volume Discretization of the Euler Equations in Pronghorn,” INL/EXT-20-58883, Idaho National Laboratory (2020).
- Y. SAAD and M. SCHULTZ, “GMRES: A Generalized Minimal Residual Algorithm for Solving Nonsymmetric Linear Systems,” J. Sci. Statist. Comput., 7, 3, 856 (1986); https://doi.org/10.1137/0907058.
- B. STOCKER and H. NIESSEN, “Data Sets of the SANA Experiment 1994–1996,” JUEL-3409, Forschungszentrum Julich (1996).
- A. NOVAK et al., “Validation of Pronghorn Friction-Dominated Porous Media Thermal-Hydraulics Model with the SANA Experiments,” Nucl. Eng. Des., 350, 182 (2019); https://doi.org/10.1016/j.nucengdes.2019.04.037.
- C. DU TOIT et al., “A Systems CFD Model of a Packed Bed High Temperature Gas-Cooled Nuclear Reactor,” Int. J. Therm. Sci., 45, 70 (2006); https://doi.org/10.1016/j.ijthermalsci.2005.04.010.
- H. LIM and H. NO, “GAMMA Multidimensional Multicomponent Mixture Analysis to Predict Air Ingress Phenomena in an HTGR,” Nucl. Sci. Eng., 152, 1, 87 (2006); https://doi.org/10.13182/NSE06-5.
- P. ROUSSEAU, C. DU TOIT, and W. LANDMAN, “Validation of a Transient Thermal-Fluid Systems CFD Model for a Packed Bed High Temperature Gas-Cooled Nuclear Reactor,” Nucl. Eng. Des., 236, 5–6, 555 (2006); https://doi.org/10.1016/j.nucengdes.2005.11.016.
- A. NOVAK et al., “Preliminary Coupling of OpenMC and Nek5000 Within the MOOSE Framework,” Proc. PHYSOR, Cancun, Mexico, April 22–26, 2018.
- “PBMR Coupled Neutronics/Thermal-Hydraulics Transient Benchmark: The PBMR-400 Core Design,” NEA/NSC/DOC(2013)10, Organisation for Economic Co-operation and Development Nuclear Energy Agency (2013).
- P. BALESTRA et al., “PBMR-400 Benchmark Solution of Exercise 1 and 2 Using the MOOSE Based Applications: MAMMOTH, Pronghorn,” Proc. PHYSOR 2020, Cambridge, United Kingdom, March 29–April 2, 2020.
- A. KOSTER, H. MATZNER, and D. NICHOLSI, “PBMR Design for the Future,” Nucl. Eng. Des., 222, 2–3, 231 (2003); https://doi.org/10.1016/S0029-5493(03)00029-3.
- S. LEE, J. JEONG, and W. LEE, “Thermal-Hydraulic Analysis of OECD Benchmark Problem for PBMR 400 Using MARS-GCR,” Proc. 2006 Spring Mtg. Korean Nucl. Soc., May 25–26, 2006.
- H. GERWIN et al., “TINTE—A Two-Dimensional Code for Reactor Dynamics,” JUL-4294, Institute for Energy Research (2009).
- C. VILJOEN et al., “The Re-Evaluation of the AVR Melt-Wire Experiment Using Modern Methods with Specific Focus on Bounding the Bypass Flow Effects,” Proc. Fourth Int. Topl. Mtg. High Temperature Reactor Technology, Washington, D.C., September 28–October 1, 2008; https://doi.org/10.1115/HTR2008-58115.
- R. BÄUMER et al., “Construction and Operating Experience with the 300-MW THTR Nuclear Power Plant,” Nucl. Eng. Des., 121, 155 (1990); https://doi.org/10.1016/0029-5493(90)90100-C.
- S. SCHUNERT et al., “NEAMS Progress Report on Coupling of Pronghorn and RELAP-7 for Very High Temperature Reactor (VHTR) Applications,” INL/EXT-19-54495, Idaho National Laboratory (2019).
- S. JUN, Z. YANHUA, and L. FU, “Various Bypass Flow Paths and Bypass Flow Ratios in HTR-PM,” Energy Procedia, 39, 258 (2013); https://doi.org/10.1016/j.egypro.2013.07.212.
- S. JUN, Z. YANHUA, and L. FU, “Researches of Bypass Flows from Cold Plenum to Hot Plenum in HTR-PM by the Flow Network Method,” Proc. ICONE20, Anaheim, California, July 30–August 3, 2011.
- C. ANDREADES et al., “Technical Description of the ‘Mark 1’ Pebble-Bed Fluoride-Salt-Cooled High-Temperature Reactor (PB-FHR) Power Plant,” UCBTH-14-002, University of California, Berkeley (2014).
- P. ROMANO et al., “OpenMC: A State-of-the-Art Monte Carlo Code for Research and Development,” Ann. Nucl. Energy, 82, 90 (2015); https://doi.org/10.1016/j.anucene.2014.07.048.
- P. BALESTRA, D. REGER, and S. SCHUNERT, “Development of PBR Reference Plant for Multiscale, Multiphysics PFLOC/DLOFC Simulations,” INL/EXT-20-59507, Idaho National Laboratory (2020).
- G. MARLEAU, A. HÉBERT, and R. ROY, “A User Guide for DRAGON Version 4,” IGE-294, École Polytechnique de Montréal (2016).
- G. ILAS et al., “Validation of SCALE for High Temperature Gas-Cooled Reactor Analysis,” ORNL/TM-2011/161, Oak Ridge National Laboratory (2012).
- L. MASSIMO, Physics of High-Temperature Reactors, 1st ed., Pergamon (1976).