
 ?Mathematical formulae have been encoded as MathML and are displayed in this HTML version using MathJax in order to improve their display. Uncheck the box to turn MathJax off. This feature requires Javascript. Click on a formula to zoom.
Abstract
The Molten Salt Reactor Experiment (MSRE), which operated at Oak Ridge National Laboratory from 1965 to 1969, was an experimental reactor that used UF4 fuel dissolved in molten fluoride salt. Criticality was achieved when the fuel salt mixture passed through the graphite-moderated core region. Therefore, because the fuel and fission products flowed through the system, delayed neutron precursors were not confined to the core, and decay heat was released outside the core, which is a unique challenge relative to more traditional reactor designs with solid fuel. Therefore, research and demonstration reactors such as MSRE have become a valuable source of information for benchmarking modeling and simulation tools for advanced reactor designs. One such tool being considered is GOTHIC, which is a coarse-grid computational fluid dynamics multiphysics software package. GOTHIC includes attributes and physical phenomena needed for modeling these advanced, non–light water reactor designs. For example, GOTHIC includes fluid property tables for various molten salts; a tracer-tracking module for modeling fission products and the radioactive decay and heat release by delayed neutron precursors locally in the fluid outside the core; and other necessary capabilities for modeling molten salt reactor (MSR) designs, including the ability to model dissolved gases. GOTHIC is used to benchmark steady-state and transient conditions from the MSRE. Zero-power physics testing included fuel salt pump start-up and coast-down transients with a control rod automatically moving to maintain criticality. The control rod motion calculated by GOTHIC is a reasonable match to measured data from these transients. Further, low-power testing included a natural convection transient with no control rod motion such that reactor power was responding to heat load demand from the radiator. The reactor power and fuel salt and coolant salt temperatures calculated by GOTHIC exhibit good agreement with measured data. These results confirm GOTHIC capabilities for modeling MSR designs with circulating fuel.
I. INTRODUCTION
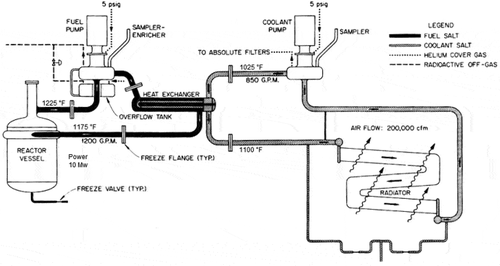
Many of the next generation of nuclear reactors that are currently being designed use fluids other than water as the coolant, such as molten salts, sodium, helium, etc. These advanced reactors focus on inherent and passive safety features to provide increased efficiency, reliability, and safety relative to the existing fleet of light water reactors (LWRs) and heavy water reactors used around the world for electricity generation. Although non-LWRs are considered an advanced technology, many research and demonstration non-LWRs have been built and operated. For example, the Molten Salt Reactor Experiment (MSRE), which was an outgrowth of the aircraft reactor program, was a proof-of-concept, liquid-fueled, graphite-moderated, thermal reactor that operated at Oak Ridge National Laboratory from 1965 to 1969. The fuel, UF4, was dissolved in fluoride salt maintained in the liquid phase and circulated through the fuel salt loop, as shown in . Criticality could be achieved only in the graphite-moderated core. Heat generated in the core by fission and throughout the fuel salt loop by decay of fission products was transferred via a heat exchanger into a coolant salt loop that transferred its heat to the environment by means of an air-cooled radiator. A detailed description of the MSRE design can be found in CitationRef. 1.
Fig. 1. Flow diagram of the MSRE (based on of CitationRef. 9 using design values from CitationRef. 1)
As non-LWR designs are being considered for the next generation of commercial application, there has also been a shift from a “design-by-test” to a “design-by-simulation” mind-set as the costs to design, construct, and operate test facilities have increased significantly since the 1960s and 1970s. Further, the distortions that can be introduced by reduced-scale testing are widely recognized. As a result, the capital investment in test facilities is not emphasized for these new designs as much as it had been in the past. Instead, advanced modeling and simulation (AMS) tools are seen as a safer and more economical design tool. AMS also potentially provides access to a much richer dataset, which provides access to information that may be unmeasurable in a test and is not subject to instrumentation uncertainty, lag, or failure. Still, there is a need to perform verification and validation of simulation tools to establish their credibility. Therefore, research and demonstration reactors such as MSRE have become a valuable source of information for benchmarking AMS tools for advanced reactor designs.
This paper documents steady-state and transient benchmarks of the MSRE fuel salt loop using GOTHIC. GOTHIC (CitationRef. 2) is a general-purpose, multiphysics engineering design and analysis tool that can be used for both LWR and non-LWR designs. The GOTHIC model of the MSRE applies reactor power using GOTHIC’s point neutron kinetics model, and decay heat and delayed neutron production throughout the fuel salt loop are accounted for using GOTHIC’s tracer capability, which can track any number of isotopes with user-specified half-life, decay heat, and progeny. This ability to directly model delayed neutron precursor production, transport, and decay throughout the primary loop combined with the other capabilities and flexible nodalization scheme in GOTHIC make it a unique analysis tool. The GOTHIC predictions are compared to the available MSRE experimental data herein. Applicable verification benchmarks are also included to demonstrate the fundamental modeling attributes. Together, these provide evidence of GOTHIC’s applicability for modeling molten salt reactor (MSR) designs with circulating fuel and decay heat release outside the core.
Other works have benchmarked to the MSRE using other codes, including RELAP5-3D (CitationRef. 3), a modified version of RELAP5 (CitationRef. 4), TRACE (CitationRef. 5), SAM (CitationRef. 6), TRANSFORM (CitationRef. 7), and CFD (CitationRef. 8) as examples; however, some of these tools are either limited to steady-state conditions, are still under development, or may not be able to provide sufficient accuracy or computational efficiency to support practical engineering design and analysis of advanced reactors. Meanwhile, GOTHIC has a long-standing history of being an industry-trusted tool with proven results for many different applications. It has been under continuous development since the mid-1980s with an active user community. The familiarity and pedigree of GOTHIC within the nuclear industry and regulators, compliance with nuclear quality assurance (NQA) requirements, and fundamental physics make GOTHIC a desirable choice for modeling advanced reactor designs. GOTHIC’s modeling capabilities for both steady-state and transient scenarios from the MSRE are included in this paper.
II. DESCRIPTION OF THE MSRE
Shown in , the MSRE was originally designed to operate at 10 MW(thermal) but was actually limited to 8 MW(thermal) by the design of its radiator. The temperatures shown in are based on the design power of 10 MW(thermal). Fuel salt with a flow rate of 75.7 L/s [1200 gallons per minute (gpm)] enters the reactor vessel at a temperature of 908.2 K (1175°F) and leaves it at a temperature of 935.9 K (1225°F). The fuel salt is LiF-BeF2-ZrF4, with the fuel dissolved as UF4. A heat exchanger transfers into a cooling loop the fission heat generated in the core and the decay heat generated in the fuel salt. LiF-BeF2 coolant salt at a flow rate of 53.6 L/s (850 gpm) enters the heat exchanger at a temperature of 824.8 K (1025°F) and leaves it at a temperature of 866.5 K (1100°F). Heat is transferred from the coolant salt loop to the environment via a radiator, through which air at a flow rate of 94 389.5 L/s [200 000 cubic feet per minute (cfm)] enters at a temperature of 310.9 K (100°F) and exits at a temperature of 422.0 K (300°F) (CitationRef. 1). The reactor vessel and piping were constructed from Hastelloy-N, a nickel-molybdenum-chromium alloy specifically developed for compatibility with the fluoride salts used in the MSRE.
III. GOTHIC
GOTHIC is coarse-grid computational fluid dynamics (CFD) multiphysics software package. It solves the conservation equations for mass, momentum, and energy for multicomponent, multiphase flow in lumped parameter [zero-dimensional (0-D)] and multidimensional geometries [one-dimensional (1-D), two-dimensional (2-D), or full three-dimensional (3-D)], including the effects of turbulence, diffusion, and buoyancy. It also includes the ability to track different types of materials in the flow, including fission products, solid particles, and dissolved gas.
III.A. Background
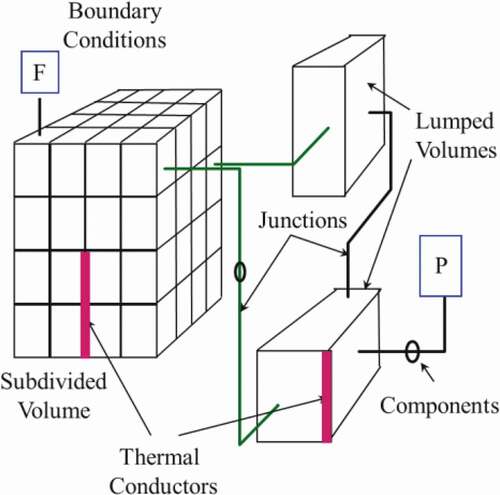
GOTHIC is a hybrid tool that bridges the gap between traditional system-level thermal-hydraulic analysis tools and CFD analysis tools. For example, traditional system-level codes are generally limited to confined geometries and wall-drag–dominated flows. Meanwhile, GOTHIC includes a full treatment of the fluid-fluid shear as well as molecular and turbulent diffusion, which is consistent with what would be found in a CFD-type code. GOTHIC also considers conduction within the fluid and includes second-order–accurate advection schemes to minimize numerical diffusion. These elements allow GOTHIC to accurately simulate mixing, stratification, and buoyancy-driven natural circulation of liquid or vapor in large open regions (e.g., open cores, pools, containments, rooms, etc.). At the same time, GOTHIC uses a multivolume domain decomposition approach, which provides the ability to apply varying levels of detail throughout the model, as illustrated in . This allows the analyst to place more detail in the region(s) of primary interest to optimize the computational effort while still capturing the integrated system response and feedback effects. This modeling flexibility is not typically available in a CFD code and allows for the entire system to be represented in one integrated model without the need for coupling to another fluid analysis code. GOTHIC uses a porous-medium approach with cell volume and cell face porosities used to model arbitrary geometries of varying complexity based on the Fractional Area Volume Obstacle Representation (FAVOR) methodology.Citation10
Fig. 2. Schematic representation of modeling flexibility provided by GOTHIC
Still, GOTHIC includes the same types of features and capabilities provided by traditional system-level codes, including
component models for plant equipment such as pumps/fans, valves/doors, heat exchangers, fan coolers, vacuum breakers, pressure relief valves, spray nozzles, coolers and heaters, hydrogen recombiners and ignitors, filters and sump strainer, and dryer/demisters
point neutron kinetics model
control system capability and trips.
Further, GOTHIC’s integrated analysis environment, which includes a graphical user interface to prepare a GOTHIC model, a numerical solver to execute transient simulations, and a postprocessor to plot and extract results, allows for fast model creation and visualization of results. This allows for scoping studies or design concepts to be quickly investigated. This flexibility is critical at the early stages of advanced reactor development. This, combined with the flexible nodalization scheme (0-D to full 3-D), the diverse equation set, and models for fundamental physical phenomena, makes the software applicable for a wide range of applications and provides results that are unrealizable in a practical sense with either traditional system-level or CFD codes. Additionally, GOTHIC has been developed and maintained within a NQA program that complies with 10 CFR 50, Appendix B and applicable parts of ASME NQA-1 (particularly Subpart 2.7).Footnotea
III.B. Generalized Fluid Property Framework
GOTHIC 8.3(QA), which represents the latest release of the software, includes a generic fluid property framework that allows the software to be used for non-LWR applications. The fluid property tables can be generated using data from NIST RefPropCitation11 or using a stand-alone program to evaluate the equation of state. Because GOTHIC is a two-phase compressible flow code, property tables to be used with GOTHIC must include information for both liquid and vapor phases. This can be challenging when information on the thermodynamic and transport properties is limited, as is the case for molten salts. Data that are currently publicly available typically at best provide temperature-dependent information for the liquid phase, and very little if any information is available for the vapor phase.
For example, LiF-BeF2 (66.7%-33.3%), which is also referred to as FLiBe, was one of the salts used in the MSRE. CitationReference 12 provides temperature-dependent correlations for FLiBe for liquid properties, including the following:
Density:
Thermal conductivity:
Viscosity:
and
Constant pressure specific heat:
Note that the expression for thermal conductivity is based on EquationEq. (6)(6)
(6) from CitationRef. 12. Similar property information for other molten salts are available in CitationRefs. 12 and Citation13 and has been used to generate GOTHIC fluid property tables for FLiBe as well as a variety of other commonly used molten salts, including
NaCl-MgCl2 (58.5%-41.5%)
LiF-NaF-KF (46.5%-11.5%-42%), which is also referred to as FLiNaK
NaF-ZrF4 (59.5%-40.5%)
KF-ZrF4 (58%-42%)
NaBF4-NaF (92%-8%).
To overcome the limited property data available for the molten salts, a process was developed to calculate temperature-dependent multipliers for each molten salt relative to sodium, where methods for generating thermodynamic properties for sodium liquid and vapor are documented in CitationRefs. 14 and Citation15. These methods provide thermodynamic properties for saturated liquid and vapor, subcooled liquid, and superheated vapor states. Thermodynamic and transport properties for saturated sodium liquid and vapor are provided in CitationRef. 16. The methods from CitationRefs. 14 and Citation15 have been combined with the information in CitationRef. 16 to generate sodium thermodynamic and transport properties for use with GOTHIC, as demonstrated in CitationRef. 17. The application of temperature-dependent multipliers for the molten salts relative to sodium provides the necessary fluid property data required by GOTHIC to fully function as a compressible, two-phase, thermal-hydraulic code despite the limited experimental data available for molten salts. Additional details about the fluid property table generation process can be found in CitationRef. 18.
The resulting pressure-enthalpy phase diagram covering the range of data included in the Generalized Fluid Property (GFP) file used by GOTHIC for FLiBe is given in .
Fig. 3. Pressure-enthalpy phase diagram LiF-BeF2
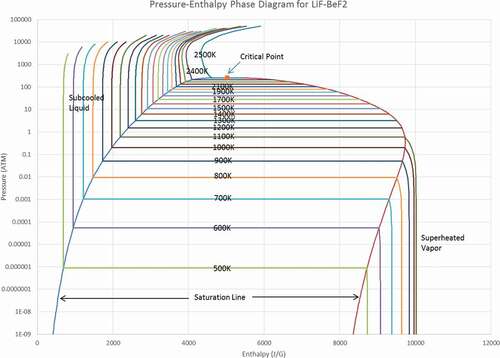
The temperature-dependent molten salt properties can be used for single-phase liquid calculations including phenomena such as natural convection and thermal diffusion. Conditions that are significantly affected by the presence of vapor are not reliable because those properties are based on sodium. This is not a limitation of GOTHIC since the code readily models two-phase flow but rather is a lack of available data for vapor properties for molten salts. Fortunately, this is generally not a concern since boiling and related vapor-dominated phenomena are not expected to occur even in severe accident scenarios due to exceptionally high boiling temperatures for molten salts. The boiling temperature for most of the salts currently included in GOTHIC is on the order of 1300°C to 1600°C. Valid temperature ranges are not explicitly listed in CitationRefs. 12 or Citation13 for the fluid property correlations, but examination of the tabular and graphical information presented in those references implies that valid temperatures are probably limited to the 500°C to 900°C range, which is much lower than the boiling point. On the other end of the spectrum, the properties do extend down to the freezing condition, and GOTHIC includes modeling for ice formation and melting on surfaces. This capability was added to GOTHIC in the early 1990s to support ice condenser containment designs, but it is also applicable for modeling overcooling transients and freeze plugs for MSRs.
If another fluid is needed or improved data become available, these can be easily accommodated by generating a new fluid property table and do not require GOTHIC itself to be modified or recompiled. Further, multiple sets of tables can be generated to account for changing salt composition over time due to fission and transmutation products. Alternatively, GOTHIC also includes an ability to track solid or aqueous materials within the fluid. These are referred to as liquid components in GOTHIC. They occupy volume in the fluid and impact the mass, momentum, and energy of the fluid by calculating an effective density and enthalpy for the fluid mixture. The liquid components in GOTHIC have been used for modeling boron for LWRs as well as aqueous solutions with varying concentrations of uranyl sulfate (UO2SO4) for medical isotope applications. Additional details about the capability are available in CitationRef. 19. The time-dependent nature of the salt composition is an important part of modeling circulating fuel reactors because the salt composition is closely linked to the thermophysical properties and the neutronics of the system, so how that composition changes over time must be considered in the design and safety analysis of these reactors. The liquid components provide a way to model a fluid with a changing composition over time without needing to generate multiple sets of fluid property tables. In GOTHIC 8.3(QA) and earlier, the presence of the components does not affect the viscosity, thermal conductivity, or surface tension of the fluid, but these contributions will be included in the future to provide a more complete representation of the thermophysical property variations. Using liquid components in GOTHIC to represent the fuel material is more of a first-principles approach to modeling the salt composition but will depend on the available information for fluid properties. Generally, it is easier to measure the properties of a bulk fluid rather than to quantify the contributions of individual constituents at varying concentrations in the fluid mixture; however, GOTHIC can accommodate either approach either through multiple sets of fluid property tables or the liquid component feature.
III.C. Molten Salt Property Verification
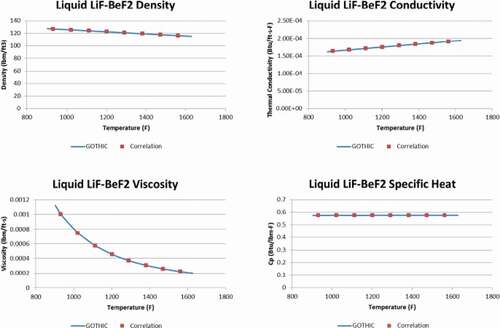
A series of verification problems is performed for each GFP to confirm that the fluid properties were implemented properly. This means that the values in the table are consistent with the available data/correlations and that GOTHIC properly retrieves and uses these values in the simulation. A series of single-volume heat-up problems was used to verify liquid density, thermal conductivity, dynamic viscosity, and specific heat. The control variables included in these models allowed the values of GOTHIC to be used internally to be plotted and compared to the values calculated from the correlations given previously. A representative result is shown in , where the GOTHIC predictions are shown as solid lines and the symbols show the underlying data. The plots in confirm that the temperature-dependent liquid properties used by GOTHIC accurately represent the available temperature-dependent data.
Fig. 4. LiF-BeF2 liquid property comparisons
An additional set of verification tests was performed for each of the molten salt fluid property tables comparing the GOTHIC-predicted results to analytical solutions for thermal diffusion, pressure drop, speed of sound, etc., by comparing the resulting property values from the GOTHIC model runs against values calculated using the analytical methods. Although not shown here, excellent agreement (less than 1% difference) was obtained relative to the analytical solutions, which confirms that GOTHIC properly applies the property information to important closure relationships to predict the expected thermal-hydraulic response when modeling molten salts.
GOTHIC generally includes generic closure relationships based on nondimensional parameters that are applicable for a wide range of fluids. However, if a molten salt–specific closure relationship is identified, then this can be accommodated by GOTHIC using a dynamic linked library (DLL), which can be applied in GOTHIC through control variables and forcing functions. This allows alternative friction factors, heat transfer coefficients (HTCs), etc., to be applied without having to modify the GOTHIC source code. This flexibility allows for the end user to quickly evaluate various correlations during the design stage but can also be used to apply proprietary correlations without having to disclose any intellectual property. An example of this is provided in CitationRef. 17.
III.D. Tracer Tracking in GOTHIC
A distinctive feature of GOTHIC is the ability to track radioactive isotopes, decay, and decay heat release within the fluid, which is necessary for modeling delayed neutron precursor concentrations and decay heat release outside the core for any MSR design with circulating liquid fuel. Without this, the temperature distribution in the loops and the transient system response will not be accurately characterized in the simulation. Further, these tracers can also be used to support fission product transport and release evaluations.
GOTHIC solves a set of tracer transport equations that track the molar inventory of each tracer in the liquid and vapor phases as well as each drop/aerosol field in each cell. The tracer inventory is also tracked in filters (both generalized and charcoal filters) and thermal conductor surfaces. The effects of radioactive decay can be optionally included with up to three progeny for each tracer. Basic assumptions for the tracer conservation equations are the following:
Tracers do not have any mass or volume.
Tracers have no effect on the thermodynamic or thermal-hydraulic transport properties of the carrier fluids.
Aside from diffusion, tracers move at the same speed as the carrier fluid.
For drop entrainment, deposition, and agglomeration, the tracers are transferred with the transferred mass.
The diffusion of any particular tracer is not affected by the presence of other tracers.
The general form of the tracer conservation in GOTHIC is
where
| = | molar density of tracer | |
| = | decay constant of tracer k | |
| = | fraction of tracer | |
| = | filtering factor for tracer | |
| = | total diffusion coefficient for tracer |
The filtering factor takes the value one when flow is out of the cell and one minus the filter efficiency when flow is into the cell, passing through the filter. A source term is also applied in the energy equation for the carrier phase to account for any decay heat released from tracer k.
Tracers can be included in the initial system inventory or can be added to the system via tracer sources located in a cell or a boundary condition.
III.E. Verification of GOTHIC’s Tracer Capability
This section outlines the fundamental verification of tracer transport, diffusion, and decay heat release, which provides confidence in these elements that are particularly important for modeling circulating fuel reactor designs like the MSRE.
The model shown in provides verification of tracer transport in GOTHIC. The model includes three tracers (A, B, and C) although only two of the tracers (A and C) were assigned nonzero concentrations. All volumes are lumped parameter representations, except for volume 5, which is subdivided with a 2w × 2d × 5h grid. A 3-D connector is used to connect the lower six cells on the east face of Volume 5 to lumped Volume 6. A constant liquid flow of 2.832e-3 m3/s (0.1 ft3/s) is supplied with a nominal tracer mixture concentration of 3.53 mol/m3 (0.1 mol/ft3) that comprises 20% Tracer A and 80% Tracer C. With a total system volume of 1.42 m3 (50 ft3), the system turnover time is 500 s.
Fig. 5. Verification of tracer transport
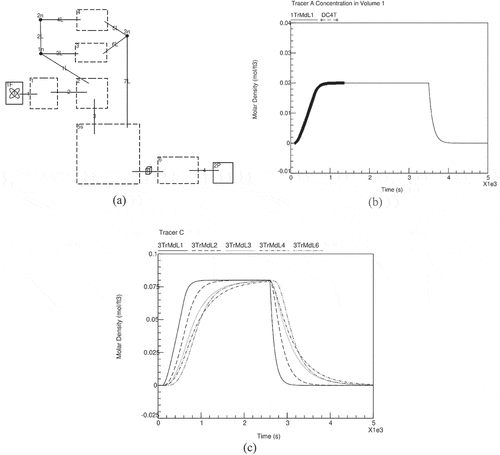
The flow is started at 100 s and turned off at 3500 s. A forcing function applies a linear ramp to the tracer source concentration from 0 to 3.53 mol/m3 (0.1 mol/ft3) over the first 500 s. A second forcing function is applied to the source concentration of Tracer C so that it quickly drops to 0 at 2500 s. After the on trip, the concentration of Tracer A in Volume 1 is governed by
where
V = cell volume [0.28 m3 (10 ft3)]
Q = volumetric vapor flow rate [2.832e-3 m3/s (0.1 ft3/s)]
= source concentration [2.825 mol/m3 (0.08 mol/ft3)].
shows the GOTHIC-calculated results in good agreement with the results of a spreadsheet-based numerical integration of tracer transport governed by EquationEq. (6)(6)
(6) and represented by curve DC4T. shows Tracer C in multiple locations appearing and turning off at different times dependent on the flow of the tracer through the system.
Next, the tracer diffusion modeling is verified by comparison with an analytic solution for time-dependent 1-D diffusion. The test geometry is shown in . The 1-D diffusion equation with a constant diffusion coefficient is
Fig. 6. Model for tracer diffusion verification
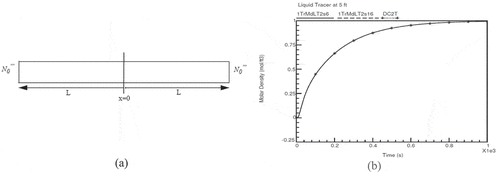
with initial and boundary conditions of
and
where x is measured from the midpoint of the duct and 2L is the duct length. The test model represents a square duct [0.3 × 0.3 m (1 × 1 ft)] that is 6.4 m (21 ft) long. The volume is subdivided along the length with 0.3-m (1-ft) nodes and initialized with liquid. There is a tracer source at each end, and a control system is used to maintain a tracer concentration of 35.3 mol/m3 (1 mol/ft3). With this configuration, the tracer concentration should be symmetric about the center plane and consistent with the analytic solution (DC1T) as shown in . This test was repeated in the y and z directions as well to confirm that diffusion behaves as expected in all directions.
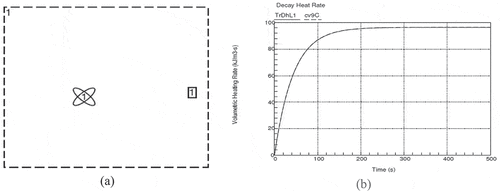
Last, it can be confirmed that the GOTHIC energy addition to the system is consistent with the specified decay heat release and decay rate for decay. The test model is shown in . The volume is 1 m3 and filled with liquid. The tracer source is constant at 1.0 × 10⁻⁷ mol/s with a half-life of 30 s and decay heat of 10 MeV/fission. The conductor has a large convective HTC on the volume side and a specified temperature of 20℃ on the other side to remove the decay heat.
Fig. 7. Model for tracer decay heat verification
The decay constant is
The concentration of tracer concentration (mol/m3) is governed by
where is the source rate and V is the volume. For an initial tracer concentration of zero, the solution to EquationEq. (12)
(12)
(12) is
and the volumetric heat rate due to decay is
where is the decay heat factor (MeV/fission) and
is Avogadro’s number (6.02214 × 10²³ molecules/g‧mol). From EquationEqs. (13)
(13)
(13) and Equation(14)
(14)
(14) and the given conditions, the steady tracer concentration is
and the steady heat rate is
Control variables were constructed to represent EquationEqs. (13)(13)
(13) and Equation(14)
(14)
(14) to calculate the theoretical heat from decay as a function of time for comparison with the GOTHIC results. shows good agreement between the calculated volumetric heating rate from decay (TrDhL1) and the analytic solution from the system of the control variable (cv9C), attaining the expected steady-state heat rate.
The results presented in this section for tracer transport, diffusion, and decay heat release provide evidence that the important physical phenomena for tracking delayed neutron concentrations and decay heat release outside the core for circulating fuel reactors are implemented properly in GOTHIC and provide the expected result. Additional details about other recent modifications to GOTHIC to support non-LWR applications can be found in CitationRef. 18.
IV. GOTHIC MODEL OF MSRE
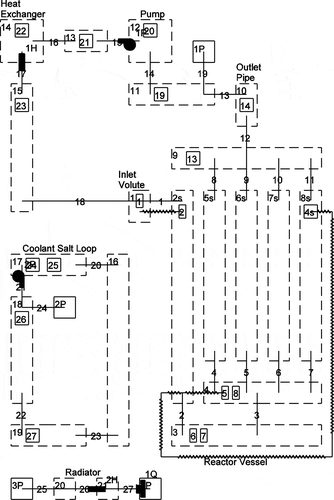
The GOTHIC model of the MSRE includes three independent loops: a primary side consisting of the reactor vessel and associated piping loop containing the fuel salt and a secondary side consisting of loop piping and a radiator containing the coolant salt. The two loops are thermally connected through a heat exchanger. Then, the air side of the radiator is the ultimate heat sink (UHS) for the MSRE and is thermally connected to the secondary side containing the coolant salt. A schematic of this is shown in .
Fig. 8. GOTHIC model of the MSRE
The actual MSRE used LiF-BeF2-ZrF4-UF4 (65%-29%-5%-1%) for the fuel salt and LiF-BeF2 (FLiBe) for the coolant salt; however, for this benchmark both the fuel salt and the coolant salt are represented using LiF-BeF2 with the properties outlined in Sec. III.B and verified in Sec. III.C. This does neglect the presence of the fuel material on the thermophysical properties of the fluids but is consistent with the approach used in benchmarks performed by other codes.Citation3,Citation6,Citation7 A comparison of FLiBe at 922 K (1200 F) to historical values for fuel salt used in the MSRE is available in Table 2.1 of CitationRef. 1 but is also summarized in here. These differences are acceptable for the purposes of this benchmark as the differences in properties, which will impact GOTHIC’s predicted pressure drop and heat transfer, are offset by the hydraulic balancing and heat exchanger performance adjustments that were determined using the MSRE design values. Properties for a specific fuel salt composition or a time-dependent fuel salt composition can be applied in GOTHIC for future evaluations as described in Sec. III.C.
TABLE I Comparison of Fluid Properties for FLiBe and the MSRE Fuel Salt
The reactor vessel comprises the following control volumes:
Control volume 1 – inlet volute: The inlet volute is effectively the outer half of a torus and wraps around the reactor vessel shell. Molten salt flows into it via a single pipe, flow path 18. There are 84 holes that are 1.91 cm (¾ in.) in the reactor vessel wall through which molten salt flows from the volute to the downcomer. Flow path 1 represents these holes.
Control volume 2sFootnoteb – downcomer: The downcomer is the annular region between the reactor vessel wall and the core container. Control volume 2s is subdivided along the z-axis. There are nine cells, with the height of the top cell corresponding to that of the inlet volute. The remaining eight cells are equally spaced. Flow path 2 represents the annular gap at the bottom of the downcomer through which molten salt flows into the lower plenum. Any core bypass flow into the upper plenum is neglected.
Control volume 3 – lower plenum: The lower plenum is the torispherical lower head of the reactor vessel. The transition into the core support region is represented by flow path 3.
Control volume 4 – core inlet: The core inlet region is bounded by the grid support plates. Molten salt flows into the modeled core regions via flow paths 4, 5, 6, and 7.
Control volumes 5s through 8s – radial core regions: The MSRE core design given in CitationRef. 20 divided the core into five radial regions. Control volumes 5s, 6s, and 7s represent the inner three regions. The outer two regions are combined into control volume 8s. Each core control volume has ten cells, with cells 2 through 9 lining up with the top eight downcomer cells. Molten salt flows from the modeled core regions into the upper plenum via flow paths 8, 9, 10, and 11.
Control volume 9 – upper plenum: The upper plenum is the torispherical lower head of the reactor vessel. Molten salt flows into the outlet pipe from the upper plenum via flow path 12.
Control volume 10 – outlet pipe: There is a 25.4-cm (10-in.) pipe at the top of the upper plenum through which control rods pass and through which molten salt exits the reactor vessel. Because no pipe schedule is specified, this pipe, as well as the 12.7-cm (5-in.) loop piping, is assumed to be Schedule 40. Molten salt flows into the fuel salt loop piping via flow path 13.
The volumes of the reactor vessel control volumes were calculated based on reactor vessel geometry.
During the MSRE design phase, a full-scale test facility of the reactor vessel was built for hydraulic testing using water.Citation20 The core and vessel differential pressures were measured to be 7.79 kPa (0.6 ft) and 44.6 kPa (15 ft), respectively, at 75.7 L/s (1200 gpm) (CitationRef. 21). The GOTHIC model was hydraulically balanced using these experimental data by adjusting the loss coefficients of flow paths 5, 6, 7, and 8 for core differential pressure and loss coefficients of flow paths 1, 2, 3, and 4 for reactor vessel differential pressure as well as the fluid velocities in each region of the core. The benchmark of GOTHIC to this test facility is reported in CitationRef. 22, and those loss coefficients were retained in this model.
Thermal conductors are used in GOTHIC to model the heat capacity of solid structures, heat transfer between the fluid and these structures, heat transfer through solid structures separating volumes, and heat sources associated with the structures. All conductors are defined with two surfaces. Conduction is generally modeled by 1-D heat transfer, which is perpendicular to the two conductor surfaces, but an option for 2-D conduction is available within GOTHIC. A conductor can be thermally connected to one control volume (internal) or two control volumes (external). For internal conductors, either both sides can be attached to the volume or one side can have a thermal boundary condition applied (e.g., specified heat flux, temperature, or HTC). The following reactor vessel structures are included in the GOTHIC model of the MSRE as thermal conductors:
inlet volute outer wall (control volume 1)
2.54-cm-thick (1-in.-thick) vessel cylindrical wallCitation1 (connects control volumes 1 and 2s)
1.43-cm-thick (0.5625-in.-thick) vessel cylindrical wallCitation1 (control volume 2s)
core container, the structure of which is modeled as two conductors, one connecting the downcomer (control volume 2s) and the outer core region (control volume 8s) and one connecting the downcomer and the core inlet region (control volume 4)
reactor vessel lower head (control volume 3)
anti-swirl vanes (control volume 3)
grid support plates (control volume 4)
graphite blocks (control volumes 5s, 6s, 7s, and 8s)
reactor vessel upper head (control volume 9)
reactor vessel outlet pipe (control volume 10).
With the exception of the graphite blocks, the structural elements are INOR-8, whose density, thermal conductivity, and specific heat capacity are documented in Table 2.2 of CitationRef. 1. The internal conductors use an adiabatic boundary condition on the outside surface assuming the MSRE vessel and piping were well insulated. For surfaces exchanging heat with the fluid, the default option in GOTHIC using a Dittus-Boelter–based HTC is utilized for forced convection heat transfer. If a HTC specific to molten salts is identified in the future, then this can be applied in the GOTHIC model using a DLL without having to modify the GOTHIC source code. An example of this is provided in CitationRef. 17.
The fuel salt loop comprises the following control volumes:
Control volume 11: piping between the outlet pipe and the fuel salt pump
Control volume 12: fuel salt pump casing
Control volume 13: piping between the fuel salt pump and the heat exchanger
Control volume 14: heat exchanger shell
Control volume 15: piping between the heat exchanger and the reactor vessel inlet volute.
Fuel salt pump casing, heat exchanger shell, and fuel salt piping volumes are taken from Table 5.4 of CitationRef. 1. Flow paths 13 through 18 represent the fuel salt loop. The shell side of the heat exchanger has a design differential pressure of 165.4 kPa (24 psid) at 75.7 L/s (1200 gpm) (CitationRef. 1, Table 5-9), and its inlet and outlet flow path loss coefficients are set accordingly. Aside from this, loss coefficients representative of the elbows (assumed to be 1.5 r/d) and pipe bend (assumed to be 10 r/d) in the piping are also applied. Thermal conductors are included to represent the piping, fuel salt pump casing, and heat exchanger shell. A volumetric pump maintains the 75.7 L/s (1200 gpm) fuel salt flow rate. A helium cover gas maintains a pressure of 5 psig at the surface of the salt in the pump bowl such that at design conditions, the pressure exiting the reactor is 7 psig (CitationRef. 1). Hence, a pressure boundary condition (1P) maintains a 149.6-kPa (7 psig) pressure at the reactor vessel outlet.
A shell and tube heat exchanger component (1H) transfers heat between the fuel salt and coolant salt loops, with the fuel salt loop serving as the primary side. The GOTHIC built-in heat transfer correlation based on Dittus-Boelter are utilized in the heat exchanger model, but then, the model is benchmarked to thermal performance data for the design. A HTC multiplier was used to adjust for differences relative to the design heat transfer rate at design conditions. This is a standard practice for heat exchanger performance modeling.
The coolant salt loop comprises the following control volumes:
Control volume 16: radiator tubes
Control volume 17: piping between the radiator and the coolant salt pump
Control volume 18: piping between the coolant salt pump and the heat exchanger
Control volume 19: piping between the heat exchanger and the radiator.
CitationReference 1 specifies a total volume of 1246 L (44 ft3) for the coolant salt loop. The radiator tube volume is calculated and applied to control volume 16. The coolant salt pump is assumed to have the same volume as the fuel salt pump. The piping volume is the coolant salt loop volume that is left after subtracting the radiator tube and coolant salt pump volume from 1246 L. The coolant salt pump volume and one-quarter of the piping volume are applied to control volume 17. One-quarter of the piping volume is applied to control volume 18, and one-half of the volume is applied to control volume 19. A volumetric pump maintains the 53.6 L/s (850 gpm) coolant salt flow rate. Thermal conductors model the piping. Because the coolant salt pump has a discharge pressure of 70 psig (CitationRef. 1), a pressure boundary condition (2P) maintains a 584.0-kPa (70 psig) pressure at the top of control volume 18.
The UHS side of the radiator is modeled with the following components:
Control volumes 20 and 21 represent the inlet and outlet air space of the radiator.
Pressure boundary conditions 3P and 4P represent the outside atmosphere.
Flow paths 25, 26, and 27 represent the radiator inlet, tube bundle, and outlet, respectively.
A fan cooler heat exchanger component (2H) transfers heat out of the coolant salt loop.
A volumetric fan (1Q) represents the two draw-through radiator fans and is positioned accordingly. For the purposes of the steady-state benchmarks, the design air flow rate of 200 000 cfm (CitationRef. 1, Table 8.2) is applied.
Thermal conductors with a high conductivity and a low specific heat capacity are used to transfer fission heat into the core. GOTHIC’s neutron kinetics model deposits fission heat into both the moderator and fuel salt in the core in the form of thermal conductor internal heat generation rates. The core heat thermal conductor surface areas are assigned based on the radial power profile from of CitationRef. 20. Furthermore, the heat distribution along the length of a fuel channel is consistent with the axial power profile from of CitationRef. 20. There are three components of reactor power. The first component is decay heat, calculated using decay heat precursor tracers that have both half-life and decay heat, as discussed in Sec. V.A, and comprising approximately 7% of the thermal output. To aid in initializing the model at a specified power level, the model initial conditions include a decay heat precursor inventory consistent with that power output. Otherwise, the GOTHIC model would need to be run for a very long period of time to allow the concentrations of the longest-lived precursors to reach their equilibrium concentrations throughout the system. This is possible if the expected concentrations are unknown but is a computationally inefficient approach. The second component is gamma heating of the graphite moderator, comprising 6.7% of the thermal output (CitationRef. 23, Table 12.2). The final component is the heat deposition in the fuel salt, comprising the remainder of the thermal output.
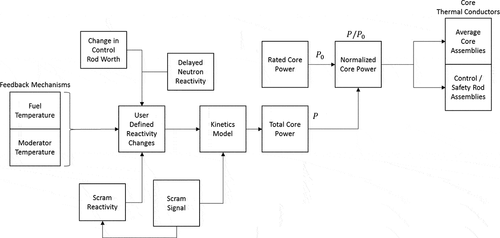
The control variable logic shown in accounts for fuel and moderator temperature coefficients, taken from Table 5.4 of CitationRef. 1; control rod reactivity; and delayed neutron reactivity. These provide the necessary reactivity input to the point neutron kinetics model in GOTHIC. The MSRE was equipped with three control rods. Table 5.4 of CitationRef. 1 and Table 9.1 of Ref. 24 provide control rod worths for one, two, and three rods with a 235U fuel load and a 233U fuel load, respectively. The modeled rod worth in GOTHIC accounts for the number of control rods being used for a particular scenario. Normalized control rod worth as a function of position is taken from Fig. 4.2 of CitationRef. 23. Furthermore, the 1.27 cm/s (0.5 in./s) control rod speed (CitationRef. 1, Table 5.4) is factored into the control rod reactivity response. Delayed neutron precursors are modeled as tracers with a half-life and are added to the molten salt in the core in proportion to reactor power. More detail on the precursor groups is available in Sec. VI. Control variables calculate the delayed neutron fraction in the core and convert it to a reactivity. More detail on delayed neutron reactivity is available in Sec. VII.
Fig. 9. Kinetics logic for MSRE GOTHIC model
A nodalization sensitivity study was performed during the development of the model to confirm the nodalization.
V. BENCHMARK RESULTS FOR STEADY-STATE CONDITIONS
The GOTHIC model is benchmarked against both the 10-MW(thermal) MSRE design power and the 8-MW(thermal) maximum power level that the MSRE was actually able to achieve during operation. There are two benchmark cases for each power level:
Without decay heat: The entirety of the thermal power is produced by fission and gamma heating of the graphite moderator. For the 10-MW(thermal) power level, this case corresponds to the design parameters from CitationRef. 20.
With decay heat: The previous case is then modified to apply 7% of the thermal output as decay heat by employing the 11 decay heat precursor groups, along with their half-life and decay heat values, from Auxiliary Systems Branch (ASB), Branch Technical Position ASB 9-2 (CitationRef. 25) in the form of tracer groups. ASB 9-2 is used by the U.S. Nuclear Regulatory Commission and commercial nuclear plants to estimate decay heat load following shutdown. Current pressurized water reactors and boiling water reactors use low-enriched 235U confined to fuel assemblies, such that all decay heat precursors decay within the core. In contrast, the MSRE initially used 235U but subsequently transitioned to 233U, which necessarily has a slightly different fission yield. Furthermore, gaseous fission products were able to exit the fuel salt via the offgas system, thereby reducing the decay heat load. Unlike commercial nuclear plants, which tend to run continuously at or near full power, the MSRE did not run continuously. Given that the nongaseous fission products were not removed from the fuel, longer-lived decay heat precursors may well have been able to approach a steady-state condition while the concentration of shorter-lived precursors would have fluctuated with reactor power. For these reasons, ASB 9-2 is considered a bounding but reasonable approximation of the decay heat load in the MSRE for the purposes of a benchmark.
The 10-MW(thermal) design parameters consist of system temperatures from CitationRef. 20 and the percent of power deposited in the graphite moderator, as described in CitationRef. 20. The 10-MW(thermal) MSRE design parameters from CitationRef. 20 are compared to parameters calculated by GOTHIC in . In general, the GOTHIC models exhibit good agreement with the design values, which were determined without considering decay heat release outside the core. Without decay heat, the temperature rise between the vessel and core inlets is a result of heat transfer between the core and the downcomer. With decay heat, the GOTHIC-predicted temperatures demonstrate heat-up due to decay heat in the fuel salt outside the core, as expected.
TABLE II Comparison of 10-MW(thermal) MSRE Design Parameters with Values Calculated in GOTHIC
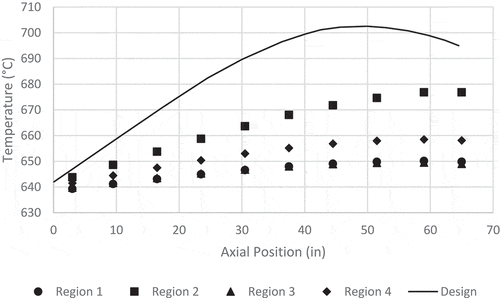
of CitationRef. 20 provides axial temperature profiles for both fuel salt and graphite in the hottest MSRE channel. here compares the fuel salt axial temperature profiles for all four modeled regions against the fuel salt profile from of CitationRef. 20. Likewise, here compares the graphite axial temperature profiles for all four modeled regions against the graphite profile from of CitationRef. 20. There is some difference between the design fuel salt axial temperature profile and that calculated by GOTHIC, but this is to be expected since the design temperature profile represents the hottest channel while the highest temperature profile calculated by GOTHIC consists of average temperature values associated with region 2, a radial region of the core that comprises 78% of the core volume. It is for similar reasons that the graphite temperature profile calculated by GOTHIC is significantly lower than the design temperature profile. Furthermore, in a hot channel, with a higher power level in the fuel salt, there would be a higher level of gamma heating in the adjacent graphite, which would account for the shape of the design temperature profile that is not matched by GOTHIC.
Fig. 10. Steady-state benchmark: fuel salt temperature axial profiles
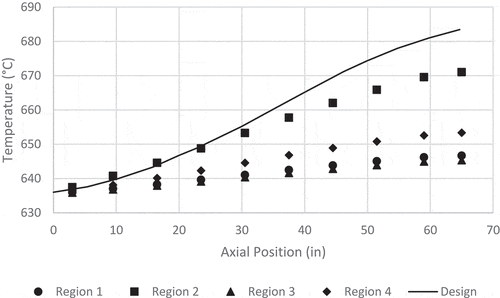
Fig. 11. Steady-state benchmark: graphite temperature axial profiles
The 8-MW(thermal) MSRE measured parameters from CitationRef. 26 are compared to parameters calculated by GOTHIC in . The GOTHIC-predicted results exhibit good agreement with the measured values.
TABLE III Comparison of 8-MW(thermal) MSRE Measured Parameters with Values Calculated in GOTHIC
V.A. Decay Heat Precursor Results
As previously described, the GOTHIC model of the MSRE tracks 11 different decay heat precursor groups consistent with ASB 9-2 (CitationRef. 25). The precursor group concentrations at two different locations within the MSRE fuel salt loop (core region and loop piping regions) are shown in for the 10- and 8-MW(thermal) steady-state benchmarks. The loop (reactor vessel and piping) transit time is approximately 25 s (CitationRef. 1, Table 5.4). The GOTHIC model has a similar transit time. Consistent with expectations, the shorter-lived tracer groups have a lower concentration in the loop than in the core due to decay during loop transit while the longer-lived tracer groups lose little to no concentration through decay while in transit (nearly uniform distribution). Similarly, the concentrations for the 10-MW(thermal) case are greater than they are for the 8-MW(thermal) case, as expected. These results demonstrate GOTHIC’s ability to track the time/location dependent distribution of neutron precursor groups, including decay heat, which is very important to the prediction of MSR designs with flowing fuel.
TABLE IV GOTHIC-Predicted Steady-State Decay Heat Tracer Group Concentrations in the MSRE Fuel Salt
VI. DELAYED NEUTRON PRECURSORS
The GOTHIC model of the MSRE tracks six different delayed neutron precursor groups, each as a separate tracer field. Control variables are used to calculate the delayed neutron fraction associated with the core. Delayed neutron tracers are injected into each cell of the core on a moles per second basis to match the total delayed neutron production rate for the modeled power level. Furthermore, the injection rate into a given cell is proportional to its contribution to total power. Control variables calculate the delayed neutron fraction associated with each delayed neutron precursor group by
calculating the number of moles of each precursor group in the core, in the vessel (excluding the core), and in the piping
calculating the activity of each precursor group in the core, in the vessel (excluding the core), and in the piping by multiplying the number of moles by that group’s decay constant
calculating the total activity of each precursor group by summing its activity in the core, in the vessel (excluding the core), and in the piping
calculating the fraction of each precursor group’s activity that is in the core by dividing its activity in the core by its total activity
calculating the delayed neutron fraction of each precursor group by multiplying its activity fraction by the design static delayed neutron fraction.
This approach neglects the contribution to the delayed neutron fraction of any delayed neutrons generated in the downcomer, core inlet region, and upper plenum, but the magnitude of such a contribution could not be located in the available literature.
lists the half-lives and delayed neutron fractions associated with the 235U delayed neutron precursor groups, which are used for the pump start-up and pump coast-down benchmarks. Table 2 of CitationRef. 27 distinguishes between the delayed neutron fraction and the effective delayed neutron fraction for 235U delayed neutron precursor groups under static conditions, and the GOTHIC model utilizes the delayed neutron fraction. Table 1 of CitationRef. 28 reports the total values for the static and the circulating delayed neutron fractions for 235U of 0.0064 and 0.0034, respectively, for the MSRE, which are in good agreement with the total values predicted by GOTHIC in . The static value agrees, and GOTHIC slightly overpredicts the circulating value.
TABLE V GOTHIC-Predicted Delayed Neutron Fractions with 235U Fuel
Meanwhile, lists the same information for the 233U delayed neutron precursor groups, which are used in the natural circulation benchmark. Because Refs. 24 and Citation29 use “delayed neutron fraction” and “effective delayed neutron fraction” interchangeably, it is likely that the static 233U delayed neutron fraction values in Table 1 of CitationRef. 29 are actually effective delayed neutron fractions, but they are used as delayed neutron fractions for the purposes of the MSRE model. The reported values in Table 1 of CitationRef. 28 for static and circulating conditions for 233U are 0.00264 and 0.001714, respectively, for the MSRE, which are in good agreement with the total values predicted by GOTHIC in . Again, the static value agrees, but GOTHIC slightly underpredicts the circulating value.
TABLE VI GOTHIC-Predicted Delayed Neutron Fractions with 233U Fuel
VII. DELAYED NEUTRON TRANSIENT BENCHMARKS
Because the uranium is dissolved in the fuel salt in the MSRE, the delayed neutron precursors are not necessarily confined to the core. In a no-flow condition, all delayed neutron precursors decay within the confines of the core. However, when the fuel salt is flowing, the delayed neutron precursors are transported out of the core, and some decay outside of the core. As a result of this phenomenon, both the delayed neutron contribution to reactivity and the delayed neutron fraction are reduced when there is flow in the core. During zero-power physics testing in 1965, the impact on reactivity of starting and stopping the fuel salt pump was tested, as documented in CitationRefs. 30 and Citation27. During the tests, the reactivity effects were measured by letting the flux servo controller maintain the reactor critical by moving the control rod as necessary to maintain a stable neutron flux. The control rod position during these tests is reported in Fig. 24 of CitationRef. 27.
To benchmark these tests, the steady-state GOTHIC models are modified as follows. The reactor power is reduced to 10 W, assumed to be representative of a zero-power critical condition, which causes a negligible heat-up over the course of the transient. The forcing function controlling the flow rate of the volumetric pump representing the fuel salt pump is modified to reflect the flow profile of a pump start-up or coast-down using the information from of CitationRef. 27 for pump start-up and of CitationRef. 27 for pump coast-down. The flow data from CitationRef. 27 include oscillograph and logger output. Because CitationRef. 24 discusses a lag in the response of the online computer (logger) signal, oscillograph data are used for the benchmark.
The tracer sources that add decay heat neutron precursors are still active for these transients, but because the delayed neutron transients took place during the initial zero-power testing, there was no decay heat. Therefore, the model is initialized with no decay heat precursors in the fuel salt. Control variables are added to calculate the delayed neutron fraction based on the fraction of delayed neutron precursor activity that occurs in the core. The point kinetics model in GOTHIC continues to be solved using static beta effective, but the impact of circulating delayed neutron precursors is considered through a user-specified reactivity contribution that is tabulated dynamically using control variables and added to the other reactivity inputs (e.g., control rods and temperature coefficients) for the neutron kinetics module. If the reactivity is nonzero, control variables are used to add or remove reactivity at a rate and worth equivalent to the design speed of the control rod as necessary to maintain a net reactivity of zero.
Equation 5.36 of CitationRef. 31 relates reactivity to delayed neutron precursor group fractions:
where
| ρ = | = | reactivity |
| Λ = | = | prompt neutron lifetime |
| Tp = | = | reactor period |
| βi = | = | fraction of delayed neutron precursor group i relative to the overall neutron yield |
| λi = | = | decay constant of precursor group i. |
Equation (20) of CitationRef. 32 updates the above Inhour equation to account for flowing fuel:
where is the effective delayed neutron production fraction, and
is a quantity dependent on the fuel salt circulation rate. In other words, fuel salt circulation reduces the reactivity because some of the delayed neutron precursors decay outside the core. However, with a minimum of two unknowns—reactivity and reactor period—the usefulness of EquationEq. (18)
(18)
(18) for relating the delayed neutron fraction to reactivity is limited. Even so, it demonstrates that reactivity is proportional to the delayed neutron fraction. To eliminate the effect of reactor period and approximate the effects of EquationEq. (18)
(18)
(18) , the delayed neutron reactivity effect is modeled as a linear function of the delayed neutron fraction. As noted in , the static and flowing delayed neutron fractions are 0.00641 and 0.00370 for 235U fuel. These values are utilized in the linear reactivity function. The measured reactivity difference between no-flow and full-flow conditions is 0.212% δk/k (CitationRef. 27).
VII.A. Control Rod Response to Delayed Neutron Reactivity
As described in CitationRef. 20, flow restrictions in the moderator support structure produce a radial velocity distribution in the core, which is a phenomenon reflected in the four core regions of the GOTHIC model. During steady-state conditions, there is a uniform delayed neutron fraction across the core, but during a flow transient, the velocity profile causes the delayed neutron fraction in the core to be nonuniform for a period of time.
In the pump start-up and coast-down benchmarks, the delayed neutron reactivity was initially calculated assuming a uniform delayed neutron fraction in the core. However, the control rod, at or near the center of the core, is moved by the flux servo controller, whose input is neutron detectors external to the reactor vessel, as shown in Fig. 2.1.2 of CitationRef. 33. Hence, the neutron flux to which the control rod is responding is really driven by the transient delayed neutron fraction of the outer region of the core. shows the velocity of each region as well as the average core velocity under full-flow conditions and provides the corresponding delayed neutron fraction, suggesting that the delayed neutron fraction is an inverse function of fuel salt velocity. Because the region 4 velocity is slightly higher than the average velocity, it is expected that the region 4 transient delayed neutron fraction has a greater impact on transient reactivity than does the core average delayed neutron fraction. To demonstrate the impact of this, the pump start-up and coast-down transients are run both with the delayed neutron reactivity calculated based on the core average delayed neutron fraction and with the delayed neutron fraction of the outer core region (region 4).
TABLE VII GOTHIC-Predicted Delayed Neutron Fractions and Core Velocities
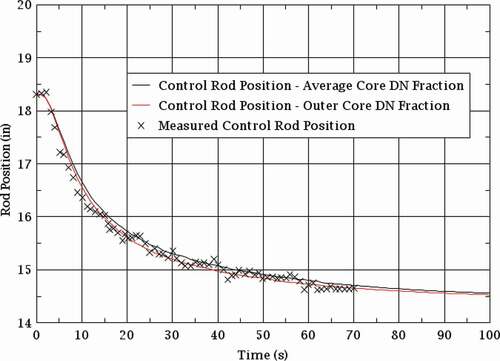
VII.B. Pump Start-Up Transient Benchmark Results
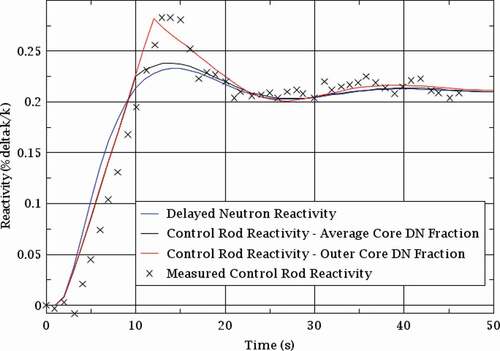
compares the control rod position calculated by GOTHIC with the measured control rod position for a pump start-up transient. With the delayed neutron reactivity based on the core average conditions, the control rod position profiles are consistent. There is an initial overshoot followed by oscillation around a final rod position that has not yet been achieved by the end of the available measured data. While GOTHIC underpredicts the rod position overshoot, it very nearly matches the subsequent rod position; the only difference is less oscillation around the apparent final rod position. With the delayed neutron reactivity responding to the outer core region delayed neutron fraction, the rod position calculated by GOTHIC almost matches the measured overshoot. Furthermore, the subsequent oscillation around the steady-state position is almost identical to those based on the core average delayed neutron reactivity, which confirms that the steady-state delayed neutron fraction is uniform throughout the core while the transient delayed neutron fraction is not. While the GOTHIC control variables regulating rod position utilize a dead band, its setpoints are set low for the pump start-up and pump coast-down transients as the actual dead band for the MSRE flux servo controller setpoint is unavailable.
Fig. 12. Pump start-up benchmark: control rod position
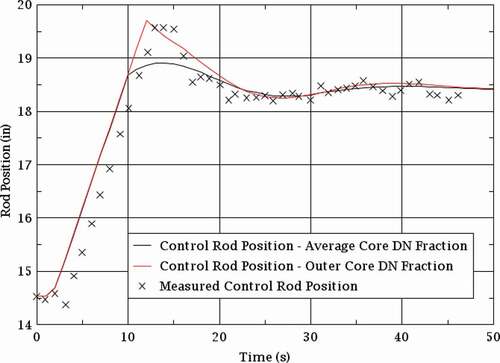
For the first 10 s, the control rod position profile is the same regardless of the delayed neutron fraction from which the delayed neutron reactivity is calculated. Afterward, the two profiles diverge because the outer core delayed neutron fraction adds more negative reactivity than does the average core delayed neutron fraction, and more rod motion is required to compensate.
compares the delayed neutron reactivity and the control rod reactivity with the reactivity associated with the measured control rod position for the same pump start-up transient. The control rod reactivity is calculated using the measured rod worth curve from CitationRef. 27. The delayed neutron reactivity is actually negative but is displayed as positive in in order to compare it with the control rod reactivity. The control rod reactivity lags the delayed neutron reactivity for the first 9 s of the transient because the control rod is moving to offset the effect of the delayed neutrons, but its speed is inadequate to initially keep up. As a result, the control rod reactivity overshoot subsequently exceeds that of the delayed neutron reactivity. After 25 s, the delayed neutron and control rod reactivity are virtually indistinguishable.
Fig. 13. Pump start-up benchmark: reactivity
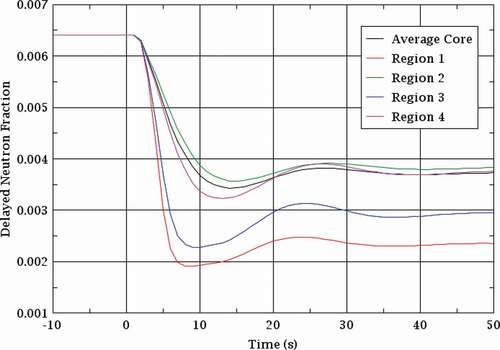
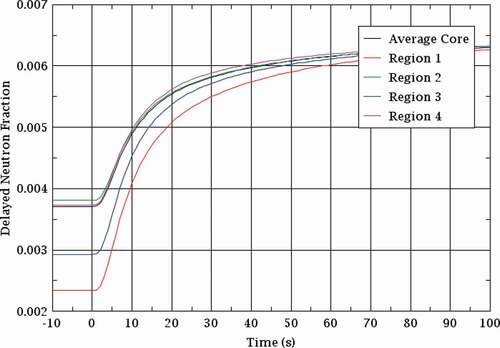
shows the whole-core delayed neutron fraction along with the delayed neutron fraction from each region of the core. In the absence of flow, the delayed neutron fraction is uniform throughout the core at the expected value of 0.0064 based on , which is verified via a 100-s initialization period prior to the start of the transient at time zero. Once the fuel salt pump is started, all delayed neutron fractions fall dramatically before oscillating around their ultimate steady-state values consistent with the values given in . Interestingly enough, the steady-state average core and region 4 delayed neutron fractions are almost identical, but the region 4 delayed neutron fraction experiences a faster reduction immediately following the pump start, which is why the control rods show a greater overshoot when controlled by the region 4 delayed neutron fraction. Furthermore, the post-overshoot rod motion oscillation shown in is consistent with the delayed neutron fraction oscillation behavior shown in .
Fig. 14. Pump start-up benchmark: delayed neutron fraction
VII.C. Pump Coast-Down Transient Benchmark Results
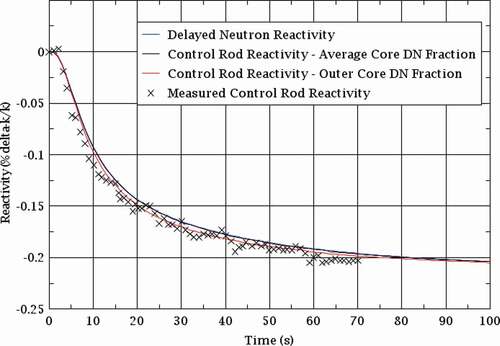
There are two phases to the flow coast-down transient. In the first phase, roughly the first 20 s, the pump coasts to a stop, and the flow slows to a stop, but the delayed neutron fraction in the core has not yet reached the steady-state value associated with a no-flow condition. In the second phase, the delayed neutron fraction progresses to that steady-state condition. compares the control rod position calculated by GOTHIC with the measured control rod position for a pump coast-down transient. While the rod position calculated by GOTHIC is slightly higher than the measured data for the first 20 s, during the flow coast-down, it is a reasonable match for the measured data, but the rod position based on the outer core delayed neutron reactivity is the better match. As with the pump start-up transient, the measured rod position data show oscillatory behavior indicative of a dead band on the flux servo controller setpoint, but it is not modeled because of its lack of availability in the MSRE documentation.
Fig. 15. Pump coast-down benchmark: control rod position
compares the delayed neutron reactivity and the control rod reactivity with the reactivity associated with the measured control rod position for the same pump coast-down transient. Because the delayed neutron reactivity changes associated with the coast-down transient are much slower than with a pump start-up transient, the control rod speed is adequate to add reactivity to immediately compensate for changes in reactivity. For this reason, the delayed neutron reactivity and control rod reactivity are virtually indistinguishable.
Fig. 16. Pump coast-down benchmark: reactivity
shows the whole-core delayed neutron fraction along with the delayed neutron fraction from each region of the core. In the presence of steady flow, each core region has its own steady-state delayed neutron fraction, which is verified via a 300-s initialization period prior to the start of the transient at time zero. Additionally, it can be seen that the average value is 0.0037, which is consistent with the circulating value reported in . Once the fuel salt pump is turned off, however, all delayed neutron fractions steadily rise toward the uniform steady-state value associated with zero flow, which is 0.0064 based on . As noted above, the steady-state average core and region 4 delayed neutron fractions under full-flow conditions are almost identical, but the region 4 delayed neutron fraction rises more quickly after the fuel salt pump is turned off, which is why the control rod motion is greater when controlled by the region 4 delayed neutron fraction.
Fig. 17. Pump coast-down benchmark: delayed neutron fraction
The results reported in this section and in Sec. VII.B for the pump start-up and coast-down transients, respectively, highlight the importance of the simulation to accurately reflect the location of the sensors and instrumentation in the real plant used to control the equipment as this impacts the accuracy of the simulation results relative to the measured plant response. The pump start-up and coast-down cases in which the delayed neutron reactivity is based on the outer core region delayed neutron fraction match the measured data better than do cases in which the delayed neutron reactivity is based on average core conditions. This suggests (1) that the lower velocity of the MSRE outer core region affects the delayed neutron precursor transient behavior such that it differs from the core average precursor behavior, (2) that this localized phenomenon affects the local transient reactivity response such that the neutron flux external to the core is impacted, and (3) that transient core power measurements based on ex-core neutron flux are affected by localized flow conditions in the outer core region. This revised approach for controlling this GOTHIC model is more consistent with reality and thus provides improved agreement. These results highlight the importance of the model being consistent with the actual plant controls.
VIII. NATURAL CONVECTION BENCHMARK
During lower-power testing with 233U fuel, a natural convection test was performed with no control rod motion such that reactor power was responding to the heat load demand from the radiator.Citation34 With forced circulation in the coolant salt loop, the radiator heat removal rate was increased in steps by incrementally opening the radiator door(s); each radiator adjustment was made after the reactor power rose as a result of the previous adjustment, thereby approaching equilibrium:
The inner and outer doors are closed for the first 20 min of the transient.
At 20 min, the outer door is opened 12 in. and remains at this position until 75 min.
At 75 min, the inner door is opened 12 in. The inner and outer doors remain at 12 in. until 140 min.
At 140 min, the inner and outer doors are opened to 15 in. and remain at this position until 195 min.
At 195 min, the inner door is opened to 21 in., and the outer door is opened to 20 in. They remain at these positions until the transient ends at 355 min.
The available data from the test are reactor power, heat exchanger fuel salt inlet and outlet temperatures, and heat exchanger coolant salt inlet and outlet temperatures, along with the timing of movements of the radiator doors, all of which are taken from Fig. 1.16 of CitationRef. 34. The assumed outside air temperature associated with the radiator is adjusted from the design value of 100°F to 75°F as this is considered to be more representative of actual conditions that would have been experienced during actual operation. Other model adjustments include applying assumed air flow rates for each radiator door position and adjusting heat exchanger and radiator performance for the conditions under consideration. In general, the radiator air flow rate is assumed to be a linear function of door position with two exceptions. For the first 20 min, the radiator doors are closed, and a small leakage flow rate is assumed to account for actual leakage or thermal conduction through the radiator doors and housing that the radiator model is not designed to simulate. Between 20 and 75 min, the outer radiator door is opened 12 in. such that there is some countercurrent natural convection. Because the radiator model is built to simulate flow from the inlet of the tube bundle to the outlet, a modest flow rate is assumed to approximate the effects of the natural convection scenario under consideration. Similarly, the radiator model, as built, assumes uniform air flow across all the radiator tubes. This is not the case during the natural convection transient because the radiator doors obstructed air flow to most of the tube surface area. As a result, the HTC multiplier for the radiator had to be adjusted to reflect the measured heat removal rate.
The tracer sources that add decay heat neutron precursors are still active for these transients, but because the natural convection benchmark took place during low-power testing at the beginning of operation with 233U fuel, there would have been a modest decay heat load from long-lived precursors, but its value is not available to the authors of this paper. Therefore, the model is initialized with no decay heat precursors in the fuel salt. Precursors are added during the transient in proportion to power level. As a result, the heat output includes decay heat although the low flow rates probably prevent the precursors from becoming well mixed in the system over the duration of the transient.
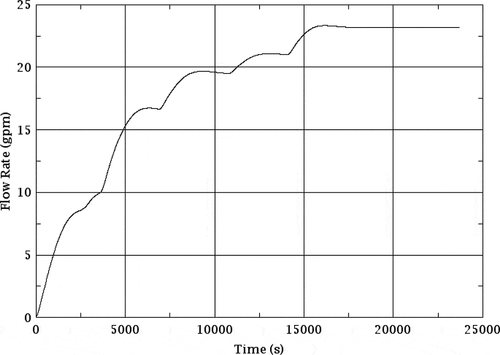
compares the reactor power calculated by GOTHIC with the measured data. and compare the heat exchanger fuel salt inlet and outlet temperatures with the measured data. and compare the heat exchanger coolant salt inlet and outlet temperatures with the measured data. In general, there is very good agreement between the parameters calculated by GOTHIC and the measured reactor power and system temperature data, demonstrating that the temperature coefficients of reactivity and the delayed neutron precursor logic in the neutron kinetics model control system allow the GOTHIC model to respond to changes in load. Although it is not included in the available measured data, the fuel salt flow rate is plotted in to demonstrate the flow rate response. Given the low flow rates, it is reasonable to expect that most of the shorter-lived decay heat precursors decay in the core and have little to no effect on the temperature drop in the fuel salt between the inlet and the outlet of the heat exchanger.
Fig. 18. Natural circulation benchmark: reactor power
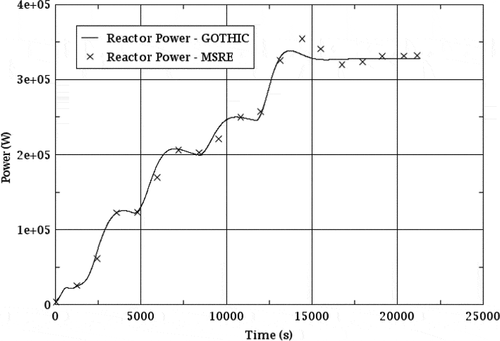
Fig. 19. Natural circulation benchmark: heat exchanger fuel salt outlet temperature
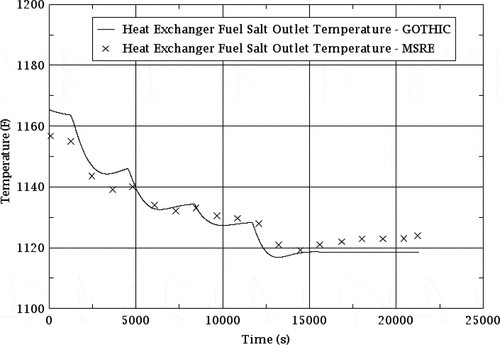
Fig. 20. Natural circulation benchmark: heat exchanger fuel salt inlet temperature
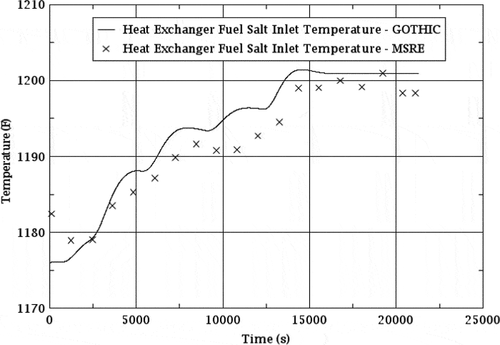
Fig. 21. Natural circulation benchmark: heat exchanger coolant salt inlet temperature

Fig. 22. Natural circulation benchmark: heat exchanger coolant salt outlet temperature
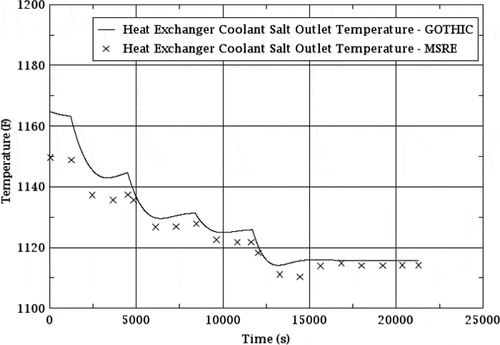
Fig. 23. Natural circulation benchmark: fuel salt flow rate
IX. CONCLUSIONS
GOTHIC is a general-purpose, thermal-hydraulic analysis tool that includes attributes of both system-level and CFD-like analysis tools. This makes the software applicable to a wide range of applications for both LWR and non-LWR designs. ADAMS ML071581053 (titled “Best Practice Guidelines for the Use of CFD in Nuclear Reactor Safety Applications”) poses guidelines for applying single-phase CFD codes in nuclear reactor safety problems, and GOTHIC is listed as a tool for 3D flows and “dispersal and deposition of radionuclides.” The quality assurance pedigree of GOTHIC is an important aspect for applications in the nuclear industry.
GOTHIC includes a tracer capability to track radioactive isotopes, decay heat, and delayed neutrons in flowing fuel that occurs both inside and outside the core region. The fundamental tracer models (e.g., convective transport, molecular and turbulent diffusion, decay heat release, etc.) have been verified using analytical solutions. Further, GOTHIC demonstrates good agreement with available design and experimental data for both steady-state and transient conditions for the MSRE. Also, the results presented for the pump start-up and coast-down transients highlight the importance of the simulation to accurately reflect the location of sensors and instrumentation in the real plant used to control equipment as this impacts the accuracy of the simulation results relative to the measured plant response.
CitationReference 35 provides a preliminary Phenomena Identification and Ranking Table for MSR designs. Important attributes that are highlighted in that review and already exist in GOTHIC are summarized as follows:
thermophysical properties including options for modeling the changing salt composition over time either using multiple fluid property tables or liquid components depending on the fluid property data that are available
steady-state or transient analyses
ability to directly model delayed neutron precursor production, transport, and decay throughout the primary loop including direct energy deposition to the fluid as demonstrated in this paper
DLLs to accommodate modifying correlations for heat transfer between fluid and structures, friction factors, etc., without having to modify or recompile the source code
flexible nodalization based on domain decomposition approach ranging from 0-D to full 3-D within a single model. This is a practical and computationally efficient approach for having an integrated representation of the entire system.
component-level models for plant equipment (e.g., pumps, valves, heat exchangers, etc.) as well as representations of plant control systems and trips
ability to represent arbitrary geometries of varying complexity using the FAVOR approach
Unlike many of the tools used historically in the nuclear industry, which assumed confined geometries and wall-drag–dominated flows, GOTHIC is able to model large open regions because it includes fluid-fluid shear, turbulence modeling, and second-order–accurate advection schemes. These elements allow GOTHIC to accurately simulate the multidimensional flow, mixing, stratification, buoyancy-driven natural circulation, and potential for recirculation regions in large open regions. Demonstrated examples of this are documented in the GOTHIC Qualification ReportCitation2 that is updated and released with each version of the software.
point kinetics model but also the ability to couple to a more detailed neutronics code if necessary through a generic interprocess communication capability including in GOTHIC
ability to model fission product transport and release
ability to model dissolved gas formation, transport, and release
ability to model the transport, settling, and resuspension of solid materials in the system arising from corrosion, plate-out, or other foreign objects
ability to model ice formation and melting for overcooling transients or freeze plugs
quality assurance program that complies with 10 CFR 50, Appendix B and applicable portions of ASME NQA-1 (particularly Subpart 2.7).
Future development is planned to modify the neutron kinetics in GOTHIC to better support MSR applications. For example, the ability to apply a time-dependent multiplier in the delayed neutron fraction rather than a constant value could be applied. Additionally, options to associate tracers with the kinetics model would allow GOTHIC to automatically calculate the delayed neutron precursor concentrations and apply them in the reactivity feedback calculation. In this current model the delayed neutron precursor concentrations were calculated using control variables and then were provided as inputs to the kinetics model. This is feasible, but it requires the end user to set up these control variables. Meanwhile, for void reactivity, GOTHIC will calculate the volume fraction and provide that as input to the point kinetics model throughout the transient. Using this same approach as is done for delayed neutron precursor concentrations would alleviate the need to set up these control variables, but it would not have any impact on the results presented. Additional work will also be necessary related to structural and chemical aspects to support aging effects, corrosion, thermal and mechanical stresses, and radiation damage. However, as it exists today, GOTHIC is able to provide results that are not realizable with other system or CFD tools. The system-level tools do not provide the multidimensional effects while the CFD tools present run-time limitations and do not provide an integrated system response because they do not include models for plant equipment (e.g., pumps, valves, heat exchangers, etc.) or control system logic. These capabilities and the results demonstrated in this paper confirm GOTHIC capabilities for modeling MSR designs with circulating fuel.
Acknowledgments
GOTHICTM incorporates technology developed for the electric power industry under the sponsorship of the Electric Power Research Institute.
Notes
a Code of Federal Regulations, Title 10, “Energy,” Part 50, “Domestic Licensing of Production and Utilization Facilities,” Appendix B, “Quality Assurance Criteria for Nuclear Power Plants and Fuel Reprocessing Plants,” U.S. Nuclear Regulatory Commission; ASME Nuclear Quality Assurance-1 (NQA-1), Subpart 2.7, “Quality Assurance Requirements of Computer Software for Nuclear Facility Applications.”
b The letter “s” in a control volume number indicates that the control volume is subdivided, where subdivisions can be added in one, two, or three dimensions. Most subdivided volumes in the MSRE are subdivided in only one dimension. Control volumes without “s” are lumped parameter, or 0-D, volumes.
References
- R. C. ROBERTSON, “MSRE Design and Operations Report, Part I, Description of Reactor Design,” ORNL-TM-728, Oak Ridge National Laboratory (1965).
- GOTHIC Thermal Hydraulic Analysis Package, Version 8.3 (QA), Electric Power Research Institute (2018).
- J. J. CARBAJO, D. DE WET, and N. R. BROWN, “Modeling the Molten Salt Reactor Experiment with the RELAP5-3D Code,” Trans. Am. Nucl. Soc., 116, 1503 (2017).
- C. SHI, M. CHENG, and G. LIU, “Development and Application of a System Analysis Code for Liquid Fueled Molten Salt Reactors Based on RELAP5 Code,” Nucl. Eng. Des., 305, 378 (Aug. 2016); https://doi.org/https://doi.org/10.1016/jnucengdes201605034.
- X. HE, “Validation of the TRACE Code for the System Dynamic Simulations of the Molten Salt Reactor Experiment and the Preliminary Study on the Dual Fluid Molten Salt Reactor,” PhD Thesis, Technical University of Munich (2016).
- A. M. LEANDRO et al., “Thermal Hydraulic Model of the Molten Salt Reactor Experiment with the NEAMS System Analysis Module,” Ann. Nucl. Energy, 126, 59 (2019); https://doi.org/https://doi.org/10.1016/j.anucene.2018.10.060.
- M. SCOTT GREENWOOD et al., “Demonstration of the Advanced Dynamic System Modeling Tool TRANSFORM in a Molten Salt Reactor Application via a Model of the Molten Salt Demonstration Reactor,” Nucl. Technol., 206, 3, 478504 (2020); https://doi.org/https://doi.org/10.1080/00295450.2019.1627124.
- K. PODILA, Q. CHEN, and Y. RAO, “CFD Simulations of Molten Salt Reactor Experiment Core,” Nucl. Sci. Eng., 193, 12, 1379 (2019); https://doi.org/https://doi.org/10.1080/00295639.2019.1627177.
- P. N. HAUBENREICH and J. R. ENGEL, “Experience with the Molten Salt Reactor Experiment,” Nucl. Appl. Technol., 8, 118 (1970).
- C. W. HIRT and J. M. SICILIAN, “A Porosity Technique for the Definition of Obstacles in Rectangular Cell Meshes,” Proc. 4th Int. Conf. Numerical Ship Hydrodynamics, Washington, D.C., September 24–27, 1985, Naval Ship Research and Development Center (1985).
- E. W. LEMMON, M. L. HUBER, and M. O. McLINDEN, “NIST Standard Reference Database 23: Fluid Thermodynamic and Transport Properties— REFPROP,” Version 9.0, Users Guide, National Institute of Standards and Technology.
- D. F. WILLIAMS, L. M. TOTH, and K. T. CLARNO, “Assessment of Candidate Molten Salt Coolants for the Advanced High-Temperature Reactor (AHTR),” ORNL/TM-2006/12, Oak Ridge National Laboratory (2006).
- D. F. WILLIAMS, “Assessment of Candidate Molten Salt Coolants for the NGNP/NHI Heat-Transfer Loop,” ORNL/TM-2006/69. Oak Ridge National Laboratory (2006).
- A. PADILLA JR., “High-Temperature Thermodynamic Properties of Sodium,” HEDL-TME 77–27, Hanford Engineering Development Laboratory (1978).
- J. K. FINK, “Computer Codes Used in the Calculation of High-Temperature Thermodynamic Properties of Sodium,” ANL-CEN-RSD-79-2, Argonne National Laboratory (1979).
- J. K. FINK and L. LEIBOWITZ, “Thermodynamic and Transport Properties of Sodium Liquid and Vapor,” ANL/RE-95/2, Argonne National Laboratory (1995).
- J. W. LANE et al., “Benchmark of GOTHIC to EBR-II SHRT-17 and SHRT-45R Tests,” Nucl. Technol., 206, 7, 1019 (2020); https://doi.org/https://doi.org/10.1080/00295450.2019.1698896.
- J. W. LANE et al., “Applicability of GOTHIC 8.3(QA) for Non-LWR Simulation, Aerosol Modeling & Hydrogen Management,” Proc. 18th Int. Topl. Mtg. Nuclear Reactor Thermal Hydraulics (NURETH-18), Portland, Oregon, August 18–22, 2019, American Nuclear Society (2019).
- J. W. LANE and T. L. GEORGE, “Development of a Multiple Liquid Component Capability in GOTHIC to Better Support Boric Acid, Radiological, and GSI-191 Analyses,” Proc. 16th Int. Topl. Mtg. Nuclear Reactor Thermal Hydraulics (NURETH-16), Chicago, Illinois, August 30–September 4, 2015, American Nuclear Society (2015).
- J. R. ENGEL and P. N. HAUBENREICH, “Temperatures in the MSRE Core During Steady-State Power Operation,” ORNL-TM-378, Oak Ridge National Laboratory (1962).
- R. J. KEDLE, “Fluid Dynamic Studies of the Molten-Salt Reactor Experiment (MSRE) Core,” ORNL-TM-3229, Oak Ridge National Laboratory (1970).
- R. HARVILL et al., “Benchmarking GOTHIC to the Molten Salt Reactor Experiment,” Trans. Am. Nucl. Soc., 121, 1745 (2019).
- R. C. ROBERTSON et al., “MSRE Design and Operations Report, Part III, Nuclear Analysis,” ORNL-TM-730, Oak Ridge National Laboratory (1964).
- P. N. HAUBENREICH et al., “MSRE Design and Operations Report, Part V-A, Safety Analysis of Operation with 233U,” ORNL-TM-2111, Oak Ridge National Laboratory (1969).
- “Standard Review Plan for the Review of Safety Analysis Reports for Nuclear Power Plants: LWR Edition,” NUREG-0800, Rev. 2, Sec. 9.2.5, “Ultimate Heat Sink,” Branch Technical Position ASB 9-2, “Residual Decay Energy for Light-Water Reactors for Long-Term Cooling,” U.S. Nuclear Regulatory Commission.
- “MSRE Systems and Components Performance,” ORNL-TM-3039, R. H. GUYMON, Ed., Oak Ridge National Laboratory (1973).
- B. E. PRINCE et al., “Zero-Power Physics Experiments on the Molten-Salt Reactor Experiment,” ORNL-4233, Oak Ridge National Laboratory (1968).
- P. N. HAUBENREICH and J. R. ENGEL, “Safety Calculations for MSRE,” ORNL-TM-251, Oak Ridge National Laboratory (1962).
- R. C. STEFFEY JR. and P. J. WOOD, “Theoretical Dynamic Analysis of the MSRE with 233U Fuel,” ORNL-TM-2571, Oak Ridge National Laboratory (1969).
- R. B. BRIGGS, “Molten-Salt Reactor Program Semiannual Progress Report for Period Ending August 31, 1965,” ORNL-3872, Oak Ridge National Laboratory (1965).
- S. GLASSTONE and A. SESONSKE, Nuclear Reactor Engineering, 3rd ed. (revised), Van Nostrand Reinhold Company, New York (1981).
- B. E. PRINCE, “Period Measurement on the Molten Salt Reactor Experiment During Fuel Circulation: Theory and Experiment,” ORNL-TM-1626, Oak Ridge National Laboratory (1966).
- J. R. TALLACKSON, “MSRE Design and Operations Report, Part IIA, Nuclear and Process Instrumentation,” ORNL-TM-729, Oak Ridge National Laboratory (1968).
- M. W. ROSENTHAL, R. B. BRIGGS, and P. R. KASTEN, “Molten-Salt Reactor Program Semiannual Progress Report for Period Ending February 28, 1969,” ORNL-4396, Oak Ridge National Laboratory (1969).
- N. R. BROWN et al., “Thermal-Hydraulic and Neutronic Phenomena Important in Modeling and Simulation of Liquid-Fuel Molten Salt Reactors,” Nucl. Technol., 206, 2, 322 (2020); https://doi.org/https://doi.org/10.1080/00295450.2019.1590077.